National First Nations Infrastructure Investment Plan 2015–2016
PDF version (1,062 Kb, 46 Pages)
QS-6374-000-EE-A1
Catalogue: R1-36E-PDF
ISSN: 1927-2200
As of May 7, 2015
Table of contents
- Introduction
- Program Overview
- Priority Action Areas
- Life Cycle Approach - AANDC Funded Community Infrastructure
- CFMP Resource Allocation Process
- First Nation Infrastructure Investment Planning Process
- National Balance Sheet (2015–2016)
- Appendix A — Regional Summaries
- Appendix B — National Priority Ranking Framework
- Glossary of Acronyms and Terms
Introduction
The First Nations Infrastructure Investment Plan is developed annually by Aboriginal Affairs and Northern Development Canada (AANDC) in partnership with First Nations, to strategically plan investments, in the short and medium term, while supporting a base of infrastructure that protects the health and safety and enables engagement in the economy.
This report explains how the First Nations Infrastructure Investment Plan is developed and provides an overview for investment and priority investment areas in accordance with the National Priority Ranking Framework (Appendix B). The current First Nations Infrastructure Investment Plan report provides an overview of investments planned through the Capital Facilities and Maintenance Program for the period 2015-2016 to 2019-2020 and captures planned projects as of May 7, 2015.
The First Nations Infrastructure Investment Plan is a process that is based on known factors at the time when each of the three linked plansFootnote 1 (community, regional and national) are prepared. The plan takes into account A-Base plus targeted fundingFootnote 2. However, it cannot anticipate unforeseen emergencies, new investment opportunities, or announcements that may arise in the course of the fiscal year. Adjustments to the plan may occur throughout the fiscal year as community, project and financial circumstances change. Therefore not all projects or reference levels identified in the national plan will receive the level of funding identified in a particular year.
Program Overview
The provision of community infrastructure funding to First Nations is based on the Government of Canada's spending power as a matter of social policy. The Capital Facilities and Maintenance Program is part of the Infrastructure and Capacity Strategic Outcome that falls under the broader Strategic Outcome "2015-16 Report on Plans and Priorities", which promotes full participation of First Nations, Métis, Non-Status Indians and Inuit individuals and communities in the economy.
The mandate of the Capital Facilities and Maintenance Program is to provide financial and advisory assistance to First Nations in the development of basic public infrastructure which is essential for healthy, safe and sustainable communities. This assistance is provided to First Nations on reserves, as well as First Nations and other eligible recipientsFootnote 3 on Crown land or recognized Indian land.
The objective of the Capital Facilities and Maintenance Program is to provide financial support to First Nations and other eligible recipients to:
- invest in physical assets (or services) that mitigate health and safety risks in their communities;
- ensure that assets meet established codes and standards;
- ensure that assets are managed in a cost-effective and efficient manner that protects, maintains and maximizes asset life cycle; and
- ensure that the above activities are undertaken in an environmentally sound and sustainable manner.
The Capital Facilities and Maintenance Program is intended to assist First Nations in the planning, construction and/or acquisition, as well as operation and maintenance of community infrastructure and facilities including the following asset categories:
- Water supply, treatment and distribution systems;
- Wastewater collection, treatment and disposal systems;
- Solid Waste collection and disposal;
- Elementary and secondary educational facilities;
- Housing;
- Roads and bridges;
- Fire protection including fire halls, fire vehicles and firefighting equipment;
- Electrical power generation and distribution;
- Community buildings such as community/recreation halls and band offices;
- Bulk fuel storage and distribution (non-commercial use);
- Structural Mitigation;
- Waste Management;
- Energy Systems;
- Remediation of contaminated sites;
- Land acquisition for approved community expansion; and
- Connectivity.
Priority Action Areas
Capital projects are subject to the Department's National Priority Ranking Framework, attached as Appendix B. Regional offices use the National Priority Ranking Framework to inform the development of their Regional First Nation Infrastructure Investments Plans. The Ranking Framework provides the foundation for consistent and transparent ranking of infrastructure investments. The Framework's priorities are defined by the following Program Activity Categories:
- Protection of health and safety as well as assets (assets require upgrading or replacement to meet appropriate standards);
- Health and safety improvements (upgrades of existing assets, new construction/acquisition projects to mitigate an identified significant risk to health and safety);
- Recapitalization/major maintenance (extend the useful operating life of a facility or asset, or maintain the original service level of the asset); and
- Growth (anticipated community growth requiring new construction, expansion or procurement of assets to maintain the level of service standards).
In addition to the National Priority Ranking Framework, additional internal ranking tools have been developed by the Department to further prioritize project proposals that fall within the same capital asset categories and priority level established by the National Priority Ranking Framework. The Priority Ranking Framework for Drinking Water and Wastewater Projects, the School Priority Ranking Framework and the Fuel Tank System Priority Ranking Framework are all points-based ranking tools that take into consideration multiple criteria. Weighted factors are then automatically applied to each criterion, to ensure that factors of highest priority (such as health and safety) maximally influence on the overall ranking score.
These ranking tools complement the existing National Priority Ranking Framework by helping regional decision makers refine their ranking of proposed projects in a fair and consistent manner to ensure that projects are funded on the basis of highest priority.
Life Cycle Approach — AANDC Funded Community Infrastructure
AANDC promotes a life-cycle approach for infrastructure assets starting with the use of full life-cycle costing when approving capital construction projects. This type of analysis allows for the consideration of all the associated costs (e.g. for design, construction, operation and maintenance, insurance, and major renovations) of the proposed infrastructure throughout its entire life cycle. This information is used to make comparisons between proposed options (e.g. building an expensive installation with low operating and maintenance costs versus a less-expensive facility with higher operating and maintenance costs) to determine the most cost-effective option in the short, medium, and long term. This exercise is also useful in determining the funding levels required from the First Nation in future years for the operation and maintenance of the proposed infrastructure.
During an asset's service life, AANDC provides funding support to First Nations to help pay for the operation and maintenance costs of funded infrastructure assets. AANDC also encourages good asset management practices by recommending that First Nations implement Maintenance Management Plans for major capital assets. To help First Nations achieve longer-term use of existing assets, AANDC funds inspections of some community assets such as schools, water and wastewater systems. Currently water and wastewater systems are inspected annuallyFootnote 4 while schools and other asset classes are inspected on a three-year cycle as a minimum.
As part of its efforts to encourage good asset management, AANDC provides approximately $10 million a year for hands-on training on how to operate, service and maintain First Nations water and wastewater systems, so that Aboriginal communities have safe access to drinking water. The Circuit Rider Training Program is a long-term capacity building program that provides training and mentoring services to operators of First Nations drinking water systems and wastewater systems. The Program helps to increase reliability of systems and ensures their efficient operation.
Capital Facilities and Maintenance Program Resource Allocation Process
AANDC allocates funding for the construction and the maintenance of community infrastructure to First Nations at regional level through formula, proposal based project funding or as a combination of both. The CFMP budget is divided into:
Formula-based funding, which includes:
- Operations and MaintenanceFootnote 5: for the operation and maintenance of existing community infrastructure assets. The level of funding provided to the First Nation varies from 20 percent to 100 percent depending on the type of asset.
- Minor CapitalFootnote 6: for housing and for acquisition, construction, renovation, or repair projects valued below $1.5 million.
Proposal-based funding, which includes:
- Minor Capital: for housing and for acquisition, construction, renovation, or repair projects valued below $1.5 million.
- Major Capital: for specific construction, acquisition, renovation, or significant repair projects valued above $1.5 million.
Major capital projects are funded primarily by targeted initiatives such as: funding announced by the Government of Canada for education facilities as part of the Economic Action Plan 2012, the First Nation Infrastructure Fund announced in Economic Action Plan 2013, and the extension of the First Nations Water and Wastewater Action Plan and the Education Infrastructure Fund announced in Economic Action Plan 2014.
First Nation Infrastructure Investment Planning Process
Under the Management Control Framework for the Capital Facilities and Maintenance Program, AANDC uses First Nation Infrastructure Investment Plans for capital planning. This process aims to improve resource management and increase accountability through better capital planning. An effective process depends on:
- nationally consistent planning practices, using a standardized Regional Investment Plan template;
- using the best-available information to create plans and then to update them to reflect the current situation;
- submission of community plans to their respective regions, followed by submission of regional plans to headquarters, as per established timelines; and
- plans that are balanced to community and regional allocations.
The First Nation Infrastructure Investment Plan planning process reflects the existing approval authorities and roles and responsibilities set out in the Management Control Framework and is designed around three linked plans that feed into one another:
- a community level plan, detailing infrastructure needs;
- a regional plan, planning out program expenditures; and
- a national plan, that provides a strategic overview of First Nations infrastructure needs and Capital Facilities and Maintenance Program investments.
First Nations Infrastructure Investment Plans — Community Level
First Nation Infrastructure Investment Plans are five-year capital investment plans created by each First Nation community which detail infrastructure needs and plans. As set out in the Reporting Guide, an updated Investment Plan must be prepared each year before capital funds are released to First Nations. It is developed by communities with the support of the AANDC regional offices and then submitted for validation and incorporation into the Regional Investment Plan.
It is AANDC's goal to ensure that every community develops their own five-year infrastructure plan based on an asset life-cycle approach. Where First Nations do not have the expertise or the capacity to develop their own community level five-year plan, AANDC officials at the regional level will assist communities with the identification of their infrastructure priorities and the development of infrastructure plans. AANDC is continuously working with First Nations to increase their capacity in this area.
First Nation Infrastructure Investment Plans — Regional Level
Regional Investment Plans are the key planning and reporting tools used by both regions and headquarters throughout the year. They are developed after validating proposed expenditures in First Nations Infrastructure Investment Plans against program criteria, and then planning the allocation of available resources to the highest priorities. The plans present regional data and analysis of investments per community per asset category over a five-year period. Regional offices also provide mid-year updates of their plan for use at the regional and national level.
Regional projects are prioritized using the National Priority Ranking Framework and other complementary asset-specific ranking tools (e.g. education facilities, water and wastewater, etc.). Higher priority projects are placed in the earlier years of the plan, while lower priority projects are placed in the later years, or beyond the current five-year plan. This, as well as the uncertainty with regard to the renewal of targeted funds, explains why some regions do not have planned investments for all categories, especially major capital projects, beyond the current fiscal year (see Appendix A).
First Nation Infrastructure Investment Plan — National Level
The National First Nation Infrastructure Investment Plan is a compilation of all eight Regional plans. It identifies investments per region per asset category, and presents national data and analysis of Capital Facilities and Maintenance Program capital planning. The National First Nation Infrastructure Investment Plan is reviewed annually by the departmental Operations Committee made up of AANDC senior management and is published on the departmental website.
National Balance Sheet (2015–2016)
| A. 2014—2015 Estimated Operating Budget (All Votes) | $1,252,453,270 |
|---|---|
| B. Supplementary Estimates (All Votes) | |
| Budget 2014 (Schools) | 50,000,000 |
| Operation Return Home (Re-profile) | 40,574,999 |
| Sub-total B | $90,574,999 |
| C. Other Internal Reallocations into CFMP (as of May 7, 2015) | $59,591,376 |
| D. Non-CFMP Activity Incl. in Main Estimates (All Votes) | |
| Emergency Management Assistance Program | 70,252,180 |
| Renewable Energy and Energy Efficiency | 3,794,367 |
| Sub-total D | $74,046,547 |
| E. Revised Overall CFMP Budget All Votes (A+B+C-D) | $1,328,573,098 |
| F. 2015-2016 CFMP Planned Investments | |
| Total FNIIP (Vote 10, planned) | 1,131,274,528 |
| Building Canada Fund | 15,000,000 |
| Special Initiative Fund | 1,117,192 |
| Unallocated Centrally Managed Funds (FMC + RO Reserve)* | 17,789,945 |
| CFMP Salaries and O&M (Vote 1 and Vote 5) | 29,274,347 |
| Statutory (Employee Benefit Plan & Other Operating/Capital Costs) | 4,204,676 |
| Sub-total F | $1,198,660,688 |
| Variance (E-F) | $129,912,410 |
| *Please note that these Unallocated Centrally Managed Funds may not be available for the Infrastructure and Capacity/Capital Facilities Management program as they may be utilized for other programs. | |
The purpose of the 2015-2016 National Balance Sheet is to provide a detailed comparison between funds that are earmarked within the Main and Supplementary Estimates for the Capital Facilities and Maintenance Program and what is being planned for in the First Nation Infrastructure Investment Plan.
The Capital Facilities and Maintenance Program falls under the Infrastructure and Capacity Program, within the Lands and Economy Strategic Outcome, which include resources being targeted for programs that are outside of the delivery of the Program: Emergency Management, Forest Fire Suppression and Climate Change and Energy Efficiency. Once the non-Capital Facilities and Maintenance Program items are removed, Main Estimates combine with the Supplementary Estimates, plus internal budget transfers into the Capital Facilities and Maintenance Program to provide the overall available Program budget for a given fiscal year.
As a result of the 2015-2016 First Nation Infrastructure Investment Plan being developed in advance of the current fiscal year, there are typically a number of items that AANDC regions have difficulty planning for due to uncertainty surrounding approval of new initiatives and/or unknown regional budgets. Therefore, the total National First Nation Infrastructure Investment Plan (planned Vote 10) includes planned funding for key targeted initiatives such as the First Nations Water and Wastewater Action Plan, and the Education Infrastructure Fund both announced as part of Budget 2014, but it does not include the Building Canada Fund portion of the First Nation Infrastructure Fund that was announced as part of Budget 2013. The Building Canada Fund is being centrally managed and had not been allocated to AANDC regions at the time the plan was created.
The variance represents the difference between the overall Capital Facilities & Maintenance Program budget and the planned investments for the Program. This difference typically represents the reallocation of funding out of the Program to primarily cover potential shortfalls in core program areas such as Education and Social Development. This reallocation occurs at the regional level once budgets are transferred from headquarters to regions. The actual reallocation amount could be higher than the approximate $130 million identified in the National Balance Sheet as the Total Investment Plan (planned Vote 10) includes approximately an additional 10% of over-programming of major capital projects (based on total project costs) to account for both delays to projects outside of AANDC's control and/or additional funds becoming available later in the fiscal year. The actual reallocation amount can be verified when Public Accounts are finalized for the 2015-2016 fiscal year.
National Breakdown of Planned Spending
2015–2016: (Vote 10 Only)
| A. Major Capital (Proposal) | % of Total Proposed Funding | |
|---|---|---|
Education Facilities |
$92,484,408 | 46% |
Water and Wastewater |
$189,386,485 | |
Contaminated Sites |
$10,246,210 | |
Community Infrastructure |
$95,536,607 | |
Sub-total A |
$387,653,710 | |
| B. Minor Capital (Proposal) | $133,484,283 | |
| Total Proposal Funding (A+B) | $521,137,993 | |
| C. Minor Capital (Formula) | $204,142,674 | 54% |
| D. Operations & Maintenance (Formula) | $405,993,861 | |
| Total Formula Funding (C+D) | $610,136,535 | |
| Grand Total | $1,131,274,528 | |
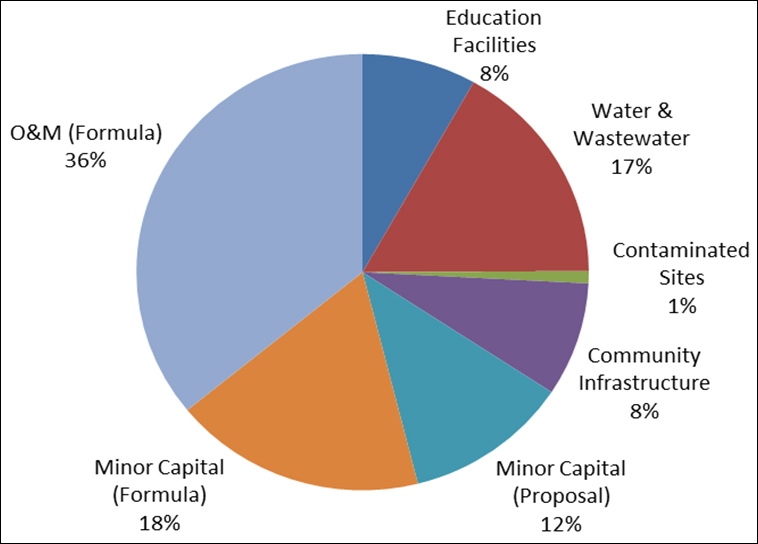
Expand for text description of this chart
This is a chart showing the national breakdown of planned spending for Vote 10 in 2015-2016. The chart is a pie chart showing percentage distribution of funding by asset and category. Major capital Education facilities represent 8% of all Vote 10 investments, Major capital Water and sewer, 17 %, Major capital Contaminated sites, 1%, Major capital Community infrastructure, 8%, Minor capital formula-driven (incl. housing), 18%, Minor capital proposal-driven, 12% and Infrastructure O&M, 36%.
Proposal-Driven ProjectsFootnote 7 (Excluding Formula-Driven Funding)
| First Nation Infrastructure Capital Projects proposed in 2015-2016 (includes major and minor projects) | 666 |
|---|---|
| First Nation Infrastructure Capital Projects proposed in the five year plan (includes major and minor projects) | 1,062 |
| Planned Spending (current year) | $521,137,993 |
| Planned Spending (five year aggregate) | $1,302,802,384 |
| Total Infrastructure Investment 2015-2016 | $1,131,274,528 |
| First Nation Population | 475,673 |
| Infrastructure Investment per Capita | $2,378 |
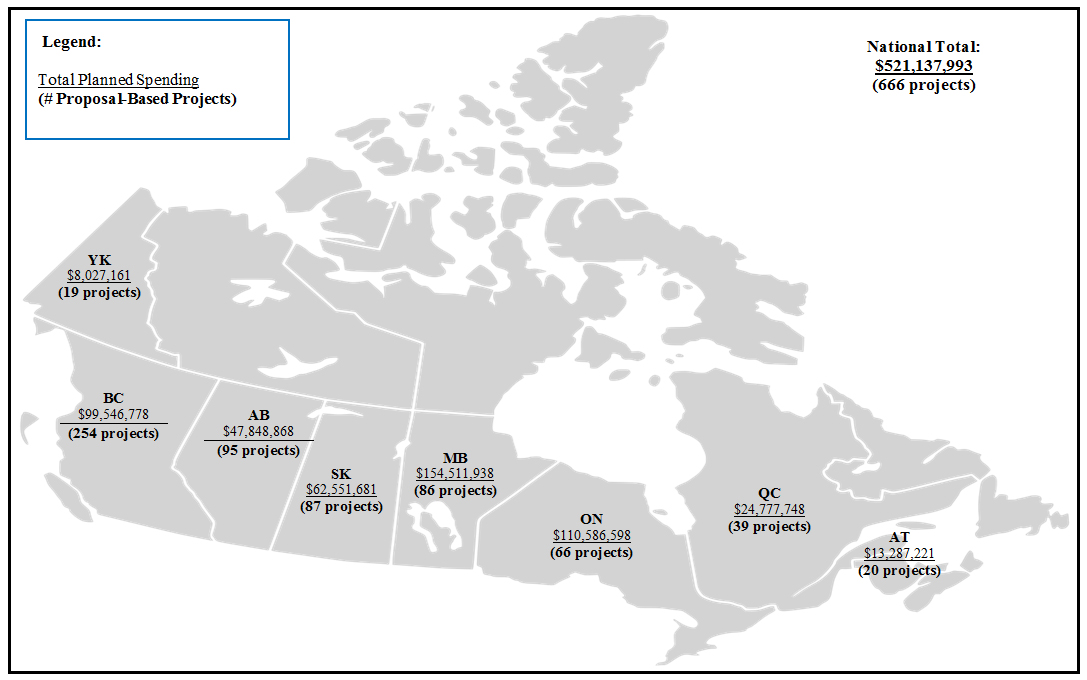
Expand for text description of this map
This graphic illustrates AANDC distribution of proposal projects per Region for the 2015-2016 period. The regions are shown over their respective locations on a map of Canada. The regions shown geographically are: Yukon, British Columbia, Alberta, Saskatchewan, Manitoba, Ontario, Quebec and Atlantic.
For each region total amount of 2015-2016 proposal funding is given as well as total number of proposal-based projects planned for 2014-2015.
- Yukon has total planned spending of $8,027,161 and 19 proposal-based projects in 2015-2016.
- British Columbia has total planned spending of $99,546,778 and 254 proposal-based projects in 2015-2016.
- Alberta has total planned spending of $47,848,868 and 95 proposal-based projects in 2015-2016.
- Saskatchewan has a total planned spending of $62,551,681 and 87 proposal-based projects in 2015-2016.
- Manitoba has a total planned spending of $154,511,938 and 86 proposal-based projects in 2015-2016.
- Ontario has a total planned spending of $110,586,598 and 66 proposal-based projects in 2015-2016.
- Quebec has a total planned spending of $24,777,748 and 39 proposal-based projects in 2015-2016.
- Atlantic has a total planed spending of $13,287,221 and 20 proposal-based projects in 2015-2016.
- Nationally, there is a total of $521,137,993 of planned proposal project spending and 666 proposal-based projects in 2015-2016.
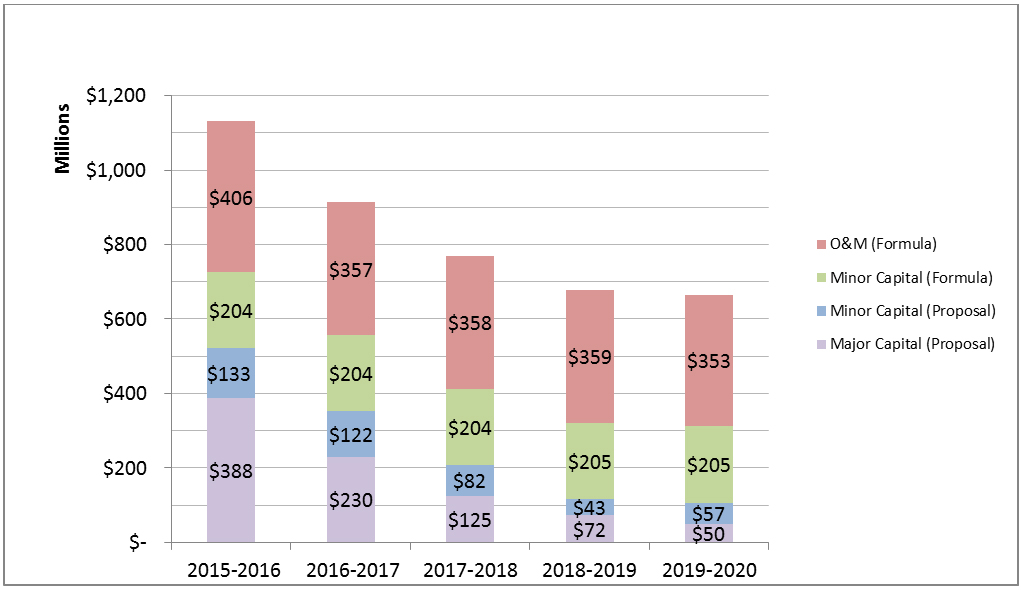
Expand for text description of this Graph 1
A chart showing the Planned Funding by Major Capital, Minor Capital Proposal, Minor Capital Formula and O&M for the period between 2015-2016 and 2019-2020 at the national level. The chart is a stacked bar-chart showing funding distribution by funding type.
- In 2015-16, Infrastructure O&M represents $406M, Minor Capital – formula-driven, $204M, Minor Capital - proposal-driven, $134M, and Major Capital, $388M for a total of $1,131M.
- In 2016-17, Infrastructure O&M represents $357M, Minor Capital – formula-driven, $204M, Minor Capital - proposal-driven, $122M, and Major Capital, $230M for a total of $913M.
- In 2017-18, Infrastructure O&M represents $358M, Minor Capital – formula-driven, $204M, Minor Capital - proposal-driven, $82M, and Major Capital, $125M for a total of $769M.
- In 2018-19, Infrastructure O&M represents $359M, Minor Capital – formula-driven, $205M, Minor Capital - proposal-driven, $43M, and Major Capital, $72M for a total of $679M.
- In 2019-20, Infrastructure O&M represents $353M, Minor Capital – formula-driven, $205M, Minor Capital - proposal-driven, $57M, and Major Capital, $50M for a total of $665M.
Trends by Funding Type
Graph 1 illustrates the breakdown of planned spending (vote 10) by funding stream for the current fiscal year as well as a four-year projection. In 2015-2016, Operation and Maintenance funding represents the largest area of investment with approximately 36% of the total planned funding. Close behind is the planned funding for Major Capital at 34% and finally Minor Capital Formula at 18% and Minor Capital Proposal at 12% of the total planned funding amount for 2015-2016. Overall, formula-based funding represents the largest proportion of planned spending in 2015-2016. For a comparison of overall planned funding with last year's plan, please refer to the 2014-2015 First Nation Infrastructure Investment Plan.
Despite Major Capital funding being one of the largest areas of investment for the 2015-2016 fiscal year, a significant decline is planned over the five years outlined in the current plan, from 34% of the overall planned budget to 7% in the final year of the plan. A similar trend, though with a less severe drop, can be observed within the Minor Capital Proposal-Driven funding stream, which sees 12% of the overall planned budget in the initial year drop to 9% in the final year of the plan. This decline is partly attributed to the continued investment in the construction of new facilities, and in the major renovation and/or additions of existing facilities which increases the need for funding to operate and maintain these assets. This is slowly reducing the amount of capital funding that is available for major and minor capital proposal-based projects. Also, the expiration of certain targeted funding initiatives detailed in the next section is further enhancing this downward trend.
Operation and Maintenance and Minor Capital Formula funding levels remain fairly constant over the course of the five-year plan. This is a result of both Minor Capital Formula and Operation and Maintenance reference levels being established by way of formula and provided directly to First Nations. The large drop in Operation and Maintenance funding from $406 million in 2015-2016 to $357 million in 2016-2017 can be attributed to the expiration of First Nations Water and Wastewater Action Plan at the end of the 2015-2016 fiscal year as well as a few single-year Operation and Maintenance projects.
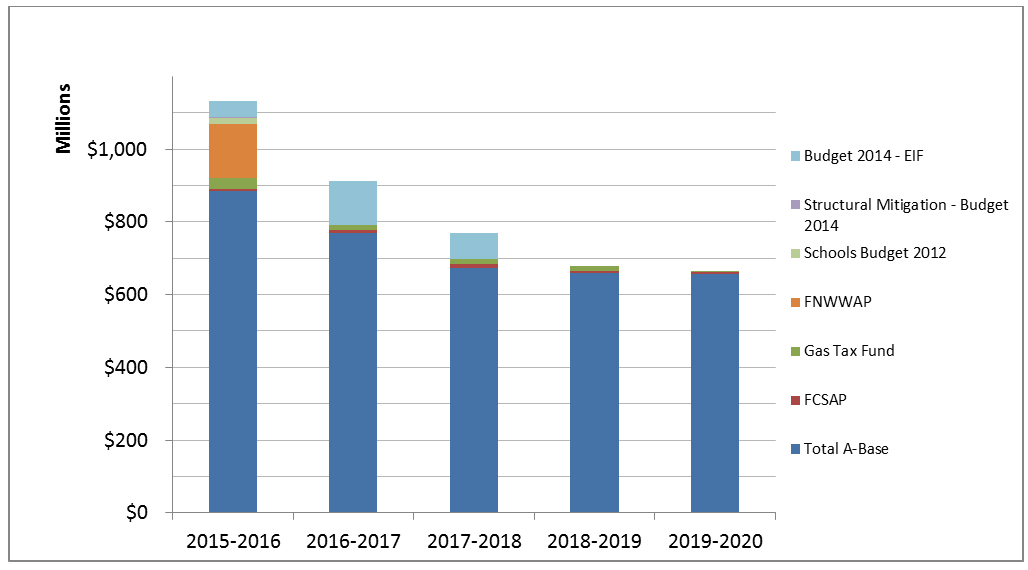
Note: This table does not include the $155 million over 10 years announced from Budget 2013 from the new Building Canada Fund, to be delivered through AANDC's First Nation Infrastructure Fund. These funds are centrally managed and have not been allocated to regions when this plan was prepared on April 1, 2015.
Expand for text description of Graph 2
This is a chart showing the Planned Funding by funding source for the period between 2015-2016 and 2019-2020 at the national level. The chart is a stacked bar-chart showing funding distribution by funding source.
- In 2015-16, A-Base represents $883M, Federal Contaminated Site Action Plan $7M, Gas Tax Fund $28M, First Nations Water and Wastewater Action Plan $150M, Budget 2012 (Schools) $15M, Budget 2014 (Schools) $44M and Structural Mitigation Budget 2014 $3M, for a total of $1,131M.
- In 2016-17, A-Base represents $769M, Federal Contaminated Site Action Plan $8M, Gas Tax Fund $14M, and Budget 2014 (Schools) $122M, for a total of $913M.
- In 2017-18, A-Base represents $671M, Federal Contaminated Site Action Plan $12M, Gas Tax Fund $13M, and Budget 2014 (Schools) $71M, for a total of $769M.
- In 2018-19, A-Base represents $657M, Federal Contaminated Site Action Plan $7M, and Gas Tax Fund $13M, for a total of $679M.
- In 2019-20, A-Base represents $654M, Federal Contaminated Site Action Plan $5M, and Gas Tax Fund $4M, for a total of $665M.
Trends by Funding Source
The decrease in planned capital funding levels in 2015-2016 and onwards, as illustrated by Graph 2, can be attributed to the expiration of certain targeted funding over the five years of the current First Nation Infrastructure Investment Plan, with no confirmed renewal at this point in time. There is also a slight decline in total planned funding levels when comparing 2015-2016 A-Base (see glossary for definition of A-base funding) funding levels to future years. This is due to a number of factors including over programming of current year capital projects and a practice of developing infrastructure investment plans that focus on the current year and lack detail on future year plans.
Through the Economic Action Plan 2014, The Government of Canada has committed $500 million over seven years for an Education Infrastructure Fund, starting in 2015-2016. AANDC is also allocating an additional $175 million in departmental A-Base for a total investment of $675 million over seven years for new education facilities projects, remediation of existing education facilities, and in support of innovative and cost-efficient education facilities projects. These funds represent a continuation of the $175 million over three years announced in Economic Action Plan 2012 and will help sustain progress made to date in providing First Nation children and youth with better learning environments.
Access to safe drinking water, the effective treatment of wastewater and the protection of sources of drinking water on First Nation lands is a priority for the AANDC. The First Nations Water and Wastewater Action Plan was introduced in 2008, and extended in 2010 and 2012. Economic Action Plan 2014 provided an additional $323.4 million over two years, beginning 2014-2015, to continue to implement the First Nations Water and Wastewater Action plan, including $276 million for AANDC ($274.6 million for operating expenditures and grants and contributions, and $1.4 million for accommodation) and $47.4 million for Health Canada ($46.3 million for operating expenditures and grants and contributions, and $1.1 million for accommodation). These investments support First Nations communities in managing their water and wastewater infrastructure.
Beginning with $3 million in 2015-2016, AANDC has begun to receive $40 million over five years from Economic Action Plan 2014 for disaster mitigation programming in First Nation communities. These funds will support structural mitigation measures that will reduce the possible impacts of hazards, and include the application of engineering techniques to achieve hazard-resistance and resilience in structures or systems.
In Economic Action Plan 2013, the Government of Canada announced $155 million over 10 years from the new Building Canada Fund in addition to $139 million over five years from the Gas Tax Fund to be delivered to First Nations through AANDC's First Nation Infrastructure Fund starting in 2014-2015. The Gas Tax Fund is a permanent funding which is re-calculated every five years based upon First Nation population. The First Nation Infrastructure Fund focuses on six priority areas: improving First Nations energy systems (linking to power grids, sustainable energy systems), broadband connectivity, solid waste management (including landfills and recycling), road and bridge projects, disaster mitigation, and community planning and/or skills development projects that will support long-term sustainable community development of First Nation communities.
To help First Nations ensure that the fuel tanks that power their essential community services, such as water and wastewater treatment systems, schools and community buildings, meet Environment Canada's regulations, $45 million over four years (2011-2016) was approved in the 2011 Federal Budget. In addition, AANDC committed $34.5 million over 5 years (2011-2016) from the Capital Facilities and Maintenance Program for a total investment of $79.5 million.
The Federal Contaminated Sites Action Plan, a cost-shared program that supports federal departments, agencies and consolidated Crown corporations in addressing contaminated sites for which they are responsible, is now in its second phase (2011-2016). The focus of Phase II is on remediating the highest-priority sites, to reduce their environmental and human health risks, and their associated financial liabilities. While contaminated sites on reserve lands are managed under AANDC's Contaminated Sites Management Program, the Capital Facilities and Maintenance Program can be used to fund contaminated site projects.
Planned Funding in 2015–2016 - Proposal-Driven Capital ProjectsFootnote 8 Only
Expand for text description of Graph 3
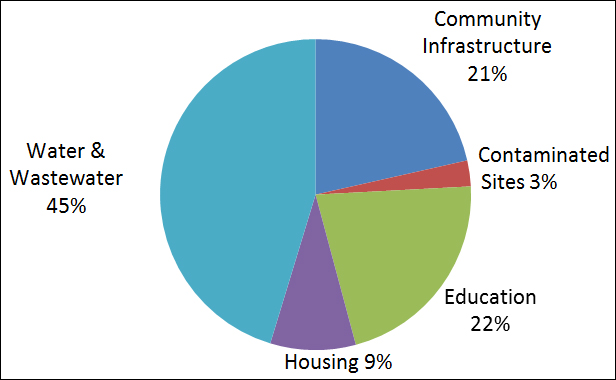
This is a chart showing the national breakdown of planned spending for Major and Minor Proposal-Driven Capital Projects in 2015-2016. The chart is a pie chart showing percentage distribution of funding by asset class. Water and Sewer represent 45%, Education facilities, 22%, Community Infrastructure 21%, Housing 9% and Contaminated Sites, 3%.
Graph 3 demonstrates the spread of proposal funding by asset category. Proportionately, the percentage share of proposal projects is very similar to the 2014-2015 Plan. As was the case in 2014-2015, Water and Wastewater is the largest asset category at 45%, followed by Community Infrastructure (including projects such as roads & bridges, fuel tanks and fire protection) at 21%, and then Education with 22% of total proposal funding. These categories form the major portion of proposal projects because of targeted funding initiatives and the way projects are prioritized. Housing and Contaminated Sites represent a smaller portion of proposal projects, at 9% and 3% respectively.
Expand for text description of Graph 4
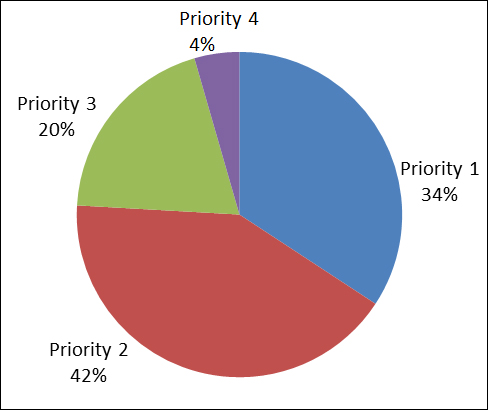
This is a chart showing the national breakdown of planned spending for Major and Minor Proposal-based projects in 2015-2016. The chart is a pie chart showing percentage distribution of funding by priority ranking. Priority 1 represents 34%, Priority 2, 42%, Priority 3, 20%, and Priority 4, 4%.
Graph 4 illustrates that Priority 1 represents 34% of all planned projects being funded this year. This priority, as per the National Priority Ranking FrameworkFootnote 9, only includes water and wastewater projects. Projects can either be upgrades to existing systems or new construction, to deal with imminent health and safety risks, water or wastewater quality, legislative or regulatory requirements. Priority 2 represents the largest portion of all planned projects at 42%. Unlike Priority 1, Priority 2 projects include all asset classes and cover all program activity categories. This category includes targeted initiatives, such as the Education Infrastructure Fund announced in Budget 2014 to assist First Nations in the construction or renovation of education facilities. The First Nation Infrastructure Fund, which supports improvement to the environment and quality of life in First Nation communities is also included. Priority 3 projects represent a total of 20% and Priority 4 represents 4%. These priorities focus on anticipated population growth. The investments required to effectively address Priority 1 and 2 projects limit the number of Priority 3 and 4 projects that can be funded within the existing Capital Facilities and Maintenance Program envelope.
Infrastructure Capital – Investment Opportunities
For the purpose of the First Nation Infrastructure Investment Plan, an investment opportunity is defined as a project that meets program criteria but is not funded under the current plan (2015-2016 to 2019-2020). These projects may or may not have previously received funding. Capital projects planned within the five years which do not have an identified source of funds are also considered to be investment opportunities. The 2015-2016 First Nation Infrastructure Investment Plan includes 1,818 capital projects valued at approximately $5.3 billion that regions identified in their First Nation Infrastructure Investment Plans as investment opportunities. These investment opportunities can be further broken down by asset class and national priority ranking.
Expand for text description of Graph 5
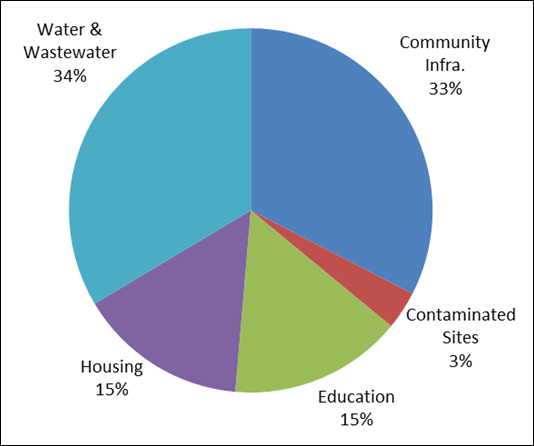
This is a chart showing the national breakdown of investment opportunities for capital. The chart is a pie chart showing percentage distribution of funding requests by asset class. Water and sewer represents 34%, Community infrastructure, 33%, Education facilities 15%, Contaminated Sites, 3%, and Housing, 15%.
Graph 5 demonstrates the need by major asset category as identified in the five-year plan. The highest demand for infrastructure projects is in the asset category of Water and Wastewater at 34%, Community Infrastructure projects are the next highest in demand at 33%, followed by Education and Housing projects at 15% each, and Contaminated Sites at 3%.
Expand for text description of Graph 5
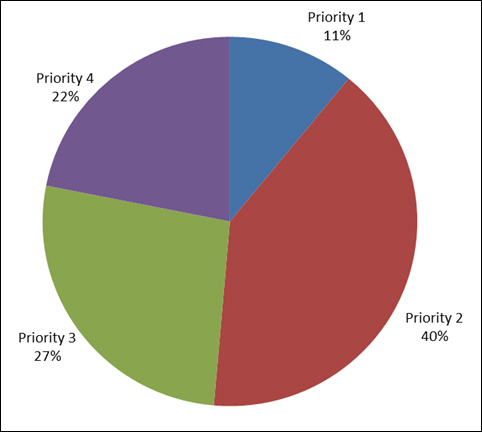
This is a chart showing the national breakdown of investment opportunities for capital. The chart is a pie chart showing percentage distribution of funding requests by priority ranking. Priority 1 represents 11%, Priority 2, 40%, Priority 3, 27%, and Priority 4, 22%.
Graph 6 illustrates that Priority 1 projects represent 11% of the total future investment opportunities as identified by regions. Priority 1 projects can either be repairs/upgrades or new construction of water or wastewater facilities, to deal with imminent health and safety risks, water quality and legislative/regulatory requirements. Priority 2 projects represent 40% of all unfunded projects. For Priority 2, projects include all asset categories and cover almost all program activity categories, except for Growth/Need beyond 2 years, which explains its large percentage. Priority 3 and 4 projects represent a combined total of 49% of investment opportunities. These priorities focus on anticipated population growth. As Priorities 1 and 2 represents a total of 51%, the likelihood of Priority 3 and 4 projects receiving funding is limited.
2015–2016 Planned Acquisition and Construction of Facilities (Proposal & Formula-Based Capital Projects and Operations & Maintenance)
| Project Category | Previous Year (Planned Amount in 2014–2015) |
Planned Spending | ||||
|---|---|---|---|---|---|---|
| 2015–2016 | 2016–2017 | 2017–2018 | 2018–2019 | 2019–2020 | ||
| Proposal Based Capital Projects | ||||||
| Community Infrastructure | 140,249,015 | 111,857,078 | 60,966,094 | 25,360,860 | 35,889,590 | 21,958,872 |
| Contaminated Sites | 9,664,723 | 13,995,410 | 9,584,719 | 14,739,737 | 8,707,628 | 5,650,344 |
| Education | 123,224,131 | 112,971,876 | 163,972,462 | 92,900,376 | 11,300,000 | 10,500,000 |
| Housing | 39,028,966 | 46,272,853 | 35,045,333 | 30,330,333 | 12,020,333 | 10,720,333 |
| Water and Wastewater | 189,736,952 | 236,040,776 | 82,610,865 | 43,582,661 | 47,700,961 | 58,122,891 |
| Sub-Total (Proposal) | $501,903,787 | $521,137,993 | $352,179,473 | $206,913,967 | $115,618,512 | $106,952,440 |
| Formula Driven Capital | ||||||
| Community Infrastructure | 118,537,290 | 104,939,578 | 105,608,081 | 106,612,501 | 106,078,424 | 105,894,037 |
| Contaminated Sites | - | - | - | - | - | - |
| Education | 14,562,429 | 4,843,796 | 4,763,696 | 4,774,696 | 5,108,896 | 5,068,896 |
| Housing | 88,093,460 | 86,234,810 | 88,900,757 | 88,039,205 | 88,694,635 | 89,135,670 |
| Water and Wastewater | 13,408,544 | 8,124,490 | 4,756,761 | 5,012,884 | 4,806,434 | 4,911,969 |
| Sub-Total (Formula) | $234,601,723 | $204,142,674 | $204,029,295 | $204,439,286 | $204,688,389 | $205,010,572 |
| Operations & Maintenance | ||||||
| Community Infrastructure | 157,043,540 | 160,828,633 | 152,832,504 | 153,312,569 | 153,822,351 | 149,240,767 |
| Contaminated Sites | 400,000 | 3,654 | - | - | - | - |
| Education | 102,578,951 | 112,248,732 | 111,962,582 | 112,035,667 | 112,110,213 | 112,186,252 |
| Housing | 8,898,906 | 2,525,767 | 1,945,547 | 1,945,547 | 1,945,547 | 1,890,324 |
| Water and Wastewater | 130,827,951 | 130,387,075 | 90,337,321 | 90,625,692 | 90,919,831 | 89,509,036 |
| Sub-Total (O&M) | $399,749,348 | $405,993,861 | $357,077,954 | $357,919,475 | $358,797,942 | $352,826,379 |
| Grand Total | ||||||
| Community Infrastructure | 415,829,846 | 377,625,289 | 319,406,679 | 285,285,930 | 295,790,364 | 277,093,677 |
| Contaminated Sites | 10,064,723 | 13,999,064 | 9,584,719 | 14,739,737 | 8,707,628 | 5,650,344 |
| Education | 240,365,511 | 230,064,404 | 280,698,740 | 209,710,739 | 128,519,109 | 127,755,148 |
| Housing | 136,021,332 | 135,033,430 | 125,891,637 | 120,315,085 | 102,660,515 | 101,746,327 |
| Water and Wastewater | 333,973,447 | 374,552,341 | 177,704,947 | 139,221,237 | 143,427,226 | 152,543,896 |
| Grand Total | $1,136,254,858 | $1,131,274,528 | $913,286,722 | $769,272,728 | $679,104,842 | $664,789,392 |
| The dashes above indicate that planned funding in this category has yet to be determined. Funding levels may only be known just prior to the commencement of the fiscal year in question. *Community Infrastructure category includes various asset classes such as Roads & Bridges, Electrification, Connectivity, Solid Waste, Fuel Tanks, and others. |
||||||
Appendix A — Regional Summaries
Atlantic Region
Breakdown of planned spending 2015-2016: (Vote 10 Only)
| A. Major Capital (Proposal) | % of Total Proposed Funding | |
|---|---|---|
Education Facilities |
$5,000,000 | 32% |
Water and Wastewater |
$4,410,000 | |
Contaminated Sites |
$0 | |
Community Infrastructure |
$1,000,000 | |
Sub-total A |
$10,410,000 | |
| B. Minor Capital (Proposal) | $2,877,221 | |
| Total Proposal Funding (A+B) | $13,287,221 | |
| C. Minor Capital (Formula) | $9,076,301 | 68% |
| D. Operations & Maintenance (Formula) | $19,194,667 | |
| Total Formula Funding (C+D) | $28,270,968 | |
| Grand Total | $41,558,189 | |
Expand for text description of this chart
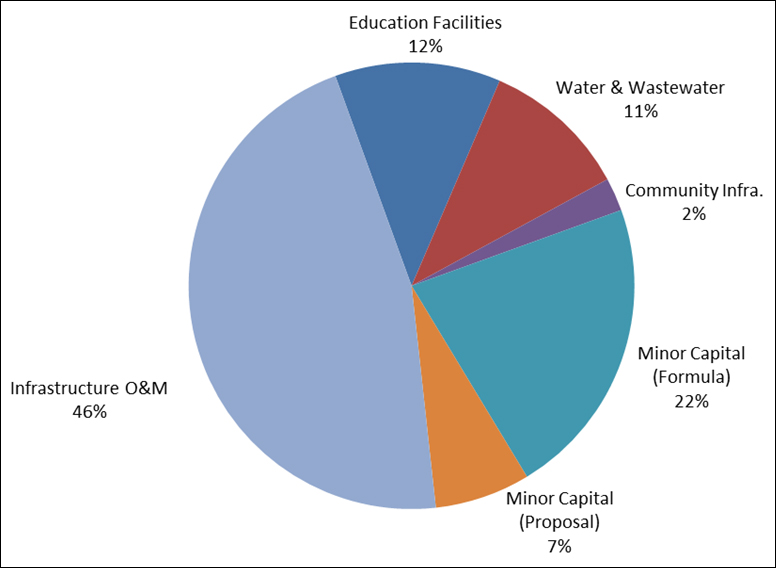
This is a chart showing the Atlantic breakdown of planned spending for Vote 10 in 2015-2016. The chart is a pie chart showing percentage distribution of funding by asset and category. Major capital Education facilities represent 12% of all Vote 10 investments, Major capital Water and Wastewater investments represent 11% of all Vote 10 investments, Major capital Community Infrastructure represent 2% of all Vote 10 investments, Minor capital formula-driven, 22%, Minor capital proposal-driven, 7% and Infrastructure O&M, 46%.
Atlantic Regional Snapshot:
| First Nation Infrastructure Capital Projects proposed in 2015-2016 (includes proposal-based projects only) | 20 |
|---|---|
| First Nation Infrastructure Capital projects proposed in the five year plan (includes proposal-based projects only) | 25 |
| Total Infrastructure Investment 2015-2016 | $41,558,189 |
| First Nation Population | 23,460 |
| Infrastructure Investment per Capita | $1,771 |
Atlantic Summary
| Project Category | Previous Year (Planned Amount in 2014–2015) |
Planned Spending | ||||
|---|---|---|---|---|---|---|
| 2015–2016 | 2016–2017 | 2017–2018 | 2018–2019 | 2019–2020 | ||
| Proposal Based Capital Projects | ||||||
| Community Infrastructure | 10,890,100 | 1,144,958 | - | - | - | - |
| Contaminated Sites | - | - | - | - | - | - |
| Education | 5,164,400 | 5,406,400 | 10,000,000 | - | - | - |
| Housing | - | - | - | - | - | - |
| Water and Wastewater | 7,351,095 | 6,735,863 | - | - | - | - |
| Sub-Total (Proposal) | $23,405,595 | $13,287,221 | $10,000,000 | $- | $- | $- |
| Formula Driven Capital | ||||||
| Community Infrastructure | 906,018 | 2,804,813 | 2,305,166 | 2,319,566 | 2,284,966 | 2,284,966 |
| Contaminated Sites | - | - | - | - | - | - |
| Education | - | 8,264 | 8,264 | 8,264 | 8,264 | 8,264 |
| Housing | 8,154,164 | 5,746,411 | 5,763,969 | 5,863,969 | 5,863,969 | 5,819,322 |
| Water and Wastewater | - | 516,813 | 300,770 | 296,670 | 294,170 | 294,170 |
| Sub-Total (Formula) | $9,060,182 | $9,076,301 | $8,378,169 | $8,488,469 | $8,451,369 | $8,406,722 |
| Operations & Maintenance | ||||||
| Community Infrastructure | 9,675,705 | 12,725,194 | 11,741,414 | 11,750,260 | 11,759,213 | 6,676,980 |
| Contaminated Sites | - | - | - | - | - | - |
| Education | 2,819,473 | 1,826,570 | 1,567,630 | 1,567,630 | 1,567,630 | 1,567,630 |
| Housing | - | 166,799 | 166,799 | 166,799 | 166,799 | 111,576 |
| Water and Wastewater | 5,838,260 | 4,476,104 | 2,496,615 | 2,496,615 | 2,496,615 | 785,793 |
| Sub-Total (O&M) | $18,333,438 | $19,194,667 | $15,972,458 | $15,981,304 | $15,990,257 | $9,141,979 |
| Grand Total | ||||||
| Community Infrastructure | 21,471,824 | 16,674,965 | 14,046,580 | 14,069,826 | 14,044,179 | 8,961,946 |
| Contaminated Sites | - | - | - | - | - | - |
| Education | 7,983,873 | 7,241,234 | 11,575,894 | 1,575,894 | 1,575,894 | 1,575,894 |
| Housing | 8,154,164 | 5,913,210 | 5,930,768 | 6,030,768 | 6,030,768 | 5,930,898 |
| Water and Wastewater | 13,189,355 | 11,728,780 | 2,797,385 | 2,793,285 | 2,790,785 | 1,079,963 |
| Grand Total | $50,799,215 | $41,558,189 | $34,350,627 | $24,469,773 | $24,441,626 | $17,548,701 |
| The dashes above indicate that planned funding in this category has yet to be determined. Funding levels may only be known just prior to the commencement of the fiscal year in question. *Community Infrastructure category includes various asset classes such as Roads & Bridges, Electrification, Connectivity, Solid Waste, Fuel Tanks, and others. |
||||||
Quebec Region
Breakdown of planned spending 2015-2016: (Vote 10 Only)
| A. Major Capital (Proposal) | % of Total Proposed Funding | |
|---|---|---|
Education Facilities |
$5,000,000 | 31% |
Water and Wastewater |
$10,485,357 | |
Contaminated Sites |
$0 | |
Community Infrastructure |
$0 | |
Sub-total A |
$15,485,357 | |
| B. Minor Capital (Proposal) | $9,292,391 | |
| Total Proposal Funding (A+B) | $24,777,748 | |
| C. Minor Capital (Formula) | $22,440,917 | 69% |
| D. Operations & Maintenance (Formula) | $31,928,987 | |
| Total Formula Funding (C+D) | $54,369,904 | |
| Grand Total | $79,147,652 | |
Expand for text description of this chart
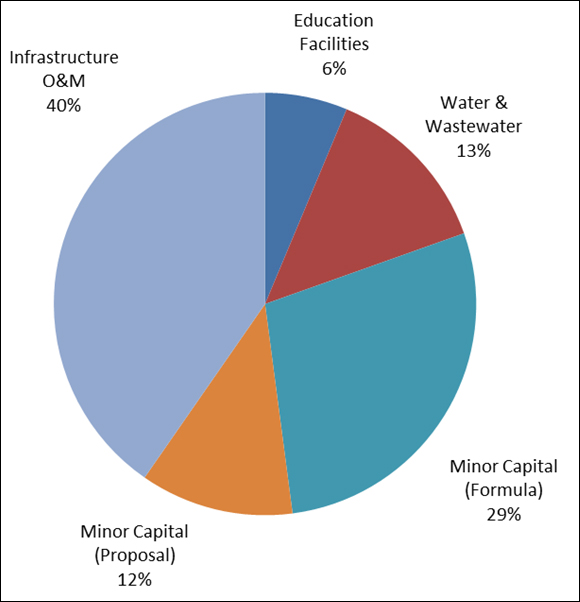
This is a chart showing the Quebec breakdown of planned spending for Vote 10 in 2015-2016. The chart is a pie chart showing percentage distribution of funding by asset and category. Major capital Education facilities represent 6% of all Vote 10 investments, Major capital Water and sewer, 13%, Minor capital formula-driven, 29%, Minor capital proposal-driven, 12% and Infrastructure O&M, 40%.
Quebec Regional Snapshot:
| First Nation Infrastructure Capital Projects proposed in 2015-2016 (includes proposal-based projects only) | 39 |
|---|---|
| First Nation Infrastructure Capital projects proposed in the five year plan (includes proposal-based projects only) | 60 |
| Total Infrastructure Investment 2015-2016 | $79,147,652 |
| First Nation Population | 55,847 |
| Infrastructure Investment per Capita | $1,417 |
Quebec Summary
| Project Category | Previous Year (Planned Amount in 2014–2015) |
Planned Spending | ||||
|---|---|---|---|---|---|---|
| 2015–2016 | 2016–2017 | 2017–2018 | 2018–2019 | 2019–2020 | ||
| Proposal Based Capital Projects | ||||||
| Community Infrastructure | 3,610,406 | 3,546,677 | 4,155,772 | 3,816,255 | 4,410,864 | 1,200,000 |
| Contaminated Sites | - | - | - | - | - | - |
| Education | 3,431,372 | 5,240,000 | 4,113,000 | 200,000 | - | - |
| Housing | - | 750,000 | 750,000 | 750,000 | - | - |
| Water and Wastewater | 11,808,740 | 15,241,071 | 209,312 | 219,778 | 230,765 | 233,842 |
| Sub-Total (Proposal) | $18,850,518 | $24,777,748 | $9,228,084 | $4,986,033 | $4,641,629 | $1,433,842 |
| Formula Driven Capital | ||||||
| Community Infrastructure | 11,932,328 | 22,440,917 | 22,681,389 | 22,681,389 | 22,681,389 | 22,681,389 |
| Contaminated Sites | - | - | - | - | - | - |
| Education | 450,257 | - | - | - | - | - |
| Housing | 7,251,361 | - | - | - | - | - |
| Water and Wastewater | 2,834,636 | - | - | - | - | - |
| Sub-Total (Formula) | $22,468,583 | $22,440,917 | $22,681,389 | $22,681,389 | $22,681,389 | $22,681,389 |
| Operations & Maintenance | ||||||
| Community Infrastructure | 12,023,321 | 11,928,993 | 11,782,277 | 11,782,277 | 11,782,277 | 11,782,277 |
| Contaminated Sites | 400,000 | 3,654 | - | - | - | - |
| Education | 10,531,010 | 10,662,220 | 10,662,220 | 10,662,220 | 10,662,220 | 10,662,220 |
| Housing | 645,911 | 743,307 | 683,087 | 683,087 | 683,087 | 683,087 |
| Water and Wastewater | 7,226,006 | 8,590,813 | 6,065,813 | 6,065,813 | 6,065,813 | 6,065,813 |
| Sub-Total (O&M) | $30,826,248 | $31,928,987 | $29,193,397 | $29,193,397 | $29,193,397 | $29,193,397 |
| Grand Total | ||||||
| Community Infrastructure | 27,566,055 | 37,916,587 | 38,619,438 | 38,279,921 | 38,874,530 | 35,663,666 |
| Contaminated Sites | 400,000 | 3,654 | - | - | - | - |
| Education | 14,412,639 | 15,902,220 | 14,775,220 | 10,862,220 | 10,662,220 | 10,662,220 |
| Housing | 7,897,272 | 1,493,307 | 1,433,087 | 1,433,087 | 683,087 | 683,087 |
| Water and Wastewater | 21,869,382 | 23,831,884 | 6,275,125 | 6,285,591 | 6,296,578 | 6,299,655 |
| Grand Total | $72,145,349 | $79,147,652 | $61,102,870 | $56,860,819 | $56,516,415 | $53,308,628 |
| The dashes above indicate that planned funding in this category has yet to be determined. Funding levels may only be known just prior to the commencement of the fiscal year in question. *Community Infrastructure category includes various asset classes such as Roads & Bridges, Electrification, Connectivity, Solid Waste, Fuel Tanks, and others. |
||||||
Ontario Region
Breakdown of planned spending 2015-2016: (Vote 10 Only)
| A. Major Capital (Proposal) | % of Total Proposed Funding | |
|---|---|---|
Education Facilities |
$41,626,486 | 42% |
Water and Wastewater |
$44,207,611 | |
Contaminated Sites |
$943,710 | |
Community Infrastructure |
$13,834,911 | |
Sub-total A |
$100,248,718 | |
| B. Minor Capital (Proposal) | $10,337,880 | |
| Total Proposal Funding (A+B) | $110,586,598 | |
| C. Minor Capital (Formula) | $47,418,056 | 58% |
| D. Operations & Maintenance (Formula) | $104,644,486 | |
| Total Formula Funding (C+D) | $152,062,542 | |
| Grand Total | $262,649,140 | |

Expand for text description of this chart
This is a chart showing the Ontario breakdown of planned spending for Vote 10 in 2015-2016. The chart is a pie chart showing percentage distribution of funding by asset and category. Major capital Education facilities represent 15.7% of all Vote 10 investments, Major capital Water and sewer, 16.8%, Major capital Contaminated sites, 0.4%, Major capital Community infrastructure, 5.3%, Minor capital formula-driven, 18.1%, Minor capital proposal-driven, 3.9% and Infrastructure O&M, 39.8%.
Ontario Regional Snapshot:
| First Nation Infrastructure Capital Projects proposed in 2015-2016 (includes proposal-based projects only) | 66 |
|---|---|
| First Nation Infrastructure Capital projects proposed in the five year plan (includes proposal-based projects only) | 67 |
| Total Infrastructure Investment 2015-2016 | $262,649,140 |
| First Nation Population | 94,312 |
| Infrastructure Investment per Capita | $2,785 |
Ontario Summary
| Project Category | Previous Year (Planned Amount in 2014–2015) |
Planned Spending | ||||
|---|---|---|---|---|---|---|
| 2015–2016 | 2016–2017 | 2017–2018 | 2018–2019 | 2019–2020 | ||
| Proposal Based Capital Projects | ||||||
| Community Infrastructure | 40,550,797 | 20,525,582 | 12,789,257 | 193,570 | 279,656 | 359,429 |
| Contaminated Sites | 1,943,023 | 1,841,710 | 656,659 | - | - | - |
| Education | 49,712,674 | 41,612,486 | 17,281,113 | 946,311 | - | - |
| Housing | 5,075,000 | 1,340,727 | - | - | - | - |
| Water and Wastewater | 34,950,501 | 45,266,093 | 23,927,436 | 7,039,318 | - | - |
| Sub-Total (Proposal) | $132,231,995 | $110,586,598 | $54,654,465 | $8,179,199 | $279,656 | $359,429 |
| Formula Driven Capital | ||||||
| Community Infrastructure | 23,496,174 | 23,183,305 | 23,183,305 | 23,183,305 | 23,183,305 | 23,183,305 |
| Contaminated Sites | - | - | - | - | - | - |
| Education | 1,991,954 | 1,916,517 | 1,916,517 | 1,916,517 | 1,916,517 | 1,916,517 |
| Housing | 22,531,915 | 22,318,234 | 22,318,234 | 22,318,234 | 22,318,234 | 22,318,234 |
| Water and Wastewater | - | - | - | - | - | - |
| Sub-Total (Formula) | $48,020,043 | $47,418,056 | $47,418,056 | $47,418,056 | $47,418,056 | $47,418,056 |
| Operations & Maintenance | ||||||
| Community Infrastructure | 39,568,318 | 37,290,688 | 37,220,688 | 37,220,688 | 37,220,688 | 37,220,688 |
| Contaminated Sites | - | - | - | - | - | - |
| Education | 35,736,940 | 35,669,354 | 35,669,354 | 35,669,354 | 35,669,354 | 35,669,354 |
| Housing | 6,951,334 | - | - | - | - | - |
| Water and Wastewater | 41,251,600 | 31,684,444 | 22,058,034 | 22,058,034 | 22,058,034 | 22,058,034 |
| Sub-Total (O&M) | $123,508,192 | $104,644,486 | $94,948,076 | $94,948,076 | $94,948,076 | $94,948,076 |
| Grand Total | ||||||
| Community Infrastructure | 103,615,289 | 80,999,575 | 73,193,250 | 60,597,563 | 60,683,649 | 60,763,422 |
| Contaminated Sites | 1,943,023 | 1,841,710 | 656,659 | - | - | - |
| Education | 87,441,568 | 79,198,357 | 54,866,984 | 38,532,182 | 37,585,871 | 37,585,871 |
| Housing | 34,558,249 | 23,658,961 | 22,318,234 | 22,318,234 | 22,318,234 | 22,318,234 |
| Water and Wastewater | 76,202,101 | 76,950,537 | 45,985,470 | 29,097,352 | 22,058,034 | 22,058,034 |
| Grand Total | $303,760,230 | $262,649,140 | $197,020,597 | $150,545,331 | $142,645,788 | $142,725,561 |
| The dashes above indicate that planned funding in this category has yet to be determined. Funding levels may only be known just prior to the commencement of the fiscal year in question. *Community Infrastructure category includes various asset classes such as Roads & Bridges, Electrification, Connectivity, Solid Waste, Fuel Tanks, and others. |
||||||
Manitoba Region
Breakdown of planned spending 2015-2016: (Vote 10 Only)
| A. Major Capital (Proposal) | % of Total Proposed Funding | |
|---|---|---|
| Education Facilities | $6,798,200 | 57% |
Water and Wastewater |
$58,247,761 | |
Contaminated Sites |
$7,535,000 | |
Community Infrastructure |
$65,967,651 | |
Sub-total A |
$138,548,612 | |
| B. Minor Capital (Proposal) | $15,963,326 | |
| Total Proposal Funding (A+B) | $154,511,938 | |
| C. Minor Capital (Formula) | $52,235,062 | 43% |
| D. Operations & Maintenance (Formula) | $66,534,184 | |
| Total Formula Funding (C+D) | $118,769,246 | |
| Grand Total | $273,281,184 | |

Expand for text description of this chart
This is a chart showing the Manitoba breakdown of planned spending for Vote 10 in 2015-2016. The chart is a pie chart showing percentage distribution of funding by asset and category. Major capital Education facilities represent 3% of all Vote 10 investments, Major capital Water and sewer, 21%, Major capital Contaminated sites, 3%, Major capital Community infrastructure, 24%, Minor capital formula-driven, 19%, Minor capital proposal-driven, 6% and Infrastructure O&M, 24%.
Manitoba Regional Snapshot:
| First Nation Infrastructure Capital Projects proposed in 2015-2016 (includes proposal-based projects only) | 86 |
|---|---|
| First Nation Infrastructure Capital projects proposed in the five year plan (includes proposal-based projects only) | 107 |
| Total Infrastructure Investment 2015-2016 | $273,281,184 |
| First Nation Population | 89,705 |
| Infrastructure Investment per Capita | $3,046 |
Manitoba Summary
| Project Category | Previous Year (Planned Amount in 2014–2015) |
Planned Spending | ||||
|---|---|---|---|---|---|---|
| 2015–2016 | 2016–2017 | 2017–2018 | 2018–2019 | 2019–2020 | ||
| Proposal Based Capital Projects | ||||||
| Community Infrastructure | 53,165,898 | 48,705,621 | 21,383,086 | 10,808,566 | 11,073,292 | 5,251,300 |
| Contaminated Sites | 5,523,500 | 9,262,500 | - | - | - | - |
| Education | 12,429,900 | 8,560,000 | 95,281,450 | 64,092,600 | - | - |
| Housing | 18,987,734 | 29,711,796 | 20,075,000 | 15,860,000 | - | - |
| Water and Wastewater | 53,825,717 | 58,272,021 | 16,493,448 | - | - | - |
| Sub-Total (Proposal) | $143,932,749 | $154,511,938 | $153,232,984 | $90,761,166 | $11,073,292 | $5,251,300 |
| Formula Driven Capital | ||||||
| Community Infrastructure | 33,616,559 | 33,160,246 | 34,003,262 | 34,814,758 | 34,282,667 | 33,841,180 |
| Contaminated Sites | - | - | - | - | - | - |
| Education | 1,514,386 | 1,145,436 | 1,065,336 | 1,076,336 | 1,410,536 | 1,370,536 |
| Housing | 9,831,203 | 10,516,308 | 12,847,075 | 11,759,356 | 12,166,197 | 12,537,149 |
| Water and Wastewater | 6,636,453 | 7,413,072 | 4,295,389 | 4,584,612 | 4,375,662 | 4,486,197 |
| Sub-Total (Formula) | $51,598,601 | $52,235,062 | $52,211,062 | $52,235,062 | $52,235,062 | $52,235,062 |
| Operations & Maintenance | ||||||
| Community Infrastructure | 18,221,910 | 19,213,656 | 18,513,656 | 18,513,656 | 18,513,656 | 18,513,656 |
| Contaminated Sites | - | - | - | - | - | - |
| Education | 18,795,267 | 19,312,015 | 19,213,151 | 19,213,151 | 19,213,151 | 19,213,151 |
| Housing | - | 300,000 | - | - | - | - |
| Water and Wastewater | 27,027,545 | 27,708,513 | 21,073,822 | 21,073,822 | 21,073,822 | 21,073,822 |
| Sub-Total (O&M) | $64,044,722 | $66,534,184 | $58,800,629 | $58,800,629 | $58,800,629 | $58,800,629 |
| Grand Total | ||||||
| Community Infrastructure | 105,004,367 | 101,079,523 | 73,900,004 | 64,136,980 | 63,869,615 | 57,606,136 |
| Contaminated Sites | 5,523,500 | 9,262,500 | - | - | - | - |
| Education | 32,739,553 | 29,017,451 | 115,559,937 | 84,382,087 | 20,623,687 | 20,583,687 |
| Housing | 28,818,937 | 40,528,104 | 32,922,075 | 27,619,356 | 12,166,197 | 12,537,149 |
| Water and Wastewater | 87,489,715 | 93,393,606 | 41,862,659 | 25,658,434 | 25,449,484 | 25,560,019 |
| Grand Total | $259,576,072 | $273,281,184 | $264,244,675 | $201,796,857 | $122,108,983 | $116,286,991 |
| The dashes above indicate that planned funding in this category has yet to be determined. Funding levels may only be known just prior to the commencement of the fiscal year in question. *Community Infrastructure category includes various asset classes such as Roads & Bridges, Electrification, Connectivity, Solid Waste, Fuel Tanks, and others. |
||||||
Saskatchwewan Region
Breakdown of planned spending 2015-2016: (Vote 10 Only)
| A. Major Capital (Proposal) | % of Total Proposed Funding | |
|---|---|---|
Education Facilities |
$7,923,865 | 42% |
Water and Wastewater |
$32,336,889 | |
Contaminated Sites |
$0 | |
Community Infrastructure |
$5,237,700 | |
Sub-total A |
$45,498,454 | |
| B. Minor Capital (Proposal) | $17,053,227 | |
| Total Proposal Funding (A+B) | $62,551,681 | |
| C. Minor Capital (Formula) | $29,047,955 | 58% |
| D. Operations & Maintenance (Formula) | $57,443,722 | |
| Total Formula Funding (C+D) | $86,491,677 | |
| Grand Total | $149,043,358 | |

Expand for text description of this chart
This is a chart showing the Saskatchewan breakdown of planned spending for Vote 10 in 2015-2016. The chart is a pie chart showing percentage distribution of funding by asset and category. Major capital Education facilities represent 5% of all Vote 10 investments, Major capital Water and sewer, 22%, Major capital Community infrastructure, 4%, Minor capital formula-driven, 19%, Minor capital proposal-driven, 11% and Infrastructure O&M, 39%.
Saskatchewan Regional Snapshot:
| First Nation Infrastructure Capital Projects proposed in 2015-2016 (includes proposal-based projects only) | 87 |
|---|---|
| First Nation Infrastructure Capital projects proposed in the five year plan (includes proposal-based projects only) | 127 |
| Total Infrastructure Investment 2015-2016 | $149,043,358 |
| First Nation Population | 72,199 |
| Infrastructure Investment per Capita | $2,064 |
Saskatchewan Summary
| Project Category | Previous Year (Planned Amount in 2014–2015) |
Planned Spending | ||||
|---|---|---|---|---|---|---|
| 2015–2016 | 2016–2017 | 2017–2018 | 2018–2019 | 2019–2020 | ||
| Proposal Based Capital Projects | ||||||
| Community Infrastructure | 12,755,426 | 7,051,659 | 2,714,000 | 204,999 | - | - |
| Contaminated Sites | - | - | - | - | - | - |
| Education | 12,959,401 | 13,984,133 | 1,565,000 | 612,000 | - | - |
| Housing | 37,200 | - | - | - | - | - |
| Water and Wastewater | 28,760,800 | 41,515,889 | 3,939,000 | 6,811,500 | 12,934,000 | 17,535,000 |
| Sub-Total (Proposal) | $54,512,827 | $62,551,681 | $8,218,000 | $7,628,499 | $12,934,000 | $17,535,000 |
| Formula Driven Capital | ||||||
| Community Infrastructure | 4,843,534 | 4,843,534 | 4,843,534 | 4,843,534 | 4,843,534 | 4,843,534 |
| Contaminated Sites | - | - | - | - | - | - |
| Education | 878,132 | 878,132 | 878,132 | 878,132 | 878,132 | 878,132 |
| Housing | 23,326,289 | 23,326,289 | 23,326,289 | 23,326,289 | 23,326,289 | 23,326,289 |
| Water and Wastewater | - | - | - | - | - | - |
| Sub-Total (Formula) | $29,047,955 | $29,047,955 | $29,047,955 | $29,047,955 | $29,047,955 | $29,047,955 |
| Operations & Maintenance | ||||||
| Community Infrastructure | 20,977,448 | 20,977,448 | 20,977,448 | 20,977,448 | 20,977,448 | 20,977,448 |
| Contaminated Sites | - | - | - | - | - | - |
| Education | 21,411,205 | 21,411,205 | 21,411,205 | 21,411,205 | 21,411,205 | 21,411,205 |
| Housing | 1,095,661 | 1,095,661 | 1,095,661 | 1,095,661 | 1,095,661 | 1,095,661 |
| Water and Wastewater | 13,836,558 | 13,959,408 | 10,157,658 | 10,157,658 | 10,157,658 | 10,157,658 |
| Sub-Total (O&M) | $57,320,872 | $57,443,722 | $53,641,972 | $53,641,972 | $53,641,972 | $53,641,972 |
| Grand Total | ||||||
| Community Infrastructure | 38,576,408 | 32,872,641 | 28,534,982 | 26,025,981 | 25,820,982 | 25,820,982 |
| Contaminated Sites | - | - | - | - | - | - |
| Education | 35,248,738 | 36,273,470 | 23,854,337 | 22,901,337 | 22,289,337 | 22,289,337 |
| Housing | 24,459,150 | 24,421,950 | 24,421,950 | 24,421,950 | 24,421,950 | 24,421,950 |
| Water and Wastewater | 42,597,358 | 55,475,297 | 14,096,658 | 16,969,158 | 23,091,658 | 27,692,658 |
| Grand Total | $140,881,654 | $149,043,358 | $90,907,927 | $90,318,426 | $95,623,927 | $100,224,927 |
| The dashes above indicate that planned funding in this category has yet to be determined. Funding levels may only be known just prior to the commencement of the fiscal year in question. *Community Infrastructure category includes various asset classes such as Roads & Bridges, Electrification, Connectivity, Solid Waste, Fuel Tanks, and others. |
||||||
Alberta Region
Breakdown of planned spending 2015-2016: (Vote 10 Only)
| A. Major Capital (Proposal) | % of Total Proposed Funding | |
|---|---|---|
Education Facilities |
$8,400,000 | 34% |
Water and Wastewater |
$7,747,992 | |
Contaminated Sites |
$0 | |
Community Infrastructure |
$4,215,356 | |
Sub-total A |
$20,363,348 | |
| B. Minor Capital (Proposal) | $27,485,520 | |
| Total Proposal Funding (A+B) | $47,848,868 | |
| C. Minor Capital (Formula) | $27,628,948 | 66% |
| D. Operations & Maintenance (Formula) | $65,505,095 | |
| Total Formula Funding (C+D) | $93,134,043 | |
| Grand Total | $140,982,911 | |
Expand for text description of this chart
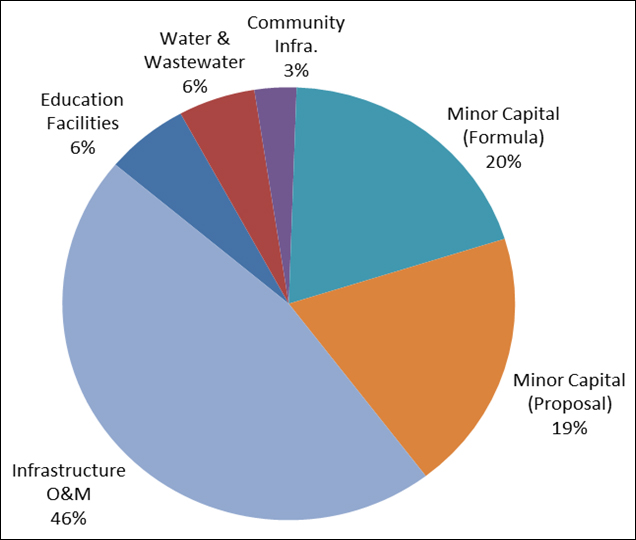
This is a chart showing the Alberta breakdown of planned spending for Vote 10 in 2015-2016. The chart is a pie chart showing percentage distribution of funding by asset and category. Major capital Education facilities represent 6% of all Vote 10 investments, Major capital Water and sewer, 6%, Major capital Community infrastructure, 3%, Minor capital formula-driven, 20%, Minor capital proposal-driven, 19% and Infrastructure O&M, 46%.
Alberta Regional Snapshot:
| First Nation Infrastructure Capital Projects proposed in 2015-2016 (includes proposal-based projects only) | 95 |
|---|---|
| First Nation Infrastructure Capital projects proposed in the five year plan (includes proposal-based projects only) | 99 |
| Total Infrastructure Investment 2015-2016 | $140,982,911 |
| First Nation Population | 73,684 |
| Infrastructure Investment per Capita | $1,913 |
Alberta Summary
| Project Category | Previous Year (Planned Amount in 2014–2015) |
Planned Spending | ||||
|---|---|---|---|---|---|---|
| 2015–2016 | 2016–2017 | 2017–2018 | 2018–2019 | 2019–2020 | ||
| Proposal Based Capital Projects | ||||||
| Community Infrastructure | 7,351,875 | 6,991,356 | 1,400,000 | - | - | - |
| Contaminated Sites | - | - | - | - | - | - |
| Education | 11,233,125 | 17,999,000 | 17,202,000 | 9,289,465 | - | - |
| Housing | 250,000 | - | - | - | - | - |
| Water and Wastewater | 12,966,358 | 22,858,512 | - | - | - | - |
| Sub-Total (Proposal) | $31,801,358 | $47,848,868 | $18,602,000 | $9,289,465 | $- | $- |
| Formula Driven Capital | ||||||
| Community Infrastructure | 20,392,108 | 9,505,943 | 9,505,943 | 9,505,943 | 9,505,943 | 9,505,943 |
| Contaminated Sites | - | - | - | - | - | - |
| Education | 7,145,358 | 895,447 | 895,447 | 895,447 | 895,447 | 895,447 |
| Housing | 17,180,567 | 17,227,558 | 17,227,558 | 17,227,558 | 17,227,558 | 17,227,558 |
| Water and Wastewater | 6,581,039 | - | - | - | - | - |
| Sub-Total (Formula) | $51,299,072 | $27,628,948 | $27,628,948 | $27,628,948 | $27,628,948 | $27,628,948 |
| Operations & Maintenance | ||||||
| Community Infrastructure | 33,150,904 | 28,408,552 | 28,408,552 | 28,408,552 | 28,408,552 | 28,408,552 |
| Contaminated Sites | - | - | - | - | - | - |
| Education | 12,788,267 | 19,753,906 | 19,753,906 | 19,753,906 | 19,753,906 | 19,753,906 |
| Housing | - | - | - | - | - | - |
| Water and Wastewater | 5,621,744 | 17,342,637 | 14,047,504 | 14,047,504 | 14,047,504 | 14,047,504 |
| Sub-Total (O&M) | $51,560,915 | $65,505,095 | $62,209,962 | $62,209,962 | $62,209,962 | $62,209,962 |
| Grand Total | ||||||
| Community Infrastructure | 60,894,887 | 44,905,851 | 39,314,495 | 37,914,495 | 37,914,495 | 37,914,495 |
| Contaminated Sites | - | - | - | - | - | - |
| Education | 31,166,750 | 38,648,353 | 37,851,353 | 29,938,818 | 20,649,353 | 20,649,353 |
| Housing | 17,430,567 | 17,227,558 | 17,227,558 | 17,227,558 | 17,227,558 | 17,227,558 |
| Water and Wastewater | 25,169,141 | 40,201,149 | 14,047,504 | 14,047,504 | 14,047,504 | 14,047,504 |
| Grand Total | $134,661,345 | $140,982,911 | $108,440,910 | $99,128,375 | $89,838,910 | $89,838,910 |
| The dashes above indicate that planned funding in this category has yet to be determined. Funding levels may only be known just prior to the commencement of the fiscal year in question. *Community Infrastructure category includes various asset classes such as Roads & Bridges, Electrification, Connectivity, Solid Waste, Fuel Tanks, and others. |
||||||
British Columbia Region
Breakdown of planned spending 2015-2016: (Vote 10 Only)
| A. Major Capital (Proposal) | % of Total Proposed Funding | |
|---|---|---|
Education Facilities |
$18,099,857 | 58% |
Water and Wastewater |
$28,450,875 | |
Contaminated Sites |
$1,767,500 | |
Community Infrastructure |
$2,889,989 | |
Sub-total A |
$51,208,221 | |
| B. Minor Capital (Proposal) | $48,338,557 | |
| Total Proposal Funding (A+B) | $99,546,778 | |
| C. Minor Capital (Formula) | $13,515,257 | 42% |
| D. Operations & Maintenance (Formula) | $58,057,473 | |
| Total Formula Funding (C+D) | $71,572,473 | |
| Grand Total | $171,119,508 | |
Expand for text description of this chart
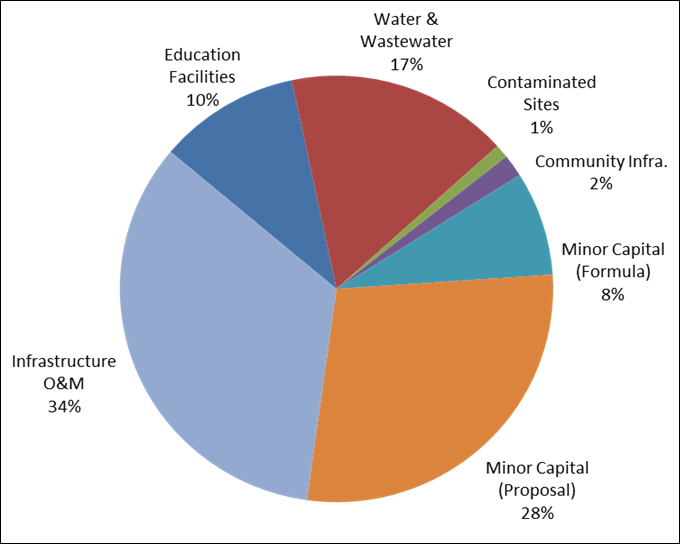
This is a chart showing the British Columbia breakdown of planned spending for Vote 10 in 2015-2016. The chart is a pie chart showing percentage distribution of funding by asset and category. Major capital Education facilities represent 10% of all Vote 10 investments, Major capital Water and sewer, 17%, Major capital Contaminated sites, 1%, Major capital Community infrastructure, 2%, Minor capital formula-driven, 8%, Minor capital proposal-driven, 28% and Infrastructure O&M, 34%.
British Columbia Regional Snapshot:
| First Nation Infrastructure Capital Projects proposed in 2015-2016 (includes proposal-based projects only) | 254 |
|---|---|
| First Nation Infrastructure Capital projects proposed in the five year plan (includes proposal-based projects only) | 544 |
| Total Infrastructure Investment 2015-2016 | $171,119,508 |
| First Nation Population | 62,481 |
| Infrastructure Investment per Capita | $2,739 |
British Columbia Summary
| Project Category | Previous Year (Planned Amount in 2014–2015) |
Planned Spending | ||||
|---|---|---|---|---|---|---|
| 2015–2016 | 2016–2017 | 2017–2018 | 2018–2019 | 2019–2020 | ||
| Proposal Based Capital Projects | ||||||
| Community Infrastructure | 11,417,073 | 21,046,751 | 18,230,000 | 10,038,515 | 19,826,647 | 14,845,000 |
| Contaminated Sites | 2,198,200 | 2,891,200 | 8,928,060 | 14,739,737 | 8,707,628 | 5,650,344 |
| Education | 28,293,259 | 20,169,857 | 18,529,899 | 17,760,000 | 11,300,000 | 10,500,000 |
| Housing | 14,479,032 | 14,250,000 | 14,000,000 | 13,500,000 | 11,800,000 | 10,500,000 |
| Water and Wastewater | 37,282,216 | 41,188,970 | 37,093,129 | 28,563,525 | 33,587,656 | 39,485,509 |
| Sub-Total (Proposal) | $93,669,780 | $99,546,778 | $96,781,088 | $84,601,777 | $85,221,931 | $80,980,853 |
| Formula Driven Capital | ||||||
| Community Infrastructure | 11,885,456 | 8,109,155 | 8,271,327 | 8,436,743 | 8,605,465 | 8,777,565 |
| Contaminated Sites | - | - | - | - | - | - |
| Education | 3,032,599 | - | - | - | - | - |
| Housing | 5,317,014 | 5,406,102 | 5,514,214 | 5,624,489 | 5,624,489 | 5,851,700 |
| Water and Wastewater | - | - | - | - | - | - |
| Sub-Total (Formula) | $20,235,069 | $13,515,257 | $13,785,541 | $14,061,232 | $14,342,435 | $14,629,265 |
| Operations & Maintenance | ||||||
| Community Infrastructure | 22,028,926 | 28,677,342 | 22,449,774 | 22,898,419 | 23,356,022 | 23,822,781 |
| Contaminated Sites | - | - | - | - | - | - |
| Education | 492,014 | 3,583,462 | 3,655,116 | 3,728,201 | 3,802,747 | 3,878,786 |
| Housing | 206,000 | 220,000 | - | - | - | - |
| Water and Wastewater | 28,559,945 | 25,576,669 | 13,440,118 | 13,708,834 | 13,982,925 | 14,262,503 |
| Sub-Total (O&M) | $51,286,885 | $58,057,473 | $39,545,008 | $40,335,454 | $41,141,694 | $41,964,070 |
| Grand Total | ||||||
| Community Infrastructure | 45,331,455 | 57,833,248 | 48,951,101 | 41,373,677 | 51,788,134 | 47,445,346 |
| Contaminated Sites | 2,198,200 | 2,891,200 | 8,928,060 | 14,739,737 | 8,707,628 | 5,650,344 |
| Education | 31,817,872 | 23,753,319 | 22,185,015 | 21,488,201 | 15,102,747 | 14,378,786 |
| Housing | 20,002,046 | 19,876,102 | 19,514,214 | 19,124,489 | 17,536,970 | 16,351,700 |
| Water and Wastewater | 65,842,161 | 66,765,639 | 50,533,247 | 42,272,359 | 47,570,581 | 53,748,012 |
| Grand Total | $165,191,734 | $171,119,508 | $150,111,637 | $138,998,463 | $140,706,060 | $137,574,188 |
| The dashes above indicate that planned funding in this category has yet to be determined. Funding levels may only be known just prior to the commencement of the fiscal year in question. *Community Infrastructure category includes various asset classes such as Roads & Bridges, Electrification, Connectivity, Solid Waste, Fuel Tanks, and others. |
||||||
Yukon Region
Breakdown of planned spending 2015-2016: (Vote 10 Only)
| A. Major Capital (Proposal) | % of Total Proposed Funding | |
|---|---|---|
Education Facilities |
$0 | 59% |
Water and Wastewater |
$3,500,000 | |
Contaminated Sites |
$0 | |
Community Infrastructure |
$2,391,000 | |
Sub-total A |
$5,891,000 | |
| B. Minor Capital (Proposal) | $2,136,161 | |
| Total Proposal Funding (A+B) | $8,027,161 | |
| C. Minor Capital (Formula) | $2,780,178 | 41% |
| D. Operations & Maintenance (Formula) | $2,685,247 | |
| Total Formula Funding (C+D) | $5,465,425 | |
| Grand Total | $13,492,586 | |
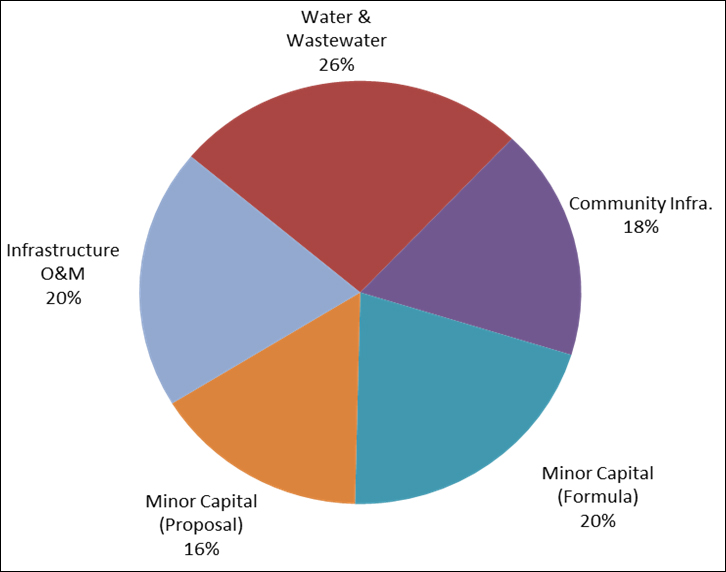
Expand for text description of this chart
This is a chart showing the Yukon breakdown of planned spending for Vote 10 in 2015-2016. The chart is a pie chart showing percentage distribution of funding by asset and category. Major capital Water and sewer represent 26% of all Vote 10 investments, Major capital Community infrastructure, 18%, Minor capital formula-driven, 20%, Minor capital proposal-driven, 16% and Infrastructure O&M, 20%.
Yukon Regional Snapshot:
| First Nation Infrastructure Capital Projects proposed in 2015-2016 (includes proposal-based projects only) | 19 |
|---|---|
| First Nation Infrastructure Capital projects proposed in the five year plan (includes proposal-based projects only) | 33 |
| Total Infrastructure Investment 2015-2016 | $13,492,586 |
| First Nation Population | 3,985 |
| Infrastructure Investment per Capita | $3,386 |
Yukon Summary
| Project Category | Previous Year (Planned Amount in 2014–2015) |
Planned Spending | ||||
|---|---|---|---|---|---|---|
| 2015–2016 | 2016–2017 | 2017–2018 | 2018–2019 | 2019–2020 | ||
| Proposal Based Capital Projects | ||||||
| Community Infrastructure | 507,440 | 2,844,474 | 293,979 | 298,956 | 299,131 | 303,144 |
| Contaminated Sites | - | - | - | - | - | - |
| Education | - | - | - | - | - | - |
| Housing | 200,000 | 220,330 | 220,333 | 220,333 | 220,333 | 220,333 |
| Water and Wastewater | 2,791,525 | 4,962,357 | 948,540 | 948,540 | 948,540 | 868,540 |
| Sub-Total (Proposal) | $3,498,965 | $8,027,161 | $1,462,852 | $1,467,829 | $1,468,004 | $1,392,017 |
| Formula Driven Capital | ||||||
| Community Infrastructure | 928,858 | 891,665 | 814,155 | 827,263 | 691,155 | 776,155 |
| Contaminated Sites | - | - | - | - | - | - |
| Education | - | - | - | - | - | - |
| Housing | 1,752,308 | 1,693,908 | 1,903,418 | 1,919,310 | 2,055,418 | 2,055,418 |
| Water and Wastewater | 191,052 | 194,605 | 160,602 | 131,602 | 136,602 | 131,602 |
| Sub-Total (Formula) | $2,872,218 | $2,780,178 | $2,878,175 | $2,878,175 | $2,883,175 | $2,963,175 |
| Operations & Maintenance | ||||||
| Community Infrastructure | 1,397,008 | 1,606,760 | 1,738,695 | 1,761,269 | 1,804,495 | 1,838,385 |
| Contaminated Sites | - | - | - | - | - | - |
| Education | 4,775 | 30,000 | 30,000 | 30,000 | 30,000 | 30,000 |
| Housing | - | - | - | - | - | - |
| Water and Wastewater | 1,466,293 | 1,048,487 | 997,757 | 1,017,412 | 1,037,460 | 1,057,909 |
| Sub-Total (O&M) | $2,868,076 | $2,685,247 | $2,766,452 | $2,808,681 | $2,871,955 | $2,926,294 |
| Grand Total | ||||||
| Community Infrastructure | 2,833,306 | 5,342,899 | 2,846,829 | 2,887,488 | 2,794,781 | 2,917,684 |
| Contaminated Sites | - | - | - | - | - | - |
| Education | 4,775 | 30,000 | 30,000 | 30,000 | 30,000 | 30,000 |
| Housing | 1,952,308 | 1,914,238 | 2,123,751 | 2,139,643 | 2,275,751 | 2,275,751 |
| Water and Wastewater | 4,448,870 | 6,205,449 | 2,106,899 | 2,097,554 | 2,122,602 | 2,058,051 |
| Grand Total | $9,239,259 | $13,492,586 | $7,107,479 | $7,154,685 | $7,223,134 | $7,281,486 |
| The dashes above indicate that planned funding in this category has yet to be determined. Funding levels may only be known just prior to the commencement of the fiscal year in question. *Community Infrastructure category includes various asset classes such as Roads & Bridges, Electrification, Connectivity, Solid Waste, Fuel Tanks, and others. |
||||||
Appendix B — National Priority Ranking Framework
Background
The Department has a consistent and transparent ranking system to address the most pressing needs in First Nation communities.
The department is committed to the following priorities, listed in order of importance, over the next five years:
- Protecting and maintaining the life cycle of existing assets, with an emphasis on health and safety;
- Mitigating health and safety risks through existing and new assets;
- Addressing the backlog regarding water and sewage systems under Capital and Facilities Maintenance activities; and
- Investing in other priorities, including investments in sustainable communities (e.g., housing, electrification, roads, educational facilities and community buildings) and investments in community assets to resolve claims or self-government agreements.
Development of the Priority Framework
AANDC regional offices employ a ranking system as a normal course of business in developing capital plans, as demand historically exceeds available funding resources. The National Priority Framework was designed to align existing regional processes (at the highest level) with departmental priorities, to enable reporting and to demonstrate progress in a consistent manner.
Use of the Priority Matrix
Regions are requested to:
- Classify all major and minor capital projects to a "best fit" within the matrix areas using definitions in the Project Grid, and
- Enter the priority code (i.e. A-2) in the companion reporting spreadsheets.
In this way the Department rolls-up funding allocations to the national priorities by asset category. The objective is to demonstrate allocation to the highest priorities, however, pending direction from the allocation methodologies study it may be necessary to set funding levels or targets for the priority areas. The Department may also wish to roll-up unfunded projects in each priority area as a way to demonstrate where the needs reside and how they may shift over time.
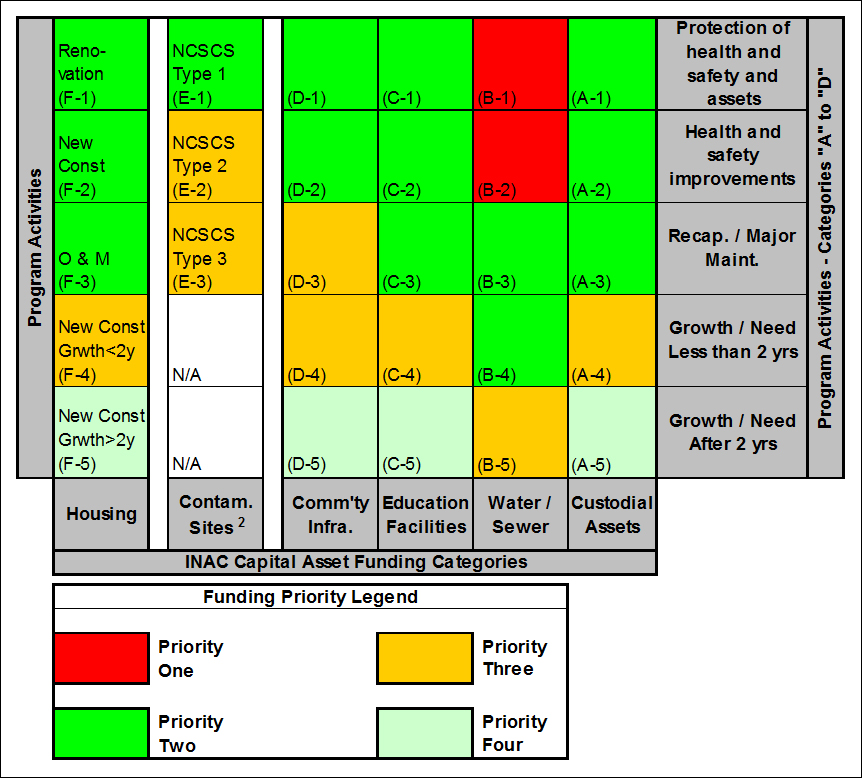
Notes:
- Priority ranking excludes emergency projects that may occur from time to time
- Contaminated Sites refer to holdings south of 60. Refer to Northern Contaminated Sites Work plan for contaminated sites north of 60.
Expand for text description of this Matrix
The image represents the National Priority Funding Evaluation and Measurement Matrix.
There are 6 columns representing the Capital Asset Funding Categories: Housing, Contaminated Sites, Community Infrastructure, Education Facilities, Water/Sewer and Custodial Assets.
The Housing category is divided in 5 program activities: Renovation (F-1), New Construction (F-2), O&M (F-3), New construction growth < 2 years (F-4) and New construction growth > 2 years (F-5).
The Contaminated sites category is divided in 3 program activities: NCSCS Type 1 (E-1), NCSCS Type 2 (E-2), and NCSCS Type 3 (E-3).
The Community Infrastructure category is divided in 5 program activities: Protection of health and safety and assets (D-1), Health and safety improvements (D-2), Recapitalization/Major maintenance (D-3), Growth/Need < 2 years (D-4), and Growth/Need > 2 years (D-5).
The Education Facilities category is divided in 5 program activities: Protection of health and safety and assets (C-1), Health and safety improvements (C-2), Recapitalization/Major maintenance (C-3), Growth/Need < 2 years (C-4), and Growth/Need > 2 years (C-5).
The Water/Sewer category is divided in 5 program activities: Protection of health and safety and assets (B-1), Health and safety improvements (B-2), Recapitalization/Major maintenance (B-3), Growth/Need < 2 years (B-4), and Growth/Need > 2 years (B-5).
The Custodial Assets category is divided in 5 program activities: Protection of health and safety and assets (A-1), Health and safety improvements (A-2), Recapitalization/Major maintenance (A-3), Growth/Need < 2 years (A-4), and Growth/Need > 2 years (A-5).
There are four funding priority category: Priority 1, Priority 2, Priority 3 and Priority 4. Priority 1 includes B-1 and B-2. Priority 2 includes A-1 to A-3, B-3 to B-4, C-1 to C-3, D-1 to D-2, E-1, and F-1 to F-3. Priority 3 includes A-4, B-5, C-4, D-3 to D-4, E-2 to E-3, and F-4. Priority 4 includes A-5, C-5, D-5 and F-5.
Definitions of Program Activities – Categories "A" to "D"
Protection of Health & Safety and Assets
North/South Custodial Assets (A):
Maintenance projects required to protect the asset and would mitigate the identified high-risk health and safety issues.
Water/Sewer (B), Education (C), Community Infrastructure (D):
Assets require upgrading or replacement to meet appropriate standards. Maintenance projects to address significant risk to health and safety: 1) classified as Group 2 Projects resulting from Asset Condition Reporting System inspections; and/or 2) to address high and medium risks as identified in the AANDC May 2003 National Assessment of Water and Wastewater Systems in First Nations Communities. These projects are to be recorded and tracked for completion in the departmental Capital Asset Management System.
Health & Safety Improvements
North/South Custodial Assets (A), Water/Sewer (B), Education (C), Community Infrastructure (D):
Upgrades of existing assets, new construction / acquisition projects to mitigate an identified significant risk to health and safety.
Recapitalization / Major Maintenance
North/South Custodial Assets (A), Water/Sewer (B), Education (C), Community Infrastructure (D):
Projects required to extend the useful operating life of a facility or asset, or to maintain the original service level of the asset.
Growth — Need less than two years
North/South Custodial Assets (A), Water/Sewer (B), Education (C), Community Infrastructure (D):
Anticipated community growth requires new construction / expansion / procurement of assets to maintain the level of service standards within a timeframe of less than two years.
Growth — Need after two years
North/South Custodial Assets (A) Water/Sewer (B), Education (C), Community Infrastructure (D):
Anticipated community growth requires new construction / expansion / procurement of assets to maintain the level of service standards within a timeframe of greater than two years.
Program Activity – Category "E" (Contaminated Sites)
Note: Remediation/risk management includes monitoring
National Contaminated Sites Classification System (NCSCS) Class 1
Assessment, remediation/risk management of all NCSCS Class 1 contaminated sites on a priority basis to avert risk to community health and safety and water sources in accordance with the departmental Contaminated Sites Management policy.
NCSCS Class 2
Assessment, remediation/risk management of all NCSCS Class 2 contaminated sites on a priority basis to avert risk to community health and safety in accordance with the departmental Contaminated Sites Management policy.
NCSCS Class 3
Assessment, remediation/risk management of all NCSCS Class 3 contaminated sites on a cost efficiency basis.
Program Activity – Category "F" (Housing)
Renovation:
Projects required to correct what could be an unsafe condition to the occupants or projects beyond routine maintenance to extend the useful lifespan of the house.
New Construction:
Construction of dwelling units to address the community's housing need.
Operation and Maintenance:
Routine maintenance and activities to preserve the housing portfolio.
AANDC Capital Asset Funding Categories
Custodial Assets: Administration buildings, vehicles, machinery and equipment required to deliver programs to First Nations, Inuit, and Northern communities.
Water / Sewer: Assets that comprise the distribution / collection system and assets required in the treatment and disposal process including major equipment, vehicles, machinery and buildings.
Education Facilities: Schools, staff residences (teacherages), student residences, temporary facilities associated with delivering the educational program in the community.
Community Infrastructure: Assets and systems not already specified above – including operative, administrative, utility and recreational buildings; solid waste vehicles, dumps and transfer stations; community roads and bridges; electrical power supply and distribution; fire-fighting vehicles and supporting buildings; and fuel tanks and distribution systems.
Contaminated Sites: Sites requiring assessment, remediation / risk management to protect the health and safety as well as the environment of communities.
Housing: Funding to assist in community housing services i.e., the construction, maintenance and management of the community housing portfolio.
Project Grid
Note: The following is not an exhaustive list of project activities, but are examples provided to assist in categorizing potential projects.
Custodial Assets
(A-1)
- Major Maintenance of assets to avoid immediate risk to health and safety of staff or public
- Major Maintenance of assets to avoid immediate risk of contamination of environment
(A-2)
- Action required to meet health and safety legislative requirements (Canadian Environmental Protection Act, Canadian Labour Code)
- Imminent risk to health and safety of staff or public
- Imminent risk of contamination of environment
(A-3)
- Major repair to improve / protect integrity of asset or replacement of asset
- Significantly improve asset integrity / utility through repair or replacement
- Improve condition / operating cost of asset through repair or replacement
(A-4) (A-5)
- Maintain program operations which could be seriously hindered due to serious asset defects or unserviceable assets
- Maintain operational efficiency of program operations
- Enhance operations to meet future demands
Water and Wastewater Assets
(B-1)
- Repairs/upgrades/replacements to deal with imminent health and safety risks arising from the community systems as identified in Asset Condition Ranking System inspections and others means (e.g. the National Assessment noted above), including legislative / regulatory requirements and potential violations (i.e. Fisheries Act). Water source protection is included.
- Water unsatisfactory with respect to microbiological or physical/chemical quality based on health considerations noted in "Guidelines for Canadian Drinking Water Quality".
- Wastewater systems posing potential medium to high risks that could negatively impact wastewater effluent quality, including legislative / regulatory requirements and potential violations (i.e. Fishery Act).
(B-2)
- Water system does not provide fire protection capacity (flow & pressure) and there is multiple life loss risk and/or high property value risks
- Water quantity is insufficient to meet residential demand
(B-3)
- Reconstruction / Major repairs required to restore asset
(B-4)
- Water / sewage systems (residential sub-division development including supporting infrastructure)
- Water quality is unsatisfactory based on "aesthetic objectives" as defined in "Guidelines for Canadian Drinking Water Quality"
(B-5)
- Improvements to groundwater system are required to provide a back-up supply for existing houses
- Improvements to existing system are recommended but not mandatory
- Growth needed for water / sewer systems greater than two years
Educational Facilities
(C-1)
- Renovations or improvements to existing facilities are needed to deal with serious operational problems with immediate health and safety risks (i.e. identified in Asset Condition Ranking System inspections)
- Health and safety code violations
(C-2)
- Severe overcrowding requires an expansion to facility
(C-3)
- Reconstruction / replacement of On-Reserve facilities.
- Minor code conformance (infractions)
(C-4) (C-5)
- New facilities on-reserve
Community Infrastructure
(D-1)
Fuel Tank Systems
- Improvements to existing system to meet legislative/regulatory compliance.
Fire safety systems
- Imminent health and safety risks as identified in Asset Condition Ranking System inspections.
- Provision of file protection capabilities critical to safety of the community, either through the use of purchased fire protection services or by acquiring apparatus and fire protection equipment.
Solid waste
- Improvements to existing system are needed to deal with serious operational problems, safety problems and/or system reliability
- Solid waste facility presents an imminent threat to public health or safety, or to the environment
Electrification
- Required to assure integrity of water supply and/or sewage collection and treatment
Transportation
- Bridge/high boardwalk where it is the sole access to reserve - imminent failure if not repaired/replaced
- Serious community access hazards which impair accessibility of community for emergencies
(D-2)
Fire Safety Systems
- Improvements to equipment needed to deal with serious operational problems, safety problems and/or system reliability
Solid waste
- Solid waste facility presents a significant threat to public health or safety, or to the environment
Electrification
- Unsafe facilities causing a threat to the public
Transportation
- Road-hazardous geometric problems
- Bridge/high boardwalk - structural problems
- Bridge/high boardwalk - capacity [size] problems
(D-3)
Fire safety systems
- Reconstruction/replacement
- Major repairs to assets/equipment
Solid waste
- Reconstruction/replacement
- Major repairs to assets/equipment
Electrification
- Reconstruction/replacement
- Major repairs to assets/equipment
Transportation
- Bridge/high boardwalk - reconstruction - reached end of service life
- Road reconstruction - serious structural problems
- Major road repairs to restore asset - significant structure problems
(D-4) (D-5)
Administrative Buildings
- Renovations or improvements to existing facilities / assets are needed to deal with serious operational problems.
Fire safety systems
- Improvements to existing system are recommended but not mandatory
Solid waste
- Improvements to existing system are recommended but not mandatory
Electrification
- Improvements to existing system are recommended but not mandatory
Transportation
- Improvements to existing system are recommended but not mandatory
Contaminated Sites
(E-1)
National Contaminated Sites Classification System Class 1
- Sites with an NCSCS score equal or greater than 70 (i.e.: NCSCS Class 1) where remediation/ risk-management is currently underway and further remediation/risk management is required.
- Sites identified where a Phase I or Phase II environmental site assessments (ESA) is required or where existing sites (Class I – Insufficient evidence) require a follow up to confirm site classification.
- Sites with an NCSCS score equal or greater than 70 (i.e.: NCSCS Class 1) where the Phase II ESA has been completed and remediation/risk management is required but has yet to be initiated.
(E-2)
National Contaminated Sites Classification System Class 2
- Sites with an NCSCS score equal to 50 but less than 70 (i.e.: NCSCS Class 2 sites) where remediation/risk-management is currently underway and further remediation/risk management is required.
- Sites with an NCSCS score equal to 50 but less than 70 (i.e.: NCSCS Class 2) where the Phase II ESA has been completed and remediation/risk management is required but has yet to be initiated.
(E-3)
National Contaminated Sites Classification System Class 3
- Sites with an NCSCS score equal to 37 or less (i.e.: NCSCS Class 3 sites) where a Phase II ESA has been completed, remediation/risk management is required and there are cost efficiencies to include this site in conjunction with other Class 1 or 2 remediation/risk management projects currently underway.
Housing
(F-1)
Renovation
Repairing unsafe conditions could include:
- Unsafe outside steps or stairways in need of replacement;
- Interior structural problems (e.g. falling material from ceilings);
- Defective or unsafe plumbing/electrical wiring/heating;
- Mould contamination
Extending the useful lifespan of the house could include:
- Roof replacement
- Structural and foundation repair
- Energy efficiency improvements (e.g. doors, windows, insulation levels)
- Replacement of furnace/heating unit
(F-2)
New Construction
- Addition to existing dwelling units or construction of new dwelling units to address overcrowding.
(F-3)
Operation & Maintenance
- Routine maintenance to protect housing structure, envelope, interior
- Fire Prevention – e.g. provision and installation of smoke detectors, extinguishers
- Funding for housing authority to review/inspect housing stock, including routine fire safety compliance checks
- Payment of insurance policy premiums
(F-4)
New Construction to address population growth in less than 2 years
- Addition to existing dwelling units or construction of new dwelling units to address population growth.
(F-5)
New Construction to address population growth after 2 years
- Addition to existing dwelling units or construction of new dwelling units to address population growth.
Gossary of Acronyms and Terms
Acronyms
| Acronym | In Full |
|---|---|
| AANDC | Aboriginal Affairs and Northern Development Canada |
| CFMP | Capital Facilities and Maintenance Program |
| EAP | Economic Action Plan |
| FCSAP | Federal Contaminated Sites Action Plan |
| FNIIP | First Nations Infrastructure Investment Plan |
| FNWWAP | First Nations Water and Wastewater Action Plan |
| NCSCS | National Contaminated Sites Classification System |
Terms
| Term | Definition |
|---|---|
| A-Base or Base Budget | A recurring set of funds provided to a department at the onset of each budget period. The base budget is used to keep the department functioning, and is derived from the previous year's spending and adjustments such as inflation. It is not designed to fund special projects. |
| Main Estimates | Provide a breakdown, by department and program, of planned government spending for the upcoming fiscal year. The estimates are expressed as a series of "votes", or resolutions, which summarize the estimated financial requirements in a particular expenditure category, such as operations, capital or grants. |
| Major Capital | Funding allocated for specific proposal-driven construction, acquisition, renovation or significant repair projects valued above $1.5 million. |
| Minor Capital | Can either be formula-based or proposal-driven funding. This funding is typically allocated for on reserve housing and for construction, acquisition, renovation and/or repair projects of community infrastructure valued below $1.5 million. |
| Operations and Maintenance (O&M) | Formula-based funding specifically allocated for the on-going operation and maintenance of community Infrastructure assets as well as First Nation Training. |
| Statutory | These are expenditures provided for on an ongoing basis by way of legislation other than the Appropriation Act and cannot be altered by the House of Commons during its consideration of the Estimates. |
| Supplementary Estimates | Present information to Parliament on the Government of Canada's spending requirements that were not sufficiently developed in time for inclusion in the Main Estimates, and will from time to time include urgent but unforeseen expenditures, such as natural disasters. They are published throughout the year; each release is identified alphabetically (A, B, C, etc.). |
| Targeted Funding | New financial resources provided by the federal government to a department to be spent on specified areas; in most cases, this funding is time limited. |
| Vote | Refers to the amount of funding approved by Parliament through the annual Appropriation Act. This provides government departments or agencies with the authority required to spend money for a specific purpose. Each budgetary item, or vote, has two essential components: an amount of money and a destination (a description of what the money will be used for). |
| Vote 1 | (Operating Budget) Includes expenditures such as: salaries, contracts, staff training, travel, stationery, printing, departmental accommodation, etc. |
| Vote 10 | (Grants and Contributions) also called Transfer Payments, the means by which AANDC funds the operations of First Nations and other recipients. |