National First Nations Infrastructure Investment Plan 2014-2015
As of April 1st, 2014
Table of contents
Introduction
The First Nations Infrastructure Investment Plan (FNIIP) is developed annually by Aboriginal Affairs and Northern Development Canada (AANDC) in partnership with First Nations, to strategically plan investments, in the short and medium term, while supporting a base of infrastructure that protects the health and safety and enables engagement in the economy.
This report explains how the FNIIP is developed and provides details of specific eligible projects for investment and priority investment areas in accordance with the National Priority Ranking Framework. The current FNIIP report provides an overview of investments planned through the Capital Facilities and Maintenance Program (CFMP) for the period 2014-2015 to 2018-2019 and captures planned projects as of April 1, 2014. Recent investment commitments made through Budget 2014 and starting beyond 2014-2015 for disaster mitigation ($40 million over five years) have not been captured in this report but will be included in future reports. Previous FNIIP reports are available on AANDC's website.
The FNIIP is a process that is based on known factors at the time when each of the three linked plansFootnote 1 (community, regional and national) are prepared. The plan takes into account A-Base plus targeted fundingFootnote 2. However, it cannot anticipate unforeseen emergencies, new investment opportunities, or announcements that may arise in the course of the fiscal year. Adjustments to the plan may occur throughout the fiscal year as community, project and financial circumstances change. Therefore not all projects or reference levels identified in the national plan will receive the level of funding identified in a particular year.
Program Overview
The provision of community infrastructure funding to First Nations is based on the Government of Canada's spending power as a matter of social policy. The Capital Facilities and Maintenance Program (CFMP) is part of the Infrastructure and Capacity Strategic Outcome that falls under the broader Strategic Outcome "2014-2015 Report on Plans and Priorities", which promotes full participation of First Nations, Métis, Non-Status Indians and Inuit individuals and communities in the economy.
The mandate of the CFMP is to provide financial and advisory assistance to First Nations in the development of basic public infrastructure which is essential for healthy, safe and sustainable communities. This assistance is provided to First Nations on reserves, as well as First Nations and other eligible recipientsFootnote 3 on Crown land or recognized Indian land.
The objective of the CFMP is to provide financial support to First Nations and other eligible recipients to:
- invest in physical assets (or services) that mitigate health and safety risks in their communities;
- ensure that assets meet established codes and standards;
- ensure that assets are managed in a cost-effective and efficient manner that protects, maintains and maximizes asset life cycle; and
- ensure that the above activities are undertaken in an environmentally sound and sustainable manner.
The CFMP is intended to assist First Nations in the planning, construction and/or acquisition, as well as operation and maintenance of community infrastructure and facilities including the following asset categories:
- Water supply, storage, treatment and distribution;
- Wastewater collection, treatment and disposal;
- Solid Waste collection and disposal;
- Elementary and secondary educational facilities;
- Housing;
- Roads and bridges;
- Fire protection including fire halls, fire trucks and firefighting equipment;
- Electrical power generation and distribution;
- Community buildings such as community/recreation halls and band offices;
- Bulk fuel storage and distribution (non-commercial use);
- Flood and erosion protection;
- Remediation of contaminated sites;
- Land acquisition for approved community expansion; and
- Connectivity.
Priority Action Areas
Capital projects are subject to the Department's National Priority Ranking Framework (NPRF). Regional offices use the NPRF to inform the development of their Regional First Nation Infrastructure Investments Plans (Regional FNIIP). The NPRF provides the foundation for consistent and transparent ranking of infrastructure investments. The Framework's priorities are defined by the following Program Activity Categories:
- Protection of health and safety as well as assets (assets require upgrading or replacement to meet appropriate standards);
- Health and safety improvements (upgrades of existing assets, new construction/acquisition projects to mitigate an identified significant risk to health and safety);
- Recapitalization/major maintenance (extend the useful operating life of a facility or asset, or maintain the original service level of the asset); and
- Growth (anticipated community growth requiring new construction, expansion or procurement of assets to maintain the level of service standards).
In addition to the NPRF, additional internal ranking tools have been developed by the department to further prioritize project proposals that fall within the same capital asset categories and priority level established by the NPRF. The Priority Ranking Framework for Water and Wastewater Projects, the School Priority Ranking Framework (SPRF) and the Fuel Tank System Priority Ranking Framework are all points-based ranking tools that take into consideration multiple criteria. Weighted factors are then automatically applied to each criterion, to ensure that factors of highest priority (such as health and safety) maximally influence the overall ranking score.
These ranking tools complement the existing NPRF by helping regional decision makers refine their ranking of proposed projects in a fair and consistent manner to ensure that projects are funded on the basis of highest priority.
Life Cycle Approach – AANDC Funded Community Infrastructure
AANDC promotes a life cycle approach for infrastructure assets starting with the use of full life-cycle costing when approving capital construction projects. This type of analysis allows for the consideration of all the associated costs (e.g. for design, construction, operation and maintenance, insurance, and major renovations) of the proposed infrastructure throughout its entire life cycle. This information is used to make comparisons between proposed options (e.g. building an expensive installation with low operating and maintenance costs versus a less-expensive facility with higher operating and maintenance costs) to determine the most cost-effective option in the short, medium, and long term. This exercise is also useful in determining the funding levels required from the First Nation in future years for the operation and maintenance of the proposed infrastructure.
During an asset's service life, AANDC provides funding support to First Nations to help pay for the operation and maintenance costs of funded infrastructure assets. AANDC also encourages good asset management practices by recommending that First Nations implement Maintenance Management Plans for major capital assets. To help First Nations achieve longer term use of existing assets, AANDC funds inspections of some community assets such as schools, water and wastewater systems. Currently water and wastewater systems are inspected annuallyFootnote 4 while schools and other asset classes are inspected on a three year cycle as a minimum.
As part of its efforts to encourage good asset management, AANDC funds an on-site training and mentoring program for water and wastewater system operators in First Nation communities called the Circuit Rider Training Program (CRTP). This program has helped improve the capacity levels of the water and wastewater systems operators and the operation of systems, as well as helping First Nations benefit from the full service life of these assets.
CFMP Resource Allocation Process
AANDC allocates funding for the construction and the maintenance of community infrastructure to First Nations at regional level through formula, proposal based project funding or as a combination of both. The CFMP budget is divided into:
Formula-based funding, which includes:
- Operations and Maintenance (O&M)Footnote 5: for the operation and maintenance of existing community infrastructure assets. The level of funding provided to the First Nation varies from 20 per cent to 100 per cent depending on the type of asset.
- Minor CapitalFootnote 6: for housing and for acquisition, construction, renovation, or repair projects valued below $1.5 million.
Proposal-based funding, which includes:
- Minor Capital: for housing and for acquisition, construction, renovation, or repair projects valued below $1.5 million.
- Major Capital: for specific construction, acquisition, renovation, or significant repair projects valued above $1.5 million.
Major capital projects are funded primarily by targeted initiatives such as: funding announced by the Government of Canada for education facilities as part of the Economic Action Plan 2012 (EAP), the continuation of the First Nation Infrastructure Fund announced in EAP 2013, and the extension of the First Nations Water and Wastewater Action Plan announced in EAP 2014.
First Nation Infrastructure Investment Planning Process
Under the Management Control Framework (MCF) for the CFMP, AANDC uses FNIIPs for capital planning. This process aims to improve resource management and increase accountability through better capital planning. An effective process depends on:
- nationally consistent planning practices, using a standardized Regional FNIIP template;
- using the best-available information to create plans and then to update them to reflect the current situation;
- submission of community plans to their respective regions, followed by submission of regional plans to HQ, as per established timelines; and
- plans that are balanced to community and regional allocations.
The FNIIP planning process reflects the existing approval authorities and roles and responsibilities set out in the MCF and is designed around three linked plans that feed into one another:
- a community level plan, detailing infrastructure needs;
- a regional plan, planning out program expenditures; and
- a national plan, that provides a strategic overview of First Nations infrastructure needs and CFMP investments.
First Nations Infrastructure Investment Plans – Community Level
FNIIPs are five-year capital investment plans created by each First Nation community which detail infrastructure needs and plans. As set out in the The Reporting Guide, an updated FNIIP must be prepared each year before capital funds are released to First Nations. It is developed by communities with the support of the AANDC Regional Offices and then submitted for validation and incorporation into the Regional FNIIP.
It is AANDC's goal to ensure that every community develops their own five-year infrastructure plan based on an asset life-cycle approach. Where First Nations do not have the expertise or the capacity to develop their own community level five-year plan, AANDC officials at the regional level will assist communities with the identification of their infrastructure priorities and the development of infrastructure plans. AANDC is continuously working with First Nations to increase their capacity in this area.
First Nation Infrastructure Investment Plans – Regional Level
Regional FNIIPs are the key planning and reporting tools used by both regions and headquarters throughout the year. They are developed after validating proposed expenditures in First Nations Infrastructure Investment Plans against program criteria, and then planning the allocation of available resources to the highest priorities. The plans present regional data and analysis of investments per community per asset category over a five-year period. Regional offices also provide mid-year updates of their plan for use at the regional and national level.
Regional FNIIP projects are prioritized using the National Priority Ranking Framework and other complementary asset-specific ranking tools (e.g. education facilities, water and wastewater, etc.). Higher priority projects are placed in the earlier years of the plan, while lower priority projects are placed in the later years, or beyond the current five-year plan. This, as well as the uncertainty with regard to the renewal of targeted funds, explains why some regions do not have planned investments for all categories, especially major capital projects, beyond the current fiscal year (see Appendix A).
First Nation Infrastructure Investment Plan – National Level
The National FNIIP is a compilation of all eight Regional FNIIPs. It identifies investments per region per asset category, and presents national data and analysis of CFMP capital planning. The National FNIIP is reviewed annually by the departmental Operations Committee made up of AANDC senior management and is published on the departmental website.
National Balance Sheet (2014–2015)
| A. 2014-2015 Estimated Operating Budget (All Votes) | $1,160,687,268 |
|---|---|
| B. Supplementary Estimates (All Votes) | |
| First Nation Water and Wastewater Action Plan (FNWWAP) | $138,000,000 |
| First Nation Infrastructure Fund - Building Canada Fund (BCF) | $15,000,000 |
| Sub Total B | $153,000,000 |
| C. Non-CFMP Activity Incl. in Main Estimates (All Votes) | |
| Emergency Management Assistance | $21,232,388 |
| Forest Fire Suppression | $16,536,000 |
| Climate Change & Energy Sustainability | $3,889,031 |
| Sub Total C | $41,657,419 |
| D. Revised Overall CFMP Budget All Votes (A+B-C) | $1,272,029,849 |
| E. 2014-2015 CFMP Planned Investments | |
| Total FNIIP (Planned Vote 10) | $1,136,254,858 |
| Centrally Managed Funds (BCF) | $15,000,000 |
| Salaries and O&M (Vote 1) | $25,361,868 |
| Statutory (Employee Benefit Plan & Other Operating/Capital Costs) | $3,655,009 |
| Sub Total E | $1,180,271,735 |
| Variance (D-E) | $91,758,114 |
The purpose of the 2014-2015 National Balance Sheet is to provide a detailed comparison between funds that are earmarked within the Main and Supplementary Estimates for the Capital Facilities and Maintenance Program (CFMP) and what is being planned for in the First Nation Infrastructure Investment Plan.
The CFMP falls under the Infrastructure and Capacity Strategic Outcome, which include resources being targeted for programs that are outside of the delivery of the CFMP: Emergency Management, Forest Fire Suppression and Climate Change & Energy Efficiency. Once the non-CFMP items are removed, Main Estimates combine with the Supplementary Estimates provide the overall available CFMP budget for a given fiscal year.
As a result of the 2014-2015 FNIIP being developed in advance of the current fiscal year, there are typically a number of items that AANDC regions have difficulty planning for on account of uncertainty surrounding approval of new initiatives and/or unknown reference levels. Therefore, the total FNIIP (Planned Vote 10) includes planned funding for the First Nation Water and Wastewater Action Plan (FNWWAP) announced as part of Budget 2014, but it does not include the Building Canada Fund (BCF) portion of the First Nation Infrastructure Fund (FNIF) program that was announced as part of Budget 2013. BCF is being centrally managed and was not allocated to AANDC regions at the time the plan was created.
The variance represents the difference between the Overall CFMP Budget and the Planned Investments for the CFMP. This difference typically represents the reallocation of funding out of the CFMP to primarily cover potential shortfalls in core program areas such as Education and Social. This reallocation occurs at the regional level once budgets are transferred from Headquarters to Regions. The Actual reallocation amount out of the CFMP could be higher than the approximate $92 million identified in the National Balance Sheet as the Total FNIIP (Planned Vote 10) includes approximately an additional 10% of over-programming of major capital projects (based on total project costs) to account for both delays to projects outside of AANDC's control and/or additional funds becoming available later in the fiscal year. The actual reallocation amount can be verified when Public Accounts are finalized for the 2014-2015 fiscal year.
National Breakdown of Planned Spending
| Major Capital (Proposal) | |
|---|---|
| Education Facilities | $113,488,764 |
| Water & Sewer | $157,570,590 |
| Contaminated Sites | $8,907,611 |
| Community Infrastructure | $125,165,359 |
| Minor Capital (Formula)Footnote 7 | $234,601,723 |
| Minor Capital (Proposal) | $96,771,463 |
| Infrastructure O&M | $399,749,348 |
| Total | $1,136,254,858 |
National Breakdown of Planned Spending for Vote 10 in 2014-2015

Text description of National Breakdown of Planned Spending for Vote 10 in 2014-2015
This is a chart showing the national breakdown of planned spending for Vote 10 in 2014-2015. The chart is a pie chart showing percentage distribution of funding by asset and category. Major capital Education facilities represent 10% of all Vote 10 investments, Major capital Water and sewer, 14 %, Major capital Contaminated sites, 1%, Major capital Community infrastructure, 11%, Minor capital formula-driven (incl. housing), 21%, Minor capital proposal-driven, 8% and Infrastructure O&M, 35%.
| First Nation Infrastructure Capital Projects Funded this Fiscal (includes major and minor projects) | 627 |
|---|---|
| First Nation Infrastructure Capital Projects funded in the five year plan (includes major and minor projects) | 865 |
| Planned Spending (Current Year) | $501,903,787 |
| Planned Spending (Five Year Aggregate) | $1,351,537,373 |
| Total Infrastructure Investment 2014-2015 | $1,136,254,858 |
| First Nation Population (Statistics Canada, 2011 National Household Survey) | 468,764 |
| Infrastructure Investment per Capita | $2,424 |
2014-2015 Distribution of Proposal-Driven Projects by AANDC Region
(Excluding Formula-Driven Funding)
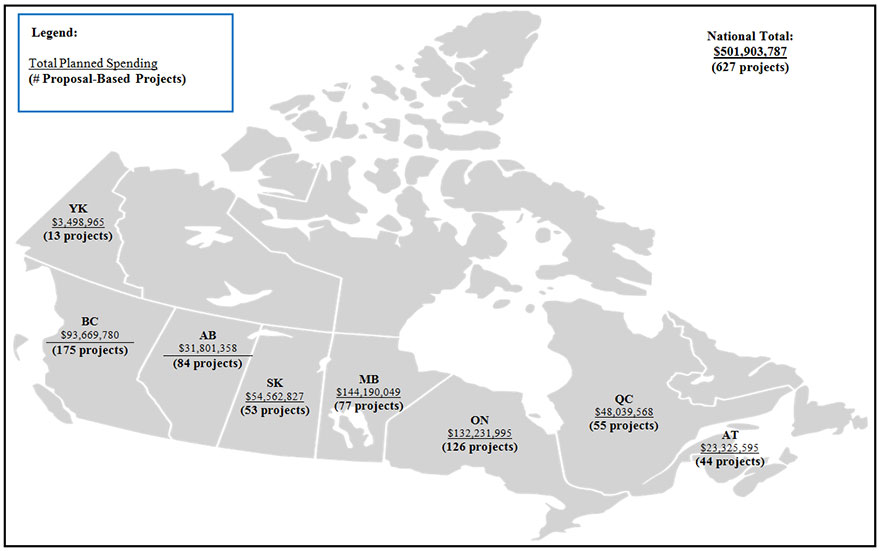
Text description of 2014-2015 Distribution of Proposal-Driven Projects by AANDC Region
(Excluding Formula-Driven Funding)
This graphic illustrates AANDC distribution of proposal projects per Region for the 2014-2015 period. The regions are shown over their respective locations on a map of Canada. The regions shown geographically are: Yukon, British Columbia, Alberta, Saskatchewan, Manitoba, Ontario, Quebec and Atlantic.
For each region total amount of 2014-2015 proposal funding is given as well as total number of proposal-based projects planned for 2014-2015.
- Yukon has total planned spending of $3,498,965 and 13 proposal-based projects in 2014-2015.
- British Columbia has total planned spending of $93,669,780 and 175 proposal-based projects in 2014-2015.
- Alberta has total planned spending of $31,801,358 and 84 proposal-based projects in 2014-2015.
- Saskatchewan has a total planned spending of $54,562,827 and 53 proposal-based projects in 2014-2015.
- Manitoba has a total planned spending of $144,190,049 and 77 proposal-based projects in 2014-2015.
- Ontario has a total planned spending of $132,231,995 and 126 proposal-based projects in 2014-2015.
- Quebec has a total planned spending of $48,039,568 and 55 proposal-based projects in 2014-2015.
- Atlantic has a total planed spending of $23,325,595 and 44 proposal-based projects in 2014-2015.
- Nationally, there is a total of $501,903,787 of planned proposal project spending and 627 proposal-based projects in 2014-2015.
Graph 1: 2014-2015 to 2018-2019 Planned Funding by Funding Stream (All Regions)
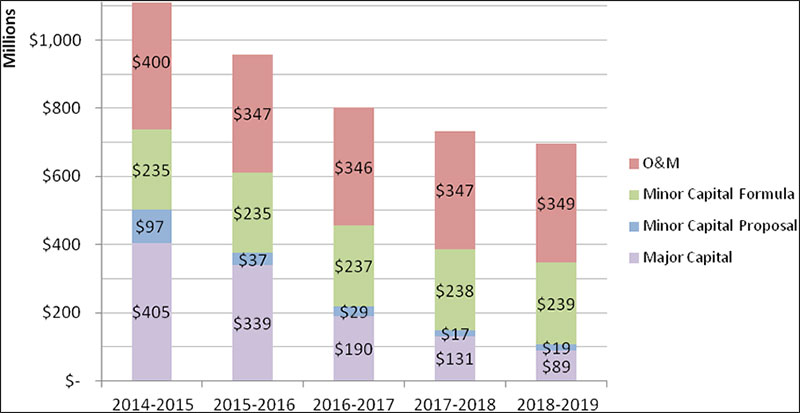
Text description of Graph 1: 2014-2015 to 2018-2019 Planned Funding by Funding Stream (All Regions)
A chart showing the Planned Funding by Major Capital, Minor Capital Proposal, Minor Capital Formula and O&M for the period between 2014-2015 and 2018-2019 at the national level. The chart is a stacked bar-chart showing funding distribution by funding type.
- In 2014-15, Infrastructure O&M represents $400M, Minor Capital – formula-driven, $235M, Minor Capital - proposal-driven, $97M, and Major Capital, $405M for a total of $1,136B.
- In 2015-16, Infrastructure O&M represents $347M, Minor Capital – formula-driven, $235M, Minor Capital - proposal-driven, $37M, and Major Capital, $339M for a total of $958M.
- In 2016-17, Infrastructure O&M represents $346M, Minor Capital – formula-driven, $237M, Minor Capital - proposal-driven, $29M, and Major Capital, $190M for a total of $802M.
- In 2017-18, Infrastructure O&M represents $347M, Minor Capital – formula-driven, $238M, Minor Capital - proposal-driven, $17M, and Major Capital, $131M for a total of $733M.
- In 2018-19, Infrastructure O&M represents $349M, Minor Capital – formula-driven, $239M, Minor Capital - proposal-driven, $19M, and Major Capital, $89M for a total of $696M.
Trends by Funding Type
Graph 1 illustrates the breakdown of planned spending (vote 10) by funding stream for the current fiscal year as well as a four-year projection. In 2014-2015, Major Capital funding represents the largest area of investment with approximately 37% of the total planned funding. Close behind is the planned funding for Operation and Maintenance at 36% and finally, Minor Capital Formula at 18% and Minor Capital Proposal at 9% of the total planned funding amount for 2014-2015. For a comparison of overall planned funding with last year's plan, please refer to the 2013-2014 FNIIP.
Despite Major Capital funding being the largest area of investment for the 2014-2015 fiscal year, it is planned to experience a significant decline over the five years outlined in the current plan from 37% of the overall planned budget to a low of 15% in the final year of the plan. A similar trend can be observed within the Minor Capital Proposal-Driven funding stream, which sees 9% of the overall planned budget in the initial year drop to 3% in the final year of the plan. This decline is partly attributed to the continued investment in the construction of new facilities, and in the major renovation and/or additions of existing facilities which increases the need for funding to operate and maintain these assets. This is slowly reducing the amount of capital funding that is available for major and minor capital proposal-based projects. Also, the expiration of certain targeted funding initiatives detailed in the next section is further enhancing this downward trend.
Operation and Maintenance and Minor Capital Formula funding levels remain fairly constant over the course of the five year plan. This is a result of both Minor Capital Formula and O&M reference levels being established by way of formula and provided directly to First Nations.
Graph 2: 2014-2015 to 2018-2019 Planned Funding by Funding Source (All Regions)
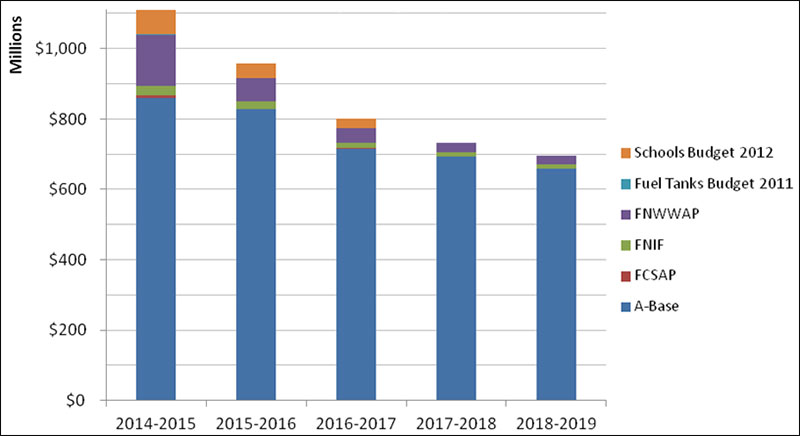
Note: This table does not include the $155 million over 10 years announced from Budget 2013 from the new Building Canada Fund, to be delivered through AANDC's First Nation Infrastructure Fund. These funds are centrally managed and have not been allocated to regions when this plan was prepared on April 1, 2014.
Text description of Graph 2: 2014-2015 to 2018-2019 Planned Funding by Funding Source (All Regions)
This is a chart showing the Planned Funding by funding source for the period between 2014-2015 and 2018-2019 at the national level. The chart is a stacked bar-chart showing funding distribution by funding source.
- In 2014-15, A-Base represents $861M, Federal Contaminated Site Action Plan $6M, First Nation Infrastructure Fund $26M, First Nations Water and Wastewater Action Plan) $145M, Budget 2012 (Schools) $95M, and Budget 2011 (Fuel Tanks) $2M, for a total of $1,136B.
- In 2015-16, A-Base represents $827M, Federal Contaminated Site Action Plan $1M, First Nation Infrastructure Fund $21M, First Nations Water & Wastewater Action Plan) $67M, and Budget 2012 (Schools) $40M, for a total of $958M.
- In 2016-17, A-Base represents $716M, Federal Contaminated Sites Action Plan $1M, First Nation Infrastructure Fund $15M, First Nations Water & Wastewater Action Plan) $43M and Budget 2012 (Schools) $27M, for a total of $802M.
- In 2017-18, A-Base represents $693M, Federal Contaminated Site Action Plan $85,000, First Nation Infrastructure Fund $12M and First Nations Water & Wastewater Action Plan) $27M, for a total of $733M.
- In 2018-19, A-Base represents $658M, Federal Contaminated Site Action Plan $170,000, First Nation Infrastructure Fund $12M and First Nations Water & Wastewater Action Plan) $26M, for a total of $696M.
Trends by Funding Source
The decrease in planned capital funding levels in 2015-2016 and onwards, as illustrated by Graph 2, can be attributed to the expiration of certain targeted funding over the five years of the current FNIIP, with no confirmed renewal opportunities at this point in time. There is also a slight decline in total planned funding levels when comparing 2014-2015 A-Base funding levels to future years. This is due to a number of factors including over programming of current year projects and the practice of developing infrastructure investment plans that emphasize the alignment between projects and current fiscal year resources only, as well as the shifting of projects to future fiscal years when resource availability has been exhausted.
Through the Economic Action Plan (EAP) 2012, commitments of $175 million are being allocated over three years (2012-2015) in new education facilities projects, remediation of existing education facilities, and in support of innovative and cost-efficient education facilities projects. These funds will help sustain progress made to date in providing First Nation children and youth with better learning environments.
To help First Nations ensure that the fuel tanks that power their essential community services, such as water and wastewater treatment systems, schools and community buildings, meet Environment Canada's regulations, $45 million over 4 years (2011-2015) was approved in the 2011 Federal Budget. In addition, AANDC committed $34.5 million over 5 years (2011-2016) from the Capital Facilities and Maintenance Program for a total investment of $79.5 million.
The First Nations Water and Wastewater Action Plan (FNWWAP) was introduced in 2008, and extended in 2010 and 2012. EAP 2014 provided an additional $323.4 million, including $276 million for AANDC and $47.4 million for Health Canada, over two years (2014-2016) for water and wastewater treatment in First Nation communities. This will help sustain progress made to date in the construction and renovation, and the operation and maintenance of water and wastewater assets, training and mentoring of on-reserve operators and related public health activities.
In EAP 2013, the Government of Canada announced $155 million over 10 years from the new Building Canada Fund (BCF) in addition to $139 million over five years from the Gas Tax Fund (GTF) to be delivered to First Nations through AANDC's First Nation Infrastructure Fund (FNIF) starting in 2014-2015. GTF is a permanent funding which is re-calculated every five years based upon First Nation population. FNIF focuses on five priority areas: improving First Nations energy systems (linking to power grids, sustainable energy systems), broadband connectivity, solid waste management (including landfills and recycling), road and bridge projects, and community planning and/or skills development projects that will support long-term sustainable community development of First Nation communities.
The Federal Contaminated Sites Action Plan (FCSAP), a cost-shared program that supports federal departments, agencies and consolidated Crown corporations in addressing contaminated sites for which they are responsible, is now in its second phase (2011-2016). The focus of Phase II is on remediating the highest-priority sites, to reduce their environmental and human health risks, and their associated financial liabilities. While contaminated sites on reserve lands are managed under AANDC's Contaminated Sites Management Program (CSMP), the Capital Facilities and Maintenance Program (CFMP) can be used to fund contaminated site projects.
It is important to note that amounts included in Graph 2 for targeted funding do not necessarily align with what was announced as these amounts represent planned investments. Graph 2 also shows targeted investments beyond their planned expiration year. This can be explained by the fact that projects started under a targeted initiative and being partly funded with departmental A-Base in later years can still be attributed to the targeted funds until its completion.
Planned Funding in 2014-2015 - Proposal-Driven Capital ProjectsFootnote 9 Only
Graph 3: National Funding by Asset Class
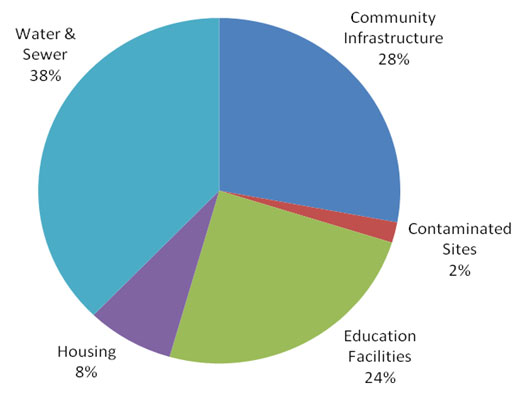
Expand for text description of this graph
This is a chart showing the national breakdown of planned spending for Major and Minor Proposal-Driven Capital Projects in 2014-2015. The chart is a pie chart showing percentage distribution of funding by asset class. Water and Sewer represent 38%, Education facilities, 24%, Community Infrastructure 28%, Housing 8% and Contaminated Sites, 2%.
Graph 3 demonstrates the spread of proposal funding by asset category. Proportionately, the percentage share of proposal projects is very similar to the 2013-2014 Plan. As was the case in 2013-2014, Water & Sewer is the most represented asset category at 38%, followed by Community Infrastructure (including projects such as roads & bridges, fuel tanks and fire protection) at 28%, and then Education with 24% of total proposal funding. These categories form the major portion of proposal projects because of targeted funding initiatives and the way by which priority level is assigned to projects. Housing and Contaminated Sites represent a smaller portion of proposal projects, at 8% and 2% respectively.
Graph 4: National Funding by Asset Class
Expand for text description of this graph
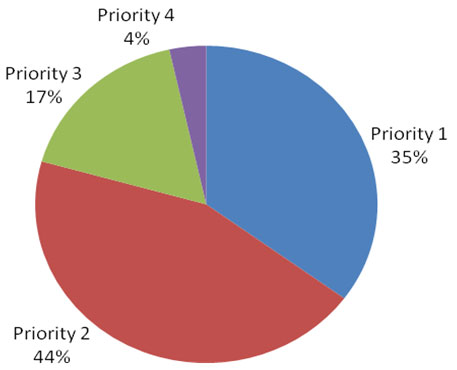
This is a chart showing the national breakdown of planned spending for Major and Minor Proposal-based projects in 2014-2015. The chart is a pie chart showing percentage distribution of funding by priority ranking. Priority 1 represents 35%, Priority 2, 44%, Priority 3, 17%, and Priority 4, 4%.
Graph 4 illustrates that Priority 1 represents 35% of all planned projects being funded this year. These projects, as per the, only pertain to water and wastewater projects and can either be upgrades to existing systems or new construction to deal with imminent health and safety risks, water or wastewater quality, or legislative/regulatory requirements. Priority 2 represents the largest portion of all planned projects at 44%. Unlike Priority 1, Priority 2 projects include all asset classes and cover all program activity categories. Included in this category are targeted initiatives such as funding to assist First Nations in addressing Environment Canada's Fuel Tank Regulations. Priority 3 projects represent a total of 17% and Priority 4, 4%. These priorities focus on anticipated population growth. The investments required to effectively address Priority 1 and 2 projects limit the number of projects that can be funded in the Priority 3 and 4 categories within the existing CFMP envelope.
Infrastructure Capital – Investment Opportunities
For the purpose of the FNIIP, an investment opportunity is defined as a project that meets program criteria, which may or may not have previously received funding, but is not scheduled to receive funding within the time period covered by the current plan (2014-2015 to 2018-2019). The 2014-2015 FNIIP identified 2,105 capital projects valued at approximately $4.8 billion that regions have recorded in their FNIIPs as investment opportunities. These investment opportunities can be further broken down by asset class and National Priority Ranking.
Graph 5: Capital Funding Requests by Asset Class
Expand for text description of this graph
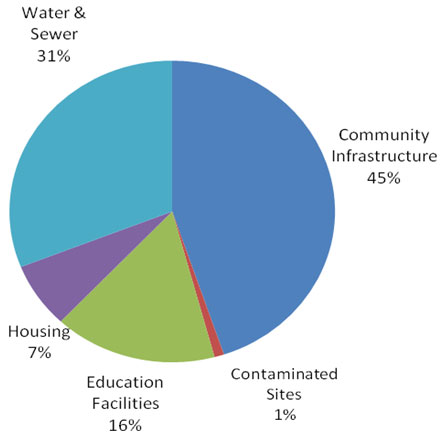
This is a chart showing the national breakdown of investment opportunities for capital. The chart is a pie chart showing percentage distribution of funding requests by asset class. Water and sewer represents 31%, Community infrastructure, 45%, Education facilities 16%, Contaminated Sites, 1%, and Housing, 7%.
Graph 5 demonstrates the need by major asset category as identified in the five-year plan. The highest demand for infrastructure projects is in the asset category of Community Infrastructure at 45%, Water & Sewer projects have been identified as the second asset category most in demand at 31%, followed by Education projects at 16%, Housing at 7% and Contaminated Sites at 1%.
Graph 6: Capital Funding Requests by Priority Ranking
Expand for text description of this graph
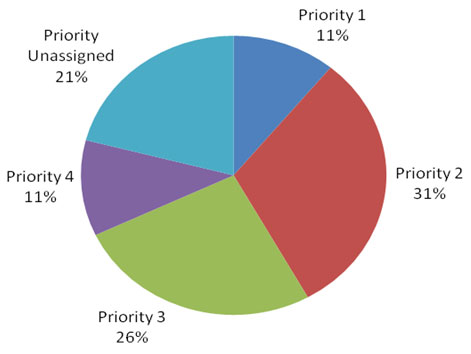
This is a chart showing the national breakdown of investment opportunities for capital. The chart is a pie chart showing percentage distribution of funding requests by priority ranking. Priority 1 represents 11%, Priority 2, 31%, Priority 3, 26%, Priority 4, 11%, and Unassigned, 21%.
Graph 6 illustrates that Priority 1 projects represent 11% of the total future investment opportunities as identified by regions. Priority 1 projects can either be repairs/upgrades or new construction of water or wastewater facilities to deal with imminent health and safety risks, water quality and legislative/regulatory requirements. Priority 2 projects represent 31% of all unfunded projects. For Priority 2, projects include all asset categories and cover almost all program activity categories, except for Growth/Need greater than 2 years, which explains its large percentage. Priority 3 and 4 projects represent a combined total of 37% of investment opportunities. These priorities focus on anticipated population growth. As Priorities 1 and 2 represents a total of 42%, the likelihood of Priority 3 and 4 projects receiving funding is limited.
2014-2015 Planned Acquisition and Construction of Facilities (Proposal & Formula-Based Capital Projects and Operations & Maintenance)
| Project Category | Previous Year (Planned Amount) |
Planned Spending | ||||
|---|---|---|---|---|---|---|
| 2014-2015 | 2015-2016 | 2016-2017 | 2017-2018 | 2018-2019 | ||
| The dashes above indicate that planned funding in this category has yet to be determined. Funding levels may only be known just prior to the commencement of the fiscal year in question. *Community Infrastructure category includes various asset classes such as Roads & Bridges, Electrification, Connectivity, Solid Waste, Fuel Tanks, and others. |
||||||
| Proposal Based Capital Projects | ||||||
| Community Infrastructure | 70,541,983 | 140,249,015 | 67,643,654 | 39,252,943 | 18,038,027 | 22,852,316 |
| Contaminated Sites | 22,095,763 | 9,664,723 | 10,406,315 | 2,434,044 | 175,500 | 1,364,925 |
| Education Facilities | 88,394,073 | 123,224,131 | 73,327,318 | 50,487,516 | 20,879,084 | 12,150,757 |
| Housing | 40,775,728 | 39,028,966 | 51,305,000 | 28,302,517 | 10,700,000 | 10,700,000 |
| Water and Sewer | 177,849,339 | 189,736,952 | 172,816,828 | 98,410,053 | 97,796,516 | 60,590,273 |
| Sub-Total (Proposal) | $399,656,886 | $501,903,787 | $375,499,115 | $218,887,073 | $147,589,127 | $107,658,271 |
| Formula Based Capital | ||||||
| Community Infrastructure | 84,882,637 | 118,537,290 | 117,740,466 | 118,916,087 | 119,520,782 | 119,237,878 |
| Contaminated Sites | 44,684 | - | - | - | - | - |
| Education Facilities | 9,076,259 | 14,562,429 | 14,498,488 | 14,642,918 | 14,677,701 | 14,940,920 |
| Housing | 101,413,115 | 88,093,460 | 90,111,178 | 90,805,305 | 91,702,236 | 92,522,085 |
| Water and Sewer | 12,761,972 | 13,408,544 | 13,089,485 | 12,463,941 | 12,273,301 | 12,687,278 |
| Sub-Total (Formula) | $208,178,667 | $234,601,723 | $235,439,617 | $236,828,252 | $238,174,021 | $239,388,161 |
| Operations and Maintenance | ||||||
| Community Infrastructure | 134,770,283 | 157,043,540 | 139,344,744 | 140,209,424 | 143,213,810 | 144,155,510 |
| Contaminated Sites | - | 400,000 | 400,000 | 400,000 | 400,000 | 400,000 |
| Education Facilities | 107,183,658 | 102,578,951 | 101,438,558 | 101,709,476 | 101,985,812 | 102,267,675 |
| Housing | 2,264,122 | 8,898,906 | 8,677,906 | 8,677,906 | 8,677,906 | 8,677,906 |
| Water and Sewer | 154,930,468 | 153,706,981 | 95,139,605 | 96,061,755 | 97,002,347 | 97,961,751 |
| Sub-Total (O&M) | $398,285,044 | $399,749,348 | $346,743,090 | $345,803,155 | $347,373,978 | $349,045,067 |
| Grand Total | ||||||
| Community Infrastructure | 290,194,903 | 415,829,846 | 324,728,864 | 298,378,454 | 280,772,620 | 286,245,704 |
| Contaminated Sites | 22,140,447 | 10,064,723 | 10,806,315 | 2,834,044 | 575,500 | 1,764,925 |
| Education Facilities | 204,653,990 | 240,365,511 | 189,264,365 | 166,839,911 | 137,542,598 | 129,359,352 |
| Housing | 144,812,965 | 136,021,332 | 150,094,084 | 127,785,728 | 111,080,142 | 111,899,991 |
| Water and Sewer | 344,318,292 | 333,973,447 | 282,788,194 | 205,680,343 | 203,166,267 | 166,821,527 |
| Grand Total | $1,006,120,597 | $1,136,254,858 | $957,681,822 | $801,518,480 | $733,137,127 | $696,091,499 |
Appendix A — Regional Summaries
Atlantic Region
| Major Capital (Proposal) | |
|---|---|
| Education Facilities | $4,708,000 |
| Water and Sewer | $4,148,297 |
| Contaminated Sites | $0 |
| Community Infrastructure | $3,002,703 |
| Minor Capital (Formula) | $9,060,182 |
| Minor Capital (Proposal) | $11,546,595 |
| Infrastructure O&M | $18,333,438 |
| Total | $50,799,215 |
Atlantic Breakdown of Planned Spending for Vote 10 in 2014-2015
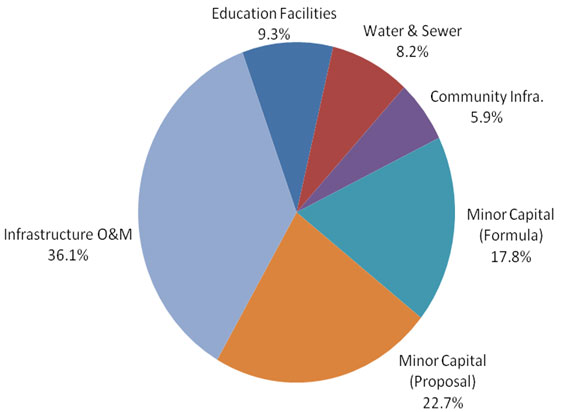
Text description of Atlantic Breakdown of Planned Spending for Vote 10 in 2014-2015
This is a chart showing the Atlantic breakdown of planned spending for Vote 10 in 2014-2015. The chart is a pie chart showing percentage distribution of funding by asset and category. Major capital Education facilities represent 9.3% of all Vote 10 investments, Major capital Water and Wastewater investments represent 8.2% of all Vote 10 investments, Major capital Community Infrastructure represent 5.9% of all Vote 10 investments, Minor capital formula-driven, 17.8%, Minor capital proposal-driven, 22.7% and Infrastructure O&M, 36.1%.
| First Nation Infrastructure Capital Projects Funded this Fiscal (includes proposal-based projects only) | 44 |
|---|---|
| First Nation Infrastructure Capital Projects funded in the five year plan (includes proposal-based projects only) | 44 |
| Total Infrastructure Investment 2014-2015 | $50,799,215 |
| First Nation Population (Statistics Canada, 2011 National Household Survey) | 23,082 |
| Infrastructure Investment per Capita | $2,201 |
Highlights - Fiscal Year 2014–2015
Eel Ground School
Eel Ground First Nation has an on-reserve registered population of 560 and is located approximately 160 km northwest of Moncton, New Brunswick. The community's current school was constructed in 1977 and no longer meets the community's needs. The new facility funded through Budget 2012 Education Facilities Funds will cost $9 million and will be designed with the latest construction and energy efficiency technology, which will significantly reduced operating costs.
Pabineau Water Storage and System Upgrade Project
Pabineau First Nation has an on-reserve registered population of 101 and is located approximately 8 km south of Bathurst, New Brunswick. The First Nation has been on a Boil Water Advisory since June 2005. The water system has been upgraded with a new water storage reservoir, new pump-house and treatment system, watershed protection plan, upgrade of Pabineau Falls Road and looping of waterlines. The project began in 2009 and will be completed in November 2014 at a value of $6.8 million.
| Project Category | Previous Year (Planned Amount) |
Planned Spending | ||||
|---|---|---|---|---|---|---|
| 2014-2015 | 2015-2016 | 2016-2017 | 2017-2018 | 2018-2019 | ||
| The dashes above indicate that planned funding in this category has yet to be determined. Funding levels may only be known just prior to the commencement of the fiscal year in question. *Community Infrastructure category includes various asset classes such as Roads & Bridges, Electrification, Connectivity, Solid Waste, Fuel Tanks, and others. |
||||||
| Proposal Based Capital Projects | ||||||
| Community Infrastructure | 104,250 | 10,890,100 | 1,600,000 | - | - | - |
| Contaminated Sites | 23,000 | - | - | - | - | - |
| Education Facilities | 3,826,675 | 5,164,400 | 840,000 | 7,700,000 | 15,500,000 | 8,500,000 |
| Housing | - | - | - | - | - | - |
| Water and Sewer | 5,309,950 | 7,351,095 | 7,365,155 | 12,400,370 | 10,031,500 | 5,000,000 |
| Sub-Total (Proposal) | $9,263,875 | $23,405,595 | $9,805,155 | $20,100,370 | $25,531,500 | $13,500,000 |
| Formula Based Capital | ||||||
| Community Infrastructure | 912,974 | 906,018 | 906,018 | 906,018 | 906,018 | 906,018 |
| Contaminated Sites | - | - | - | - | - | - |
| Education Facilities | - | - | - | - | - | - |
| Housing | 8,216,763 | 8,154,164 | 8,154,164 | 8,154,164 | 8,154,164 | 8,154,164 |
| Water and Sewer | - | - | - | - | - | - |
| Sub-Total (Formula) | $9,129,737 | $9,060,182 | $9,060,182 | $9,060,182 | $9,060,182 | $9,060,182 |
| Operatioatl_sum and Maintenance | ||||||
| Community Infrastructure | 11,758,245 | 9,675,705 | 5,852,297 | 5,852,297 | 5,852,297 | 5,852,297 |
| Contaminated Sites | - | - | - | - | - | - |
| Education Facilities | 1,407,160 | 2,819,473 | 1,388,250 | 1,388,250 | 1,388,250 | 1,388,250 |
| Housing | 50,000 | - | - | - | - | - |
| Water and Sewer | 4,826,762 | 5,838,260 | 4,645,534 | 2,633,534 | 2,633,534 | 2,633,534 |
| Sub-Total (Formula) | $18,042,167 | $18,333,438 | $11,886,081 | $9,874,081 | $9,874,081 | $9,874,081 |
| Grand Total | ||||||
| Community Infrastructure | 12,775,469 | 21,471,824 | 8,358,316 | 6,758,316 | 6,758,316 | 6,758,316 |
| Contaminated Sites | 23,000 | - | - | - | - | - |
| Education Facilities | 5,233,835 | 7,983,873 | 2,228,250 | 9,088,250 | 16,888,250 | 9,888,250 |
| Housing | 8,266,763 | 8,154,164 | 8,154,164 | 8,154,164 | 8,154,164 | 8,154,164 |
| Water and Sewer | 10,136,712 | 13,189,355 | 12,010,689 | 15,033,904 | 12,665,034 | 7,633,534 |
| Grand Total | $36,435,779 | $50,799,215 | $30,751,418 | $39,034,633 | $44,465,763 | $32,434,263 |
Quebec Region
| Major Capital (Proposal) | |
|---|---|
| Education Facilities | $3,431,372 |
| Water and Sewer | $10,220,307 |
| Contaminated Sites | $0 |
| Community Infrastructure | $0 |
| Minor Capital (Formula) | $22,468,583 |
| Minor Capital (Proposal) | $5,198,839 |
| Infrastructure O&M | $30,826,248 |
| Total | $72,145,349 |
Quebec Breakdown of Planned Spending for Vote 10 in 2014-2015

Text description of Quebec Breakdown of Planned Spending for Vote 10 in 2014-2015
This is a chart showing the Quebec breakdown of planned spending for Vote 10 in 2014-2015. The chart is a pie chart showing percentage distribution of funding by asset and category. Major capital Education facilities represent 4.8% of all Vote 10 investments, Major capital Water and sewer, 14.2%, Minor capital formula-driven, 31.1%, Minor capital proposal-driven, 7.2% and Infrastructure O&M, 42.7%
| First Nation Infrastructure Capital Projects Funded this Fiscal (includes proposal-based projects only) | 55 |
|---|---|
| First Nation Infrastructure Capital Projects funded in the five year plan (includes proposal-based projects only) | 81 |
| Total Infrastructure Investment 2014-2015 | $72,145,349 |
| First Nation Population (Statistics Canada, 2011 National Household Survey) | 54,846 |
| Infrastructure Investment per Capita | $1,315 |
Highlights - Fiscal Year 2013–2014
Natashquan Montagnais First Nation – Potable Water and Wastewater
The population of the Natashquan Montagnais First Nation is 976. The reserve is located on the lower north shore of the St. Lawrence River, 336 km east of Sept-Îles. The community implemented two infrastructure projects. The first consists of expanding the reserve's potable water reservoir. The second is the rebuilding of wastewater treatment infrastructures. For both projects, aboriginal workforce skills were or will be developed while the work is being carried out.
Potable water: The current capacity of the potable water reservoir is 550 m3. It provides fire protection for the residences but no other buildings. The potable water reservoir expansion project will double the reservoir's capacity to a total volume of 980 m3, which means doubling the fire protection to include community buildings and meeting the increased need for water resulting from population growth in the next 25 years. The work is scheduled to begin in summer 2014. The estimated cost of the project is $2.1 million.
Wastewater: When the aerated lagoon reconstruction project is completed, environmental standards for the discharging of treated water into the river will be met, and water treatment capacity for the next 25 years will be increased. The aerated lagoons were redeveloped, an extended aeration system was installed and sludge pumped into large bladders to be converted and used to cover the landfill site. The plant building, the discharge line and the pumping station required rehabilitation. The work which began in July 2013 will be completed in July 2014. The project costs $5 million.
Atikamekws of Wemotaci – Reconstruction and Expansion of the Seskitin School
The Wemotaci Reserve is located on the north shore of the St. Maurice River, 100 km northwest of La Tuque. The registered on-reserve population is 1,391.
The Wemotaci primary school was built in 1971 and expanded in 1983 and 1997. There have not been any major renovations to the school in 42 years. The school is 2,992 m2 including a 690 m2 gymnasium. The school serves students in K-4, K-5 and primary grades 1 to 6.
The school rehabilitation project will consist of rebuilding, on the existing foundation, a two story school as well as renovating change rooms and storage areas. After the project is complete the school will cover 3,700 m2. This project will address the problems with the existing building and the need for more space resulting from the projected increased number of students.
The school project will cost a total of $9.4 million of which $710,000 will come from the province.
The work should begin in July 2014 and be completed in October 2015.
| Project Category | Previous Year (Planned Amount) |
Planned Spending | ||||
|---|---|---|---|---|---|---|
| 2014-2015 | 2015-2016 | 2016-2017 | 2017-2018 | 2018-2019 | ||
| The dashes above indicate that planned funding in this category has yet to be determined. Funding levels may only be known just prior to the commencement of the fiscal year in question. *Community Infrastructure category includes various asset classes such as Roads & Bridges, Electrification, Connectivity, Solid Waste, Fuel Tanks, and others. |
||||||
| Proposal Based Capital Projects | ||||||
| Community Infrastructure | 2,202,565 | 3,610,406 | 3,600,796 | 3,514,443 | 3,985,772 | 4,339,864 |
| Contaminated Sites | 300,000 | - | - | - | - | - |
| Education Facilities | 2,451 | 3,431,372 | 4,445,340 | 5,222,047 | 3,379,084 | 1,650,757 |
| Housing | 370,000 | - | - | - | - | - |
| Water and Sewer | 11,811,842 | 11,808,740 | 11,389,434 | 10,916,618 | 12,321,502 | 13,492,654 |
| Sub-Total (Proposal) | $17,135,752 | $18,850,518 | $19,435,570 | $19,653,108 | $19,686,358 | $19,808,200 |
| Formula Based Capital | ||||||
| Community Infrastructure | 11,756,405 | 11,932,328 | 11,932,328 | 11,932,328 | 11,932,328 | 11,932,328 |
| Contaminated Sites | - | - | - | - | - | - |
| Education Facilities | 443,619 | 450,257 | 450,257 | 450,257 | 450,257 | 450,257 |
| Housing | 7,144,451 | 7,251,361 | 7,251,361 | 7,251,361 | 7,251,361 | 7,251,361 |
| Water and Sewer | 2,792,844 | 2,834,636 | 2,834,636 | 2,834,636 | 2,834,636 | 2,834,636 |
| Sub-Total (Formula) | $17,135,752 | $22,468,583 | $22,468,583 | $22,468,583 | $22,468,583 | $22,468,583 |
| Operations and Maintenance | ||||||
| Community Infrastructure | 12,147,388 | 12,023,321 | 11,417,936 | 11,417,936 | 11,417,936 | 11,417,936 |
| Contaminated Sites | - | 400,000 | 400,000 | 400,000 | 400,000 | 400,000 |
| Education Facilities | 10,367,184 | 10,531,010 | 10,531,010 | 10,531,010 | 10,531,010 | 10,531,010 |
| Housing | 660,960 | 645,911 | 630,911 | 630,911 | 630,911 | 630,911 |
| Water and Sewer | 7,775,332 | 7,226,006 | 7,261,339 | 7,198,777 | 7,165,527 | 7,198,777 |
| Sub-Total (Formula) | $30,950,864 | $30,826,248 | $30,241,196 | $30,178,634 | $30,145,384 | $30,178,634 |
| Grand Total | ||||||
| Community Infrastructure | 26,106,358 | 27,566,055 | 26,951,060 | 26,864,707 | 27,336,036 | 27,690,128 |
| Contaminated Sites | 300,000 | 400,000 | 400,000 | 400,000 | 400,000 | 724,925 |
| Education Facilities | 13,262,148 | 14,412,639 | 15,426,607 | 16,203,314 | 14,360,351 | 12,632,024 |
| Housing | 8,175,411 | 7,897,272 | 7,882,272 | 7,882,272 | 7,882,272 | 7,882,272 |
| Water and Sewer | 22,380,018 | 21,869,382 | 21,485,409 | 20,950,031 | 22,321,665 | 23,526,067 |
| Grand Total | $70,223,935 | $72,145,349 | $72,145,349 | $72,300,325 | $72,300,325 | $72,455,417 |
Ontario Region
| Major Capital (Proposal) | |
|---|---|
| Education Facilities | $47,717,257 |
| Water and Sewer | $31,828,893 |
| Contaminated Sites | $1,457,111 |
| Community Infrastructure | $23,598,272 |
| Minor Capital (Formula) | $48,020,043 |
| Minor Capital (Proposal) | $27,630,462 |
| Infrastructure O&M | $123,508,192 |
| Total | $303,760,230 |
Ontario Breakdown of Planned Spending for Vote 10 in 2014-2015
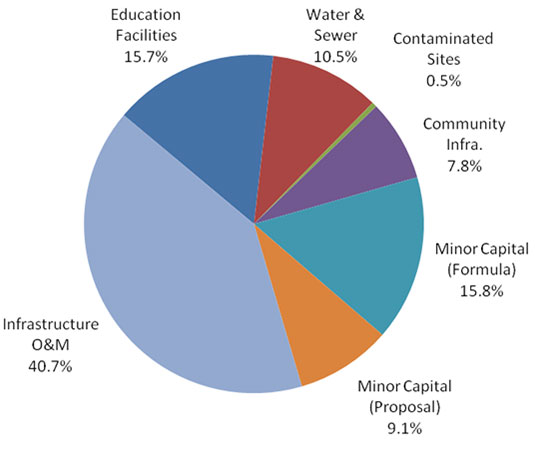
Text description of Ontario Breakdown of Planned Spending for Vote 10 in 2014-2015
This is a chart showing the Ontario breakdown of planned spending for Vote 10 in 2014-2015. The chart is a pie chart showing percentage distribution of funding by asset and category. Major capital Education facilities represent 15.7% of all Vote 10 investments, Major capital Water and sewer, 10.5%, Major capital Contaminated sites, 0.5%, Major capital Community infrastructure, 7.8%, Minor capital formula-driven, 15.8%, Minor capital proposal-driven, 9.1% and Infrastructure O&M, 40.7%.
| First Nation Infrastructure Capital Projects Funded this Fiscal (includes proposal-based projects only) | 126 |
|---|---|
| First Nation Infrastructure Capital Projects funded in the five year plan (includes proposal-based projects only) | 137 |
| Total Infrastructure Investment 2014-2015 | $303,760,230 |
| First Nation Population (Statistics Canada, 2011 National Household Survey) | 93,119 |
| Infrastructure Investment per Capita | $3,262 |
Highlights - Fiscal Year 2013–2014
Serpent River Water Treatment Plant
Located approximately 30 km east of Blind River, near Sault Ste. Marie, the total population of Serpent River is 1,340 and the on-reserve population is 376.
The community is currently on a groundwater system of four wells and pump houses that are interconnected. The current water distribution system was built between 1982 and 1983.
This project will replace the existing groundwater system with a raw water lake intake, a new water treatment plant, a booster pumping station, water mains, and fire hydrants at an estimated cost of $13.4 million. AANDC is providing $12.6 million and the First Nation's cost share is $730,000. The project is scheduled for substantial completion in July 2015.
Attawapiskat Elementary School
Attawapiskat First Nation has an on reserve population of 1,981 and is located approximately 490 km north of Timmins, along the coast of James Bay. The community's permanent elementary school was closed in 2000. A temporary school was constructed and occupied in 2001. In July 2011, AANDC approved $31.1 million to support the design and construction of a new 5,808 m2 facility to support the long term education needs of 538 Kindergarten to Grade 8 students.
The school was designed to meet the unique needs of the First Nation, leveraging durable and reliable materials, and features a gymnasium with a stage, a library, Cree culture and language facilities, computer labs, a home economics room, an industrial arts classroom, a music room, and a cafeteria. The facility has also been designed to serve as an emergency response centre and shelter.
The school should be open for classes in September 2014.
Three New Schools – Northern Ontario – Budget 2012
The design and construction of new schools in three Northern Ontario remote First Nations have been approved for a total investment of $111 million, partly funded by the money announced in Budget 2012 for education facilities: Fort Severn and Poplar Hill ($44.5 million) and Pikangikum ($66.6 million) First Nations.
Fort Severn First Nation has a registered on‐reserve population of 510 and is located in northwestern Ontario approximately 680 km north-northeast of the Town of Red Lake. The Fort Severn new school will be a 1,880 m2 Kindergarten to Grade 8 facility for a design enrolment of 112 students.
Poplar Hill First Nation has a registered on‐reserve population of 543 and is located in northwestern Ontario approximately 125 km north-northeast of the Town of Red Lake. The Poplar Hill new school will be a 2,309 m2 Kindergarten to Grade 9 facility for a design enrolment of 173 students.
Pikangikum First Nation has a registered on-reserve population of 2,501 and is located in Northwestern Ontario approximately 100 km north of the Town of Red Lake. The Pikangikum new school will be a 9,239 m2 Kindergarten to Grade 12 facility for a design enrolment of 936 students.
The schools are scheduled for occupancy by fall 2016.
| Project Category | Previous Year (Planned Amount) |
Planned Spending | ||||
|---|---|---|---|---|---|---|
| 2014-2015 | 2015-2016 | 2016-2017 | 2017-2018 | 2018-2019 | ||
| The dashes above indicate that planned funding in this category has yet to be determined. Funding levels may only be known just prior to the commencement of the fiscal year in question. *Community Infrastructure category includes various asset classes such as Roads & Bridges, Electrification, Connectivity, Solid Waste, Fuel Tanks, and others. |
||||||
| Proposal Based Capital Projects | ||||||
| Community Infrastructure | 17,307,701 | 40,550,797 | 21,853,973 | 10,440,194 | - | - |
| Contaminated Sites | 5,772,270 | 1,943,023 | 191,115 | 573,544 | - | - |
| Education Facilities | 17,417,770 | 49,712,674 | 42,075,203 | 27,267,469 | - | - |
| Housing | 450,125 | 5,075,000 | - | - | - | - |
| Water and Sewer | 37,630,623 | 34,950,501 | 27,720,604 | 2,950,000 | 21,050,000 | - |
| Sub-Total (Proposal) | $78,578,489 | $132,231,995 | $91,840,895 | $41,231,207 | $21,050,000 | - |
| Formula Based Capital | ||||||
| Community Infrastructure | 23,489,386 | 23,496,174 | 23,496,174 | 23,496,174 | 23,496,174 | 23,496,174 |
| Contaminated Sites | - | - | - | - | - | - |
| Education Facilities | 1,965,546 | 1,991,954 | 1,991,954 | 1,991,954 | 1,991,954 | 1,991,954 |
| Housing | 22,529,877 | 22,531,915 | 22,531,915 | 22,531,915 | 22,531,915 | 22,531,915 |
| Water and Sewer | - | - | - | - | - | - |
| Sub-Total (Formula) | $47,984,809 | $48,020,043 | $48,020,043 | $48,020,043 | $48,020,043 | $48,020,043 |
| Operations and Maintenance | ||||||
| Community Infrastructure | 40,608,963 | 39,568,318 | 39,568,318 | 39,568,318 | 39,568,318 | 39,568,318 |
| Conaminated Sites | - | - | - | - | - | - |
| Education Facilities | 32,714,934 | 35,736,940 | 35,736,940 | 35,736,940 | 35,736,940 | 35,736,940 |
| Housing | - | 6,951,334 | 6,951,334 | 6,951,334 | 6,951,334 | 6,951,334 |
| Water and Sewer | 40,700,296 | 41,251,600 | 21,881,864 | 21,881,864 | 21,881,864 | 21,881,864 |
| Sub-Total (Formula) | $114,024,193 | $123,508,192 | $104,138,456 | $104,138,456 | $104,138,456 | $104,138,456 |
| Grand Total | ||||||
| Community Infrastructure | 81,406,050 | 103,615,289 | 84,918,465 | 73,504,686 | 63,064,492 | 63,064,492 |
| Contaminated Sites | 5,772,270 | 1,943,023 | 191,115 | 573,544 | - | - |
| Education Facilities | 52,098,250 | 87,441,568 | 79,804,097 | 64,996,363 | 37,728,894 | 37,728,894 |
| Housing | 22,980,002 | 34,558,249 | 29,483,249 | 29,483,249 | 29,483,249 | 29,483,249 |
| Water and Sewer | 78,330,919 | 76,202,101 | 49,602,468 | 24,831,864 | 42,931,864 | 21,881,864 |
| Grand Total | $240,587,491 | $303,760,230 | $243,999,394 | $193,389,706 | $173,208,499 | $152,158,499 |
Manitoba Region
| Major Capital (Proposal) | |
|---|---|
| Education Facilities | $12,075,400 |
| Water and Sewer | $52,847,636 |
| Contaminated Sites | $5,403,500 |
| Community Infrastructure | $67,981,923 |
| Minor Capital (Formula) | $51,598,601 |
| Minor Capital (Proposal) | $5,624,290 |
| Infrastructure O&M | $64,044,722 |
| Total | $259,576,072 |
Manitoba Breakdown of Planned Spending for Vote 10 in 2014-2015
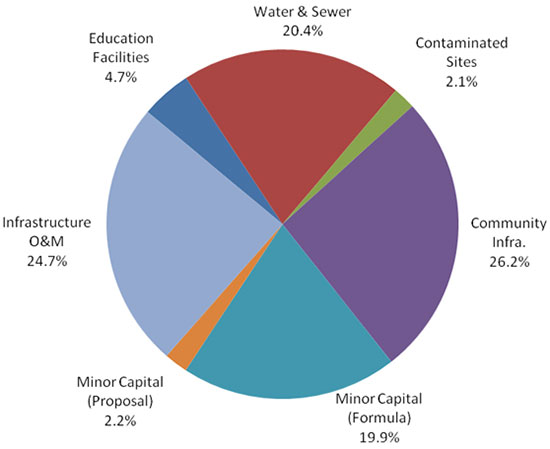
Text description of Manitoba Breakdown of Planned Spending for Vote 10 in 2014-2015
This is a chart showing the Manitoba breakdown of planned spending for Vote 10 in 2014-2015. The chart is a pie chart showing percentage distribution of funding by asset and category. Major capital Education facilities represent 4.7% of all Vote 10 investments, Major capital Water and sewer, 20.4%, Major capital Contaminated sites, 2.1%, Major capital Community infrastructure, 26.2%, Minor capital formula-driven,19.9%, Minor capital proposal-driven, 2.2% and Infrastructure O&M, 24.7%.
| First Nation Infrastructure Capital Projects Funded this Fiscal (includes proposal-based projects only) | 77 |
|---|---|
| First Nation Infrastructure Capital Projects funded in the five year plan (includes proposal-based projects only) | 115 |
| Total Infrastructure Investment 2014-2015 | $259,576,072 |
| First Nation Population (Statistics Canada, 2011 National Household Survey) | 88,213 |
| Infrastructure Investment per Capita | $2,943 |
Highlights - Fiscal Year 2013–2014
Shamattawa School
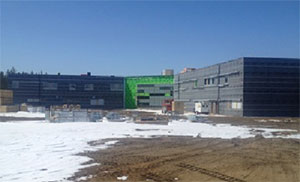
Shamattawa First Nation has an on-reserve registered population of 1,404 and is located approximately 1,277 km northwest of Winnipeg.
A new K4 to grade 12 school is currently being constructed in Shamattawa First Nation and its estimated construction completion date is March 2015. The community's existing facility school was constructed in 1986 and no longer meets the community's needs. The new facility will accommodate 417 students and will cost approximately $34.8 million. The First Nation is planning a grand opening of the school in September 2015 when school commences.
| Project Category | Previous Year (Planned Amount) |
Planned Spending | ||||
|---|---|---|---|---|---|---|
| 2014-2015 | 2015-2016 | 2016-2017 | 2017-2018 | 2018-2019 | ||
| The dashes above indicate that planned funding in this category has yet to be determined. Funding levels may only be known just prior to the commencement of the fiscal year in question. *Community Infrastructure category includes various asset classes such as Roads & Bridges, Electrification, Connectivity, Solid Waste, Fuel Tanks, and others. |
||||||
| Proposal Based Capital Projects | ||||||
| Community Infrastructure | 30,151,536 | 53,165,898 | 25,664,238 | 13,871,816 | 5,557,266 | 5,821,992 |
| Contaminated Sites | 870,300 | 5,523,500 | 7,787,000 | - | - | - |
| Education Facilities | 15,285,600 | 12,429,900 | 16,592,700 | 6,748,000 | - | - |
| Housing | 29,250,000 | 18,987,734 | 37,975,000 | 16,796,100 | - | - |
| Water and Sewer | 35,023,500 | 53,825,717 | 55,923,350 | 22,238,200 | 14,672,900 | 4,800,000 |
| Sub-Total (Proposal) | $110,580,936 | $143,932,749 | $143,942,288 | $59,654,116 | $20,230,166 | $10,621,992 |
| Formula Based Capital | ||||||
| Community Infrastructure | 12,406,847 | 33,616,559 | 32,281,758 | 32,824,786 | 32,959,622 | 32,250,772 |
| Contaminated Sites | 44,684 | - | - | - | - | - |
| Education Facilities | 1,254,405 | 1,514,386 | 1,246,886 | 1,183,686 | 1,006,686 | 1,053,886 |
| Housing | 18,066,233 | 9,831,203 | 11,831,265 | 12,110,234 | 12,455,976 | 12,843,326 |
| Water and Sewer | 6,823,835 | 6,636,453 | 6,163,692 | 5,404,895 | 5,101,317 | 5,375,617 |
| Sub-Total (Formula) | $38,596,004 | $51,598,601 | $51,523,601 | $51,523,601 | $51,523,601 | $51,523,601 |
| Operations and Maintenance | ||||||
| Community Infrastructure | 15,755,506 | 18,221,910 | 17,821,910 | 17,821,910 | 17,821,910 | 17,821,910 |
| Contaminated Sites | - | - | - | - | - | - |
| Education Facilities | 20,959,919 | 18,795,267 | 18,795,267 | 18,795,267 | 18,795,267 | 18,795,267 |
| Housing | - | - | - | - | - | - |
| Water and Sewer | 24,645,707 | 27,027,545 | 26,727,335 | 26,727,335 | 26,727,335 | 26,727,335 |
| Sub-Total (Formula) | $61,361,132 | $64,044,722 | $63,344,512 | $63,344,512 | $63,344,512 | $63,344,512 |
| Grand Total | ||||||
| Community Infrastructure | 58,313,889 | 105,004,367 | 75,767,906 | 64,518,512 | 56,338,798 | 55,894,674 |
| Contaminated Sites | 914,984 | 5,523,500 | 7,787,000 | - | - | - |
| Education Facilities | 37,499,924 | 32,739,553 | 36,634,853 | 26,726,953 | 19,801,953 | 19,849,153 |
| Housing | 47,316,233 | 28,818,937 | 49,806,265 | 28,906,334 | 12,455,976 | 12,843,326 |
| Water and Sewer | 66,493,042 | 87,489,715 | 88,814,377 | 54,370,430 | 46,501,552 | 36,902,952 |
| Grand Total | $210,538,072 | $259,576,072 | $258,810,401 | $174,522,229 | $135,098,279 | $125,490,105 |
Saskatchewan Region
| Major Capital (Proposal) | |
|---|---|
| Education Facilities | $10,968,701 |
| Water and Sewer | $26,364,700 |
| Contaminated Sites | $0 |
| Community Infrastructure | $11,699,200 |
| Minor Capital (Formula) | $29,047,955 |
| Minor Capital (Proposal) | $5,480,226 |
| Infrastructure O&M | $57,320,872 |
| Total | $140,881,654 |
Saskatchewan Breakdown of Planned Spending for Vote 10 in 2014-2015
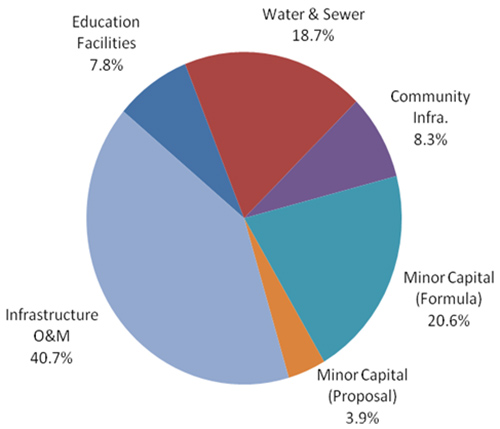
Text description of Saskatchewan Breakdown of Planned Spending for Vote 10 in 2014-2015
This is a chart showing the Saskatchewan breakdown of planned spending for Vote 10 in 2014-2015. The chart is a pie chart showing percentage distribution of funding by asset and category. Major capital Education facilities represent 7.8% of all Vote 10 investments, Major capital Water and sewer, 18.7%, Major capital Community infrastructure, 8.3%, Minor capital formula-driven, 20.6%, Minor capital proposal-driven, 3.9% and Infrastructure O&M, 40.7%.
| First Nation Infrastructure Capital Projects Funded this Fiscal (includes proposal-based projects only) | 53 |
|---|---|
| First Nation Infrastructure Capital Projects funded in the five year plan (includes proposal-based projects only) | 126 |
| Total Infrastructure Investment 2014-2015 | $140,881,654 |
| First Nation Population (Statistics Canada, 2011 National Household Survey) | 70,654 |
| Infrastructure Investment per Capita | $1,994 |
Highlights - Fiscal Year 2014–2015
Makwa Sahgaiehcan Water Treatment Plant Upgrade
The Makwa Sahgaiehcan Reserve #129 is located in northwest Saskatchewan approximately 65 km north of Meadow Lake. The current on reserve population is 954 people. The water treatment plant, built in 1998, was identified as high risk in the national assessment and in last annual plant inspections. The current system requires upgrades to its capacity and treatment capabilities.
The project consists of using groundwater source and adding a membrane system to the biological treatment, to "polish" the water. Design was completed in 2013/2014 and construction will be initiated in 2014/2015. The current total project cost estimate is $6.9 million. This project is funded through the First Nation Water and Wastewater Action Plan (FNWWAP).
Red Earth Emergency Bridge Replacement
The Red Earth Cree Nation Reserve #29 & #29A is located in the north central area of Saskatchewan approximately 90 km east of Nipawin. The current on reserve population is 1,332. The main bridge constructed in 1974 is the only means of access to the community. It was inspected in 2013 and restricted to 3 tonne loads and a 15 kph speed limit. Eventually, one of the tow lanes was completely closed due to shifting of the bridge as a result of significant flooding every spring. These restrictions resulted in emergency vehicles, propane resupply trucks, school buses, septic trucks, garbage truck and grocery delivery trucks being unable to access the community.
Through the design process a temporary repair was completed to allow for increased access to the community until a new bridge could be constructed. Design of the new bridge was completed in 2013/2014 and will be constructed in 2014/2015 at a total estimated cost of $3 million. The new design has made allowances for the increased water levels during time of flooding and when significant ice floes move through in the spring. This project is being funded by the First Nation Infrastructure Fund (FNIF).
Peter Ballantyne Pelican Narrows High School Renovation/Addition Project
The Pelican Narrows (Opawikosicikan) Reserve #184B is located in the north east area of Saskatchewan approximately 400 km north east of Prince Albert. The current on reserve population is 2,151 people.
The Peter Ballantyne Cree Nation (Pelican Narrows) currently delivers a nursery to Grade 12 education program according to the provincial curriculum, including instruction of Cree language and cultural education on Reserve in two separate school facilities. The 3,933 m2 Wapanacak Primary School opened in 2000 and accommodates a nursery to Grade 3 program. The 5,204 m2 Opawikosicikan Elementary/High School opened in 1989 and accommodates a Grade 4 to Grade 12 program.
The proposed scope of work is to construct an addition of 756 m2 to the existing Opawikosicikan School and to complete an extensive renovation to the interior and exterior of the 5,204 m2 facility to meet current codes and standards. The project scope will include the provisions of temporary classroom facilities that will be converted to teacherages at the completion of the project. The construction phase of this project began in 2013/2014 and is currently on schedule for a 2015/2016 completion. The current total estimated project cost is $22.3 million and was a project identified in the Budget 2012 Education Facilities announcement.
| Project Category | Previous Year (Planned Amount) |
Planned Spending | ||||
|---|---|---|---|---|---|---|
| 2014-2015 | 2015-2016 | 2016-2017 | 2017-2018 | 2018-2019 | ||
| The dashes above indicate that planned funding in this category has yet to be determined. Funding levels may only be known just prior to the commencement of the fiscal year in question. *Community Infrastructure category includes various asset classes such as Roads & Bridges, Electrification, Connectivity, Solid Waste, Fuel Tanks, and others. |
||||||
| Proposal Based Capital Projects | ||||||
| Community Infrastructure | 5,780,800 | 12,755,426 | 1,469,818 | 1,500,000 | 529,999 | - |
| Contaminated Sites | - | - | - | - | - | - |
| Education Facilities | 28,891,100 | 12,959,401 | 3,351,136 | 1,550,000 | - | - |
| Housing | 379,400 | 37,200 | - | - | - | - |
| Water and Sewer | 33,053,200 | 28,760,800 | 31,830,000 | 28,475,000 | 19,403,000 | 16,134,000 |
| Sub-Total (Proposal) | $65,104,500 | $54,512,827 | $36,650,954 | $31,525,000 | $19,932,999 | $16,134,000 |
| Formula Based Capital | ||||||
| Community Infrastructure | 4,410,271 | 4,843,534 | 4,843,534 | 4,843,534 | 4,843,534 | 4,843,534 |
| Contaminated Sites | - | - | - | - | - | - |
| Education Facilities | 878,132 | 878,132 | 878,132 | 878,132 | 878,132 | 878,132 |
| Housing | 22,597,342 | 23,326,289 | 23,326,289 | 23,326,289 | 23,326,289 | 23,326,289 |
| Water and Sewer | - | - | - | - | - | - |
| Sub-Total (Formula) | $27,885,745 | $29,047,955 | $29,047,955 | $29,047,955 | $29,047,955 | $29,047,955 |
| Operations and Maintenance | ||||||
| Community Infrastructure | 15,366,657 | 20,977,448 | 20,977,448 | 20,977,448 | 20,977,448 | 20,977,448 |
| Contaminated Sites | - | - | - | - | - | - |
| Education Facilities | 22,106,099 | 21,411,205 | 21,411,205 | 21,411,205 | 21,411,205 | 21,411,205 |
| Housing | 1,839,769 | 1,095,661 | 1,095,661 | 1,095,661 | 1,095,661 | 1,095,661 |
| Water and Sewer | 22,093,063 | 13,836,558 | 13,959,408 | 13,959,408 | 13,959,408 | 13,959,408 |
| Sub-Total (Formula) | $61,405,588 | $57,320,872 | $57,443,722 | $57,443,722 | $57,443,722 | $57,443,722 |
| Grand Total | ||||||
| Community Infrastructure | 25,557,728 | 38,576,408 | 27,290,800 | 27,320,982 | 26,350,981 | 25,820,982 |
| Contaminated Sites | - | - | - | - | - | - |
| Education Facilities | 48,875,331 | 35,248,738 | 25,640,473 | 23,839,337 | 22,289,337 | 22,289,337 |
| Housing | 24,816,511 | 24,459,150 | 24,421,950 | 24,421,950 | 24,421,950 | 24,421,950 |
| Water and Sewer | 55,146,263 | 42,597,358 | 45,789,408 | 42,434,408 | 33,362,408 | 30,093,408 |
| Grand Total | $154,395,833 | $140,881,654 | $123,142,631 | $118,016,677 | $106,424,676 | $102,625,677 |
Alberta Region
| Major Capital (Proposal) | |
|---|---|
| Education Facilities | $8,123,125 |
| Water and Sewer | $4,895,890 |
| Contaminated Sites | $0 |
| Community Infrastructure | $2,549,313 |
| Minor Capital (Formula) | $51,299,072 |
| Minor Capital (Proposal) | $16,233,030 |
| Infrastructure O&M | $51,560,915 |
| Total | $134,661,345 |
Alberta Breakdown of Planned Spending for Vote 10 in 2014-2015
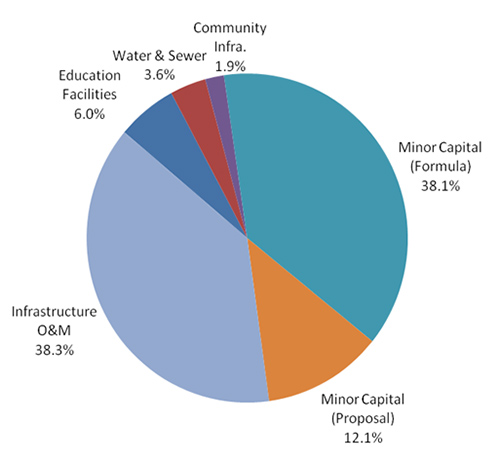
Text description of Alberta Breakdown of Planned Spending for Vote 10 in 2014-2015
This is a chart showing the Alberta breakdown of planned spending for Vote 10 in 2014-2015. The chart is a pie chart showing percentage distribution of funding by asset and category. Major capital Education facilities represent 6.0% of all Vote 10 investments, Major capital Water and sewer, 3.6%, Major capital Community infrastructure, 1.9%, Minor capital formula-driven, 38.1%, Minor capital proposal-driven, 12.1% and Infrastructure O&M, 38.3%.
| First Nation Infrastructure Capital Projects Funded this Fiscal (includes proposal-based projects only) | 84 |
|---|---|
| First Nation Infrastructure Capital Projects funded in the five year plan (includes proposal-based projects only) | 85 |
| Total Infrastructure Investment 2014-2015 | $134,661,345 |
| First Nation Population (Statistics Canada, 2011 National Household Survey) | 72,625 |
| Infrastructure Investment per Capita | $1,854 |
Highlights - Fiscal Year 2014–2015
O'Chiese First Nation New School Project
O'Chiese First Nation is located about 150 km northwest of Red Deer, and has an on reserve population of 450. The O'Chiese New School Project is an innovative financing plan as part of Budget 2012 Education Facilities funding that has been created by partnering with O'Chiese First Nation and AANDC. O'Chiese First Nation has secured construction loans for this project through their own source revenues. The current funding percentage split is 75% O'Chiese First Nation and 25% AANDC. This new school will provide classrooms for both elementary and secondary school students and will be able to accommodate about 240 students.
There are 3 separate contracts as part of this entire project: Roads Contract that includes utilities; Water and Wastewater Contract that supports the School; and the New School Construction & Site Development Contract. The Roads portion of the project is currently in construction, the New School Construction & Site Development is in construction tender, and the Water and Wastewater is being designed.
The expected outcomes for this project are a September 2016 opening and the completion of 3 separate contracts under one umbrella project.
| Project Category | Previous Year (Planned Amount) |
Planned Spending | ||||
|---|---|---|---|---|---|---|
| 2014-2015 | 2015-2016 | 2016-2017 | 2017-2018 | 2018-2019 | ||
| The dashes above indicate that planned funding in this category has yet to be determined. Funding levels may only be known just prior to the commencement of the fiscal year in question. *Community Infrastructure category includes various asset classes such as Roads & Bridges, Electrification, Connectivity, Solid Waste, Fuel Tanks, and others. |
||||||
| Proposal Based Capital Projects | ||||||
| Community Infrastructure | 976,282 | 7,351,875 | - | 1,400,000 | - | - |
| Contaminated Sites | 35,250 | - | - | - | - | - |
| Education Facilities | 10,163,335 | 11,233,125 | - | - | - | - |
| Housing | - | 250,000 | - | - | - | - |
| Water and Sewer | 18,561,568 | 12,966,358 | - | - | - | - |
| Sub-Total (Proposal) | $29,736,435 | $31,801,358 | $- | $1,400,000 | $- | $- |
| Formula Based Capital | ||||||
| Community Infrastructure | 19,141,712 | 20,392,108 | 20,700,079 | 21,014,209 | 21,334,621 | 21,661,442 |
| Contaminated Sites | - | - | - | - | - | - |
| Education Facilities | 873,442 | 7,145,358 | 7,288,265 | 7,434,030 | 7,582,711 | 7,734,365 |
| Housing | 15,910,148 | 17,180,567 | 17,384,594 | 17,592,702 | 17,804,972 | 18,021,487 |
| Water and Sewer | - | 6,581,039 | 6,712,660 | 6,846,913 | 6,983,851 | 7,123,528 |
| Sub-Total (Formula) | $35,925,302 | $51,299,072 | $52,085,598 | $52,887,854 | $53,706,155 | $54,540,822 |
| Operations and Maintenance | ||||||
| Community Infrastructure | 19,446,781 | 33,150,904 | 21,944,155 | 22,381,571 | 22,827,734 | 23,282,821 |
| Contaminated Sites | - | - | - | - | - | - |
| Education Facilities | 19,141,955 | 12,788,267 | 13,044,032 | 13,304,913 | 13,571,011 | 13,842,431 |
| Housing | 73,393 | - | - | - | - | - |
| Water and Sewer | 22,012,672 | 5,621,744 | 5,734,179 | 5,848,862 | 5,965,840 | 6,085,157 |
| Sub-Total (Formula) | $60,674,801 | $51,560,915 | $40,722,367 | $41,535,346 | $42,364,585 | $43,210,409 |
| Grand Total | ||||||
| Community Infrastructure | 39,564,775 | 60,894,887 | 42,644,234 | 44,795,779 | 44,162,355 | 44,944,263 |
| Contaminated Sites | 35,250 | - | - | - | - | - |
| Education Facilities | 30,178,732 | 31,166,750 | 20,332,298 | 20,738,943 | 21,153,722 | 21,576,797 |
| Housing | 15,983,541 | 17,430,567 | 17,384,594 | 17,592,702 | 17,804,972 | 18,021,487 |
| Water and Sewer | 40,574,240 | 25,169,141 | 12,446,839 | 12,695,775 | 12,949,691 | 13,208,685 |
| Grand Total | $126,336,538 | $134,661,345 | $92,807,964 | $95,823,200 | $96,070,740 | $97,751,232 |
British Columbia Region
| Major Capital (Proposal) | |
|---|---|
| Education Facilities | $26,464,909 |
| Water and Sewer | $25,414,867 |
| Contaminated Sites | $2,047,000 |
| Community Infrastructure | $15,833,948 |
| Minor Capital (Formula) | $20,235,069 |
| Minor Capital (Proposal) | $23,909,056 |
| Infrastructure O&M | $51,286,885 |
| Total | $165,191,734 |
British Columbia Breakdown of Planned Spending for Vote 10 in 2014-2015
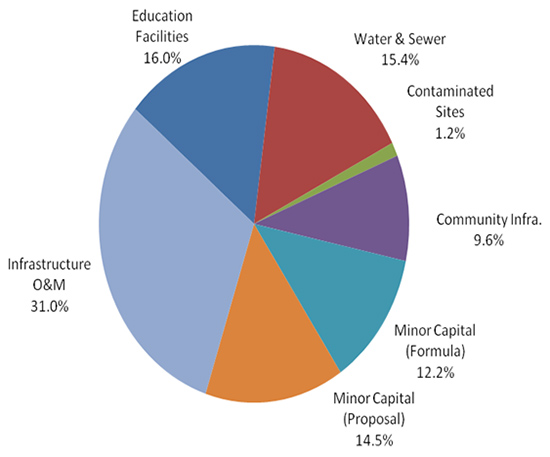
Text description of British Columbia Breakdown of Planned Spending for Vote 10 in 2014-2015
This is a chart showing the British Columbia breakdown of planned spending for Vote 10 in 2014-2015. The chart is a pie chart showing percentage distribution of funding by asset and category. Major capital Education facilities represent 16.0% of all Vote 10 investments, Major capital Water and sewer, 15.4%, Major capital Contaminated sites, 1.2%, Major capital Community infrastructure, 9.6%, Minor capital formula-driven, 12.2%, Minor capital proposal-driven, 14.5% and Infrastructure O&M, 31.0%.
| First Nation Infrastructure Capital Projects Funded this Fiscal (includes proposal-based projects only) | 175 |
|---|---|
| First Nation Infrastructure Capital Projects funded in the five year plan (includes proposal-based projects only) | 263 |
| Total Infrastructure Investment 2014-2015 | $165,191,734 |
| First Nation Population (Statistics Canada, 2011 National Household Survey) | 62,235 |
| Infrastructure Investment per Capita | $2,654 |
Highlights - Fiscal Year 2014–2015
Boothroyd - Domestic Water Supply Upgrade Kahmoose IR 4
The Boothroyd Band, Kahmoose IR 4 community is located north of the City of Hope and has an on-reserve population of 281.
The existing 243 m3 steel reservoir was constructed in 1988 and had visible leakage, missing or corroded bolts, as well as holes in the floor.
Project construction began in January 2014, and included decommissioning of the two supply wells, tie-in of two new wells, the addition of a pump-house/chlorination building, and the construction of a new 430 m3 reservoir. The $2.3 million project will be completed in May 2014. The new facilities will provide the community with chlorinated potable water and adequate fire protection.
Lax Kw'alaams – Community School
The Lax Kw'alaams IR community is located 30 km north of Prince Rupert and can only be accessed by water and air. The on-reserve population is 3,684.
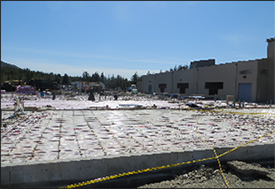
The three existing school buildings have reached the end of their life, do not meet current fire and seismic regulations and do not provide schooling for grades 11 and 12. The new school building is being built to design standards and will accommodate 156 grade one to 12 students, as well as contain a kindergarten facility for K4 and K5 students.
The $20.7 million Community School project includes the construction of a new school building with a playfield area, road access, utilities, landscaping, parking, emergency power, and the renovation of the existing gymnasium. The 2,673 m2 school facility will include 12 classrooms, kindergarten space, a home economics room, an industrial arts room, a science room, a computer room, a health room, a library, and administrative and storage space.
Construction is currently underway with an anticipated completion date of June 2015.
Kwadacha Nation – Solid Waste Management Centre
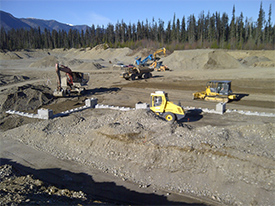
Kwadacha Nation is located in Fort Ware, 570 km north of Prince George and 425 km north of Mackenzie, making it one of the most remote communities in British Columbia. The on-reserve population is 287.
The Kwadacha Solid Waste Management Centre project involves the implementation of a waste transfer program from Kwadacha Fort Ware IR 1 to the Mackenzie Regional Landfill. The purpose of this project is to devise an easily accessible system to transfer waste, recyclables, household hazardous waste, and bulky waste to appropriate off-reserve facilities. The solid waste management centre consists of a steel bin enclosure, a shelter, a baler, a household hazardous waste shelter, a free-store, and 42 m3 roll-off containers.
A local First Nations contractor began site development for the $1.4 million project in September 2013. The anticipated completion date for this project is October 2014.
BC Region Fire Protection Strategy
BC Region's Fire Protection Strategy was released on December 10, 2012. It sets out the regional approach to fire protection, and at its core are fire prevention initiatives to enhance home fire safety protection and public fire safety education. The regional budget for the program is $2 million per year.
In British Columbia, the First Nations' Emergency Services Society (FNESS) is a key partner in raising awareness of fire prevention and supporting fire protection capacity in First Nations communities. Through FNESS' support, five First Nations achieved FireSmart Recognition – the first communities to do so in Canada. These communities are T'it'q'et, Bridge River, Whispering Pines/Clinton, Esk'etemc, and Shackan.
In 2013-2014 AANDC piloted Fire Safety Assessments (FSA) in 14 communities. The assessments reviewed the existing fire protection systems, including fire departments and fire prevention programs, and identified appropriate program options and activities to maximize the level of fire protection based on each community's particular demographics, circumstances and capacity. In 2014-2015 Regional staff will follow up with those 14 communities to prioritize and implement options, which may also include capital investments. The plan is also to continue FSAs, with a focus on communities with no apparent fire protection: 8 communities have been identified for site visits in 2014-2015.
In support of the Fire Protection strategy, AANDC continues to collaborate with the First Nations' Emergency Services Society in the purchase and distribution of over 16,000 smoke alarms.
| Project Category | Previous Year (Planned Amount) |
Planned Spending | ||||
|---|---|---|---|---|---|---|
| 2014-2015 | 2015-2016 | 2016-2017 | 2017-2018 | 2018-2019 | ||
| The dashes above indicate that planned funding in this category has yet to be determined. Funding levels may only be known just prior to the commencement of the fiscal year in question. *Community Infrastructure category includes various asset classes such as Roads & Bridges, Electrification, Connectivity, Solid Waste, Fuel Tanks, and others. |
||||||
| Proposal Based Capital Projects | ||||||
| Community Infrastructure | 13,900,819 | 11,417,073 | 11,134,389 | 8,519,050 | 7,957,550 | 12,683,020 |
| Contaminated Sites | 15,094,943 | 2,198,200 | 2,428,200 | 1,860,500 | 175,500 | 1,040,000 |
| Education Facilities | 13,328,248 | 28,293,259 | 6,022,939 | 2,000,000 | 2,000,000 | 2,000,000 |
| Housing | 10,326,203 | 14,479,032 | 13,130,000 | 11,250,000 | 10,500,000 | 10,500,000 |
| Water and Sewer | 34,471,856 | 37,282,216 | 35,929,985 | 20,271,565 | 19,159,314 | 20,005,319 |
| Sub-Total (Proposal) | $87,122,069 | $93,669,780 | $68,645,513 | $43,901,115 | $39,792,364 | $46,228,339 |
| Formula Based Capital | ||||||
| Community Infrastructure | 11,701,299 | 11,885,456 | 12,123,165 | 12,365,629 | 12,612,941 | 12,865,200 |
| Contaminated Sites | - | - | - | - | - | - |
| Education Facilities | 3,661,115 | 3,032,599 | 3,093,251 | 3,155,116 | 3,218,218 | 3,282,583 |
| Housing | 5,238,034 | 5,317,014 | 5,423,354 | 5,531,821 | 5,642,458 | 5,755,307 |
| Water and Sewer | 3,145,293 | - | - | - | - | - |
| Sub-Total (Formula) | $23,745,741 | $20,235,069 | $20,639,771 | $21,052,566 | $21,473,617 | $21,903,090 |
| Operations and Maintenance | ||||||
| Community Infrastructure | 18,069,645 | 22,028,926 | 20,386,665 | 20,794,398 | 23,332,702 | 23,799,356 |
| Contaminated Sites | - | - | - | - | - | - |
| Education Facilities | 486,407 | 492,014 | 501,854 | 511,891 | 522,129 | 532,572 |
| Housing | - | 206,000 | - | - | - | - |
| Water and Sewer | 29,719,503 | 28,559,945 | 15,287,704 | 15,593,458 | 13,782,911 | 14,058,569 |
| Sub-Total (Formula) | $48,275,555 | $51,286,885 | $36,176,223 | $36,899,747 | $37,637,742 | $38,390,497 |
| Grand Total | ||||||
| Community Infrastructure | 43,671,763 | 45,331,455 | 43,644,219 | 41,679,076 | 43,903,193 | 49,347,576 |
| Contaminated Sites | 15,094,943 | 2,198,200 | 2,428,200 | 1,860,500 | 175,500 | 1,040,000 |
| Education Facilities | 17,475,770 | 31,817,872 | 9,618,044 | 5,667,007 | 5,740,348 | 5,815,154 |
| Housing | 15,564,237 | 20,002,046 | 18,553,354 | 16,781,821 | 16,142,458 | 16,255,307 |
| Water and Sewer | 67,336,652 | 65,842,161 | 51,217,689 | 35,865,023 | 32,942,225 | 34,063,888 |
| Grand Total | $159,143,365 | $165,191,734 | $125,461,506 | $101,853,428 | $98,903,723 | $106,521,925 |
Yukon Region
| Major Capital (Proposal) | |
|---|---|
| Education Facilities | $0 |
| Water and Sewer | $1,850,000 |
| Contaminated Sites | $0 |
| Community Infrastructure | $500,000 |
| Minor Capital (Formula) | $2,872,218 |
| Minor Capital (Proposal) | $1,148,965 |
| Infrastructure O&M | $2,868,076 |
| Total | $9,239,259 |
Yukon Breakdown of Planned Spending for Vote 10 in 2014-2015
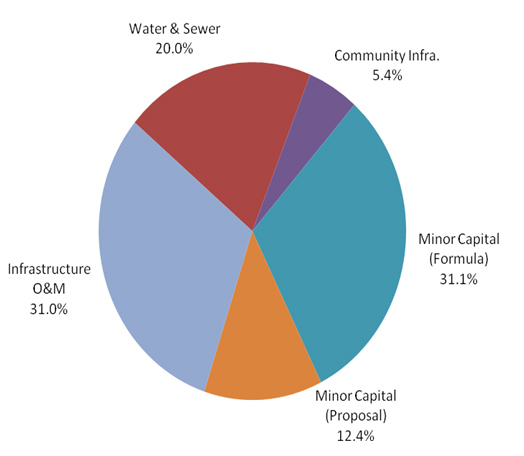
Text description of Yukon Breakdown of Planned Spending for Vote 10 in 2014-2015
This is a chart showing the Yukon breakdown of planned spending for Vote 10 in 2014-2015. The chart is a pie chart showing percentage distribution of funding by asset and category. Major capital Water and sewer represent 20.0% of all Vote 10 investments, Major capital Community infrastructure, 5.4%, Minor capital formula-driven, 31.1%, Minor capital proposal-driven, 12.4% and Infrastructure O&M, 31.0%.
| First Nation Infrastructure Capital Projects Funded this Fiscal (includes proposal-based projects only) | 13 |
|---|---|
| First Nation Infrastructure Capital Projects funded in the five year plan (includes proposal-based projects only) | 14 |
| Total Infrastructure Investment 2014-2015 | $9,239,259 |
| First Nation Population (Statistics Canada, 2011 National Household Survey) | 3,990 |
| Infrastructure Investment per Capita | $2,316 |
Highlights - Fiscal Year 2014–2015
Liard First Nation – 2-Mile Piped Water Distribution Construction (Phase 1)
Liard First Nation is located partially within the municipal boundaries of Watson Lake in the south eastern corner of the Territory. The on-reserve population is 1,191. A new water treatment plant is located within the 2-Mile community of Liard First Nation. Operating since February 2013, the plant supplies potable water which includes treatment for iron and manganese removal. Currently, Liard First Nation provides water services to the community at large (153 houses and 11 community buildings) in one of three ways: from the water treatment plant via truck delivery; from individual water wells; or from one of the two "cluster well" systems located in each of the two cul-de-sacs in the 2-Mile community. The two cluster well water systems are the only remaining high risk systems in the region.
Liard First Nation will be receiving funding for a 4 phase project that will provide a piped water distribution system to the 2-Mile community. Initial project cost estimates over the 4 phases are approximately $7.3 million in total. The first phase of the project, with a total estimated cost of $750,000, will address the two high risk "cluster well". Phase 1 is expected to be completed in the fall of 2014.
Taku River Tlingit First Nation – Small House Project
Taku River Tlingit First Nation is located 182 km south of Whitehorse on Atlin Lake. The on-reserve population is 398. The First Nation is currently running a Small House Project that will provide community members with small sustainable housing. This project will include a training component focusing equally on education, employment and wellness. Twelve students from the community will be enrolled in a 1st year carpentry apprenticeship program sponsored by the Yukon Carpenters Union and will be acquiring hours towards writing their first year exams. Days will be split between classroom learning and the construction site. Five small houses (under 400 square feet) will be constructed by the students, addressing the current demand for single and double occupancy homes within the community.
AANDC Yukon region will provide $204,120 to Taku River Tlingit First Nation for the purchase of equipment and materials. In addition to the funding provided by AANDC, the First Nation was able to leverage over $350,000 in funding from other sources.
| Project Category | Previous Year (Planned Amount) |
Planned Spending | ||||
|---|---|---|---|---|---|---|
| 2014-2015 | 2015-2016 | 2016-2017 | 2017-2018 | 2018-2019 | ||
| The dashes above indicate that planned funding in this category has yet to be determined. Funding levels may only be known just prior to the commencement of the fiscal year in question. *Community Infrastructure category includes various asset classes such as Roads & Bridges, Electrification, Connectivity, Solid Waste, Fuel Tanks, and others. |
||||||
| Proposal Based Capital Projects | ||||||
| Community Infrastructure | 118,030 | 507,440 | 2,320,440 | 7,440 | 7,440 | 7,440 |
| Contaminated Sites | - | - | - | - | - | - |
| Education Facilities | 30,000 | - | - | - | - | - |
| Housing | - | 200,000 | 200,000 | 256,417 | 200,000 | 200,000 |
| Water and Sewer | 1,986,800 | 2,791,525 | 2,658,300 | 1,158,300 | 1,158,300 | 1,158,300 |
| Sub-Total (Proposal) | $2,134,830 | $3,498,965 | $5,178,740 | $1,422,157 | $1,365,740 | $1,365,740 |
| Formula Based Capital | ||||||
| Community Infrastructure | 1,063,743 | 928,858 | 921,155 | 997,155 | 899,289 | 746,155 |
| Contaminated Sites | - | - | - | - | - | - |
| Education Facilities | - | - | - | - | - | - |
| Housing | 1,710,267 | 1,752,308 | 1,459,597 | 1,558,180 | 1,786,463 | 1,889,597 |
| Water and Sewer | - | 191,052 | 213,133 | 212,133 | 188,133 | 188,133 |
| Sub-Total (Formula) | $2,774,010 | $2,872,218 | $2,593,885 | $2,767,468 | $2,873,885 | $2,823,885 |
| Operations and Maintenance | ||||||
| Community Infrastructure | 1,617,098 | 1,397,008 | 1,376,015 | 1,395,546 | 1,415,465 | 1,435,424 |
| Contaminated Sites | - | - | - | - | - | - |
| Education Facilities | - | 4,775 | 30,000 | 30,000 | 30,000 | 30,000 |
| Housing | - | - | - | - | - | - |
| Water and Sewer | 1,933,646 | 1,466,293 | 1,384,519 | 963,111 | 980,031 | 999,332 |
| Sub-Total (Formula) | $3,550,744 | $2,868,076 | $2,790,534 | $2,388,657 | $2,425,496 | $2,464,756 |
| Grand Total | ||||||
| Community Infrastructure | 2,798,871 | 2,833,306 | 4,617,610 | 2,400,141 | 2,322,194 | 2,189,019 |
| Contaminated Sites | - | - | - | - | - | - |
| Education Facilities | 30,000 | 4,775 | 30,000 | 30,000 | 30,000 | 30,000 |
| Housing | 1,710,267 | 1,952,308 | 1,659,597 | 1,814,597 | 1,986,463 | 2,089,597 |
| Water and Sewer | 3,920,446 | 4,448,870 | 4,255,952 | 2,333,544 | 2,326,464 | 2,345,765 |
| Grand Total | $8,459,584 | $9,239,259 | $10,563,159 | $6,578,282 | $6,665,121 | $6,654,381 |
Glossary of Acronyms and Terms
Acronyms
| Acronym | In Full |
|---|---|
| AANDC | Aboriginal Affairs and Northern Development Canada |
| ACRS | Asset Condition Reporting System |
| BCF | Building Canada Fund |
| CFMP | Capital Facilities and Maintenance Program |
| CRTP | Circuit Rider Training Program |
| CSMP | Contaminated Sites Management Program |
| EAP | Economic Action Plan |
| FCSAP | Federal Contaminated Sites Action Plan |
| FNIF | First Nation Infrastructure Fund |
| FNIIP | First Nations Infrastructure Investment Plan |
| FNWWAP | First Nations Water and Wastewater Action Plan |
| GTF | Gas Tax Fund |
| MCF | Management Control Framework |
| NPRF | National Priority Ranking Framework |
| PAA | Program Activity Architecture |
Terms
| Term | Definition |
|---|---|
| A-Base or Base Budget | A recurring set of funds provided to a department at the onset of each budget period. The base budget is used to keep the department functioning, and is derived from the previous year's spending and adjustments such as inflation. It is not designed to fund special projects. |
| Main Estimates | Provide a breakdown, by department and program, of planned government spending for the upcoming fiscal year. The estimates are expressed as a series of "votes", or resolutions, which summarize the estimated financial requirements in a particular expenditure category, such as operations, capital or grants. |
| Major Capital | Funding allocated for specific proposal-driven construction, acquisition, renovation or significant repair projects valued above $1.5 million. |
| Minor Capital | Can either be formula-based or proposal-driven funding. This funding is typically allocated for on reserve housing and for construction, acquisition, renovation and/or repair projects of community infrastructure valued below $1.5 million. |
| Operations and Maintenance (O&M) | Formula-based funding specifically allocated for the on-going operation and maintenance of community Infrastructure assets as well as First Nation Training. |
| Statutory | These are expenditures provided for on an ongoing basis by way of legislation other than the Appropriation Act and cannot be altered by the House of Commons during its consideration of the Estimates. |
| Supplementary Estimates | Present information to Parliament on the Government of Canada's spending requirements that were not sufficiently developed in time for inclusion in the Main Estimates, and will from time to time include urgent but unforeseen expenditures, such as natural disasters. They are published throughout the year; each release is identified alphabetically (A, B, C, etc.). |
| Targeted Funding | New financial resources provided by the federal government to a department to be spent on specified areas; in most cases, this funding is time limited. |
| Vote | Refers to the amount of funding approved by Parliament through the annual Appropriation Act. This provides government departments or agencies with the authority required to spend money for a specific purpose. Each budgetary item, or vote, has two essential components: an amount of money and a destination (a description of what the money will be used for). |
| Vote 1 | (Operating Budget) Includes expenditures such as: salaries, contracts, staff training, travel, stationery, printing, departmental accommodation, etc. |
| Vote 10 | (Grants and Contributions) also called Transfer Payments, the means by which AANDC funds the operations of First Nations and other recipients. |