National Assessment of First Nations Water and Wastewater Systems - Atlantic Regional Roll-Up Report
Prepared by: Neegan Burnside Ltd.
Prepared for: Department of Indian and Northern Affairs Canada
Date: January 2011
File No: FGY163080.4
PDF Version (2.9 Mb, 97 Pages)
Statement of Qualifications and Limitations for Regional Roll-Up Reports
This regional roll-up report has been prepared by Neegan Burnside Ltd. and a team of subconsultants (Consultant) for the benefit of Indian and Northern Affairs Canada (Client). Regional summary reports have been prepared for the 8 regions, to facilitate planning and budgeting on both a regional and national level to address water and wastewater system deficiencies and needs.
The material contained in this Regional Roll-Up report is:
- preliminary in nature, to allow for high level budgetary and risk planning to be completed by the Client on a national level.
- based on a compilation of the data and findings from the individual community reports prepared and issued for a specific region.
- not proposing to identify the preferred solution to address deficiencies for each community. Rather this report will identify possible solution(s) and probable preliminary costs associated with solution(s) presented in greater detail in the community reports. Community specific studies including more detailed evaluation will be required to identify both preferred solutions and final costs.
- based on existing conditions observed by, or reported to the Consultant. This assessment does not wholly eliminate uncertainty regarding the potential for costs, hazards or losses in connection with a facility. Conditions existing but not recorded were not apparent given the level of study undertaken.
- to be read in the context of its entirety.
- not to be used for any purpose other than that agreed to with the Client. Any use which a third party makes of this report, or any reliance on or decisions to be made based on it, are the responsibility of such third parties. Any other user specifically denies any right to claims against the Consultant, Sub-Consultants, their Officers, Agents and Employees.
Risk as it pertains to health and safety issues and building code compliance is based upon hazards readily identifiable during a simple walk through of the water and wastewater facilities, and does not constitute a comprehensive assessment with regard to health and safety regulations and or building code regulations.
The Consultant accepts no responsibility for any decisions made or actions taken as a result of this report.
Table of contents
1.0 Introduction
The Government of Canada is committed to providing safe, clean drinking water in all First Nations communities, and to ensuring that wastewater services in all First Nations communities meet acceptable effluent quality standards. As part of this commitment, the Government announced the First Nations Water and Wastewater Action Plan (FNWWAP). The plan funds the construction and renovation of water and wastewater facilities, operator training, and public health activities related to water and wastewater on reserves. It also provided for a national, independent assessment – The National Assessment of First Nations Water and Wastewater Systems – which will inform the Government's future, long-term investment strategy. This assessment was also recommended by the Senate Standing Committee on Aboriginal Peoples.
The purpose of the National Assessment is to define the current deficiencies and the operational needs of water and wastewater systems, identify the long-term water and wastewater needs of each community and recommend sustainable, long-term infrastructure development strategies.
The objectives of the National Assessment are to:
- Identify which upgrades will be required for existing public systems to meet INAC's Level of Service Standards; INAC's Protocol for Safe Drinking Water in First Nations Communities; INAC's Protocol for Wastewater Treatment and Disposal in First Nations Communities; and applicable provincial regulations, codes, and standards
- Complete the Annual Inspection, Risk Assessment and Asset Condition Reporting Systems (ACRS) assessment for water and wastewater assets
- Conduct an overall community serviceability assessment of private, on-site communal and/or central systems
- Prepare Class "D" cost estimates for each of the communities visited. Class "D" estimates are preliminary, and are based on available site information. They indicate the approximate magnitude of the cost of the recommended actions, and they may be used to develop long-term capital plans. In addition, these estimates may be used in preliminary discussions of proposed capital projects.
This assessment involved collecting background data and information about each community, undertaking a site visit, and preparing individual community reports for each participating First Nation. The assessment was conducted for each of the eight regions. This report summarizes the findings for the Atlantic Region.
1.1 Site Visits
Site visits in the Atlantic Region were undertaken by personnel from Neegan Burnside Ltd. and sub-consultants, R.J. Burnside & Associates Limited and XCG Consultants Ltd. during September and October of 2009 and May, June and July of 2010. Each visit included at least two team members. In addition to the consultant staff, additional participants including the Circuit Rider Trainer (CRT), INAC Representative, Environmental Health Officer (EHO) from Health Canada and Tribal Council Representative were invited to attend the site visits. The additional participants that were able to attend are identified in each community report.
After confirming the various components that the First Nation uses to provide water and wastewater services to the community (i.e. number and types of systems, piping, individual systems, etc.) along with population and future servicing needs (planned development and population growth), an assessment was carried out of the water and wastewater systems, as well as 5% of the individual systems.>
1.2 Reporting
Individual Community Reports have been prepared for each First Nation. In cases where the First Nation consisted of more than one community located in geographically distinct areas, a separate report was prepared for each community. In the Atlantic Region, there was 100% participation from the 33 First Nations, which resulted in the preparation of 35 individual community reports. Figure 1.1 indicates the location of each First Nation visited as a part of this study.
The reports include an assessment of existing communal and individual systems, identification of required upgrades to meet Departmental, Federal and Provincial protocols and guidelines, and an assessment of existing servicing of the community along with projections of population and water and wastewater flows for future servicing for the 10 year period. Each report includes the projected costs for the recommendations to meet departmental protocol, federal and provincial guidelines, and an evaluation of servicing alternatives along with life cycle costing for each feasible alternative.
The appendices of each report also include an annual water inspection, a risk evaluation, and an Asset Condition Reporting System inspection for each system.

Description of Figure 1.1 - Atlantic First Nations Visited
This image is a map of the location of each First Nation community that Neegan Burnside Ltd. visited in Atlantic Canada as part of the National Assessment. It includes New Brunswick, Nova Scotia, Newfoundland and Labrador, and P.E.I. Each site visit is marked by a green dot.
2.0 Regional Overview
The Atlantic region includes 33 First Nations in four provinces: 15 First Nations are in New Brunswick, 13 are in Nova Scotia, 2 are in Prince Edward Island, and 3 are in Newfoundland and Labrador. There are 35 water systems, including 26 First Nations and 9 Municipal Type Agreements. There are 28 wastewater systems, including 19 First Nations and 9 Municipal Type Agreements.
A water or wastewater system considered a First Nation system, consists of INAC funded assets, and serves five or more residences or public facilities. A Municipal Type Agreement (MTA), on the other hand, is when First Nations are supplied with treated water from or send their wastewater to a nearby municipality or neighbouring First Nation or corporate entity as outlined in a formal agreement between the two parties.
The First Nation communities' population ranges from 35 to 3,700 people, and household sizes range from 1.6 to 6.0 people per unit (ppu). The total number of homes is 6,838, and the average household size in the Atlantic region is 3.5 ppu.
2.1 Water Servicing
There are a total of 35 water systems serving 31 of the 33 First Nations communities. The remaining two First Nations are serviced solely by individual wells. Of the 31 First Nations with water systems, 9 receive their water supply through a Municipal Type Agreement (MTA). The remaining 22 First Nations are serviced by 26 water systems, including 20 groundwater systems, 3 GUDI (groundwater under the direct influence of surface water) water systems, and 3 surface water systems.
For water distribution, 94% of the homes (6,415) are piped and 6% (423) are serviced by individual wells. None of the communities within the Atlantic region rely on truck haul for the distribution of potable water. The majority of the homes serviced by individual wells are located within two communities.
Table 2.1, below, provides an overview of the water systems by system classification, source type, treatment type and storage type.
In general, the treatment system classification reflects the complexity of the treatment. Those labeled as "Small System" and "None" represent groundwater systems with disinfection only. The system classification follows the regulations of the appropriate province; the classification definitions for small systems are not the same for every province within the Atlantic region. The distribution classification depends on the population serviced.
Table 2.1 - Water Overview
| System Classification | No. | % of Total |
|---|---|---|
| None | 18 | 51% |
| Small System | 1 | 3% |
| Level I | 2 | 6% |
| Level II | 5 | 14% |
| MTA | 9 | 26% |
| Source Type | No. | % of Total |
|---|---|---|
| Groundwater | 20 | 56% |
| Surface Water | 3 | 9% |
| Groundwater GUDI | 3 | 9% |
| MTA | 9 | 26% |
| Storage | No. | % of Total |
|---|---|---|
| None | 15 | 43% |
| Elevated | 5 | 14% |
| Standpipe | 5 | 14% |
| Grade level | 4 | 11% |
| Underground | 6 | 18% |
| Treatment Type | No. | % of Total |
|---|---|---|
| None - Direct Use | 2 | 6% |
| Disinfection Only | 16 | 45% |
| Greensand Filtration | 4 | 11% |
| Conventional | 1 | 3% |
| Slow Sand | 1 | 3% |
| Membrane Filtration | 2 | 6% |
| MTA | 9 | 26% |
2.2 Wastewater Servicing
There are a total of 28 wastewater systems that serve 26 of the 33 First Nations. The remaining 7 First Nations are serviced solely by individual septics. Of the 26 First Nations with wastewater systems, 9 are connected to a nearby municipality, which receives and treats the wastewater from the First Nation under a Municipal Type Agreement. The remaining 17 First Nations are serviced by 19 wastewater systems: 13 systems use either facultative or aerated lagoons, 5 systems use a mechanical plant, and 1 system uses a communal septic system.
For wastewater collection, 90% of the homes (6,132) are piped and 10% (703) are serviced by individual systems. A total of three homes rely on truck haul for sewage collection.
The following table provides an overview of the wastewater systems by system classification and treatment type.
Table 2.2 - Wastewater Overview
| System Classification | No. | % of Total |
|---|---|---|
| Small System | 1 | 4% |
| Level I | 10 | 35% |
| Level II | 7 | 25% |
| Level III | 1 | 4% |
| MTA | 9 | 32% |
| Treatment Type | No. | % of Total |
|---|---|---|
| Aerated Lagoon | 7 | 25% |
| Facultative Lagoon | 6 | 21% |
| Mechanical Treatment | 5 | 18% |
| MTA | 9 | 32% |
| Septic System | 1 | 4% |
3.0 Preliminary Results and Trends
3.1 Per Capita Consumption and Plant Capacity
For the 10 communal water systems that provided historical flow data, the average per capita demand ranged from 159 L/p/d to 753 L/p/d, with an average per capita demand of approximately 290 L/p/d. Footnote 1
Historical flow records for water systems were not available for the nine First Nations serviced by a Municipal Type Agreement or for 16 of the First Nations with communal water systems. For these First Nations, an average per capita flow rate of 325 L/p/d was used to evaluate the water systems.
The distribution of per capita flow is outlined in Table 3.1. The distribution includes the 25 systems with an assumed per capita demand of 325 L/p/d.
| No. of systems 2009 | |
|---|---|
| Less than 250 L/c/d | 1 |
| 250 L/c/d to 375 L/c/d | 32 |
| Greater than 375 L/c/d | 2 |
Historical flow data for wastewater was not available for most of the sewage systems. Therefore, to evaluate the ability of the existing infrastructure to meet the current and projected need, the average daily flow was calculated based on the actual or assumed per capita water consumption, plus an infiltration allowance of 90 L/p/d.
The following figure provides a summary of the water and wastewater treatment capacities for the 33 First Nations:
- over capacity: The existing system is unable to meet the current needs
- at capacity: The existing system is able to meet the current needs
- available capacity: The existing system has sufficient capacity to meet more than the current needs
- not enough data: There is insufficient data to determine the actual system capacity.

Description of Figure 3.1 – Water and Wastewater Treatment Capacities
This graph illustrates the treatment capacities of water and wastewater systems for the 33 First Nations in the Atlantic region.
Water System Treatment Capacities
- 7 water systems are operating over their estimated capacities, which represents 20 percent of the total number of water systems.
- 2 water systems are operating at their estimated capacities, which represents 5.71 percent of the total number of water systems.
- 25 water systems have available capacity, which represents approximately 71.43 percent of the total number of water systems.
- There is not enough data to assess the capacity of 1 of the water systems, which represents almost 3% of the total number of water systems.
Wastewater Treatment Capacities
- 3 wastewater systems are operating over their estimated capacities, which represents 10.71 percent of the total number of systems.
- 10 wastewater systems have available capacity, which represents 35.71 percent of the total number of systems.
- There is not enough data to assess the capacities of 15 of the wastewater systems, which represents 53.57 percent of the total number of systems.
The data collected shows that 9 water systems and 3 wastewater systems are operating at or beyond their estimated capacities. For the plants identified as over capacity, the per capita demand is within typical values for the region, according to available records.
3.2 Distribution and Collection
The household size for the 33 First Nations ranges from 1.6 to 6.0 people per unit (ppu), with an average size of 3.5 people per unit. Footnote 2 The total number of piped connections in the region is 6,415 for water and 6,132 for wastewater. The average length per connection of watermain is approximately 33 m while average length per connection of sewer main is 26 m.
For communities with a population over approximately 1,200 people, the average length per connection is 30 m, while communities with less than 1,200 people have an average length per connection ranging between 15 m and 130 m for water, and 15 m to 100 m for wastewater. In some cases, the average length includes dedicated transmission main lengths with no service connections and non-distribution mains (i.e. intake pipes, raw water pipes). As a result, the average length per connection in these cases would be inflated, particularly for smaller communities where the additional pipe length is spread over a smaller number of connections.
The table below indicates the number of water and wastewater systems that have pipe lengths above and below 30 m/connection. It should be noted that this information was not available for all of the systems.
| Watermain | Sewer | |
|---|---|---|
| Average m/connection | 33 | 26 |
| No. of systems with pipe lengths above 30 m/connection | 21 | 9 |
| No. of systems with pipe lengths below 30 m/connection | 13 | 17 |

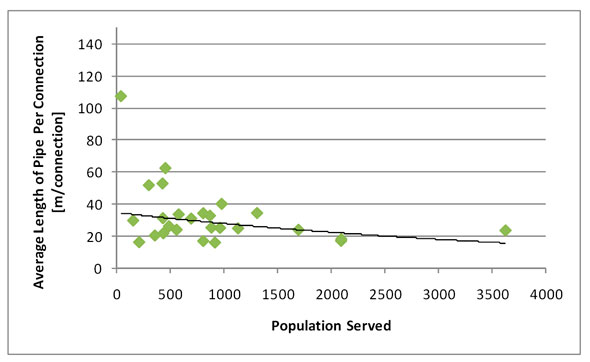
Description of Figure 3.2 – Water Distribution – Average Pipe Length per Connection
This scatterplot graph illustrates the relationship between the length per connection of water distribution pipes and the population size of the community that is being served for First Nation communities in the Atlantic region.
For communities with a population over approximately 1,200 people, the average length per connection is 30 meters. Communities with less than 1,200 people have an average length per connection ranging between 15 meters and 130 meters.
The majority of water distribution systems have an average pipe length per connection above 30 meters. The population of most communities is 1000 people or less.
Description of Figure 3.3 – Wastewater Collection – Average Pipe Length per Connection
This figure illustrates the relationship between the average length of pipe per connection for water collection and the population of the community that is being served in First Nations communities in the Atlantic region. For communities with a population over 1,200 people, the average length per connection is 30 meters. For communities with less than 1,200 people, the average length per connection ranges between 15 and 100 meters.
The majority of systems have an average pipe length below 30 meters per connection. Most communities have a population of 1000 people or less.
3.3 Water Risk Evaluation
A risk assessment has been completed for each water system according to the INAC Risk Level Evaluation Guidelines. Each facility is ranked in risk according to the following categories: Water Source, Design, Operation (and Maintenance), Reporting and Operators. The risk levels of all five categories are then used to determine the overall risk for the system.
Each of the five risk categories, as well as the overall risk level of the entire system, is ranked numerically from 1 to 10. Low, medium and high risks are defined as follows:
- Low Risk (1.0 to 4.0): These are systems that operate with minor deficiencies. Low-risk systems usually meet the water quality parameters that are specified by the appropriate Canadian Guidelines for drinking water (in particular, the Guidelines for Canadian Drinking Water Quality (GCDWQ)).
- Medium Risk (4.1 to 7.0): These are systems with deficiencies, which— individually or combined— pose a medium risk to the quality of water and to human health. These systems do not generally require immediate action, but the deficiencies should be corrected to avoid future problems.
- High Risk (7.1 to 10.0): These are systems with major deficiencies, which— individually or combined— pose a high risk to the quality of water. These deficiencies may lead to potential health and safety or environmental concerns. They could also result in water quality advisories against drinking the water (such as, but not limited to, boil water advisories), repetitive non-compliance with guidelines, and inadequate water supplies. Once systems are classified under this category, regions and First Nations must take immediate corrective action to minimize or eliminate deficiencies.
Regional Risk Summary:
Of the 35 water systems inspected:
- 6 are categorized as high overall risk
- 19 are categorized as medium overall risk
- 10 are categorized as low overall risk.
The 10 low-risk systems include eight Municipal Type Agreement systems and two groundwater systems.
Neighbouring municipalities operate and maintain seven of the nine Municipal Type Agreement systems. The First Nations operate and maintain the distribution system of the remaining two Municipal Type Agreement systems.
The table in Appendix E.1 summarizes the correlation between component risk and overall risk. In general, Municipal Type Agreement systems have the lowest risk, followed by systems with a groundwater source, a groundwater under the direct influence of surface water (GUDI) source and, finally, systems with a surface water source.
Figure 3.4 provides a geographical representation of the final risk for the water systems that were inspected.
3.3.1 Overall System Risk by Source
The following table summarizes the overall system risk by water source. In general, it is assumed that Municipal Type Agreement systems have low-risk water supplies because the municipalities operate their systems in compliance with provincial legislation. For the Atlantic region, due to the small number of systems, no conclusions could be drawn from this data regarding the relationship between the overall risk and the water source.
| Overall Risk Level | Groundwater | GUDI | Surface Water | MTA | Total |
|---|---|---|---|---|---|
| High | 4 | 1 | 1 | 0 | 6 |
| Medium | 14 | 2 | 2 | 1 | 19 |
| Low | 2 | 0 | 0 | 8 | 10 |
| Total | 20 | 3 | 3 | 9 | 35 |
3.3.2 Overall System Risk by Treatment Classification
The following table summarizes the overall system risk by the classification level of the treatment system. The system classification is based on a number of factors, such as size and complexity of treatment. There is no clear pattern between the system classification level and the overall system risk.
As previously discussed, Municipal Type Agreement systems have a low overall risk.
| Overall Risk Level | None | Small System | Level I | Level II | MTA | Total |
|---|---|---|---|---|---|---|
| High | 3 | 1 | 1 | 1 | 0 | 6 |
| Medium | 13 | 0 | 1 | 4 | 1 | 19 |
| Low | 2 | 0 | 0 | 0 | 8 | 10 |
| Total | 18 | 1 | 2 | 5 | 9 | 35 |

Description of Figure 3.4 – Atlantic Water System Risk
This image provides a map of the location of high-, medium-, and low-risk water systems in First Nations communities in the Atlantic region. High-risk systems are identified with a red dot, medium-risk systems are identified with a yellow dot, and low-risk systems are identified with a green dot.
There is also a pie chart that illustrates the number and percentage of water systems that are high, medium, and low risk.
There are 35 water systems in First Nations communities in the Atlantic region. Of these, 6 systems are high risk, which represents 17 percent of the total number of systems; 19 systems are medium risk, which represents 54 percent of the total number of systems; and 10 systems are low risk, which represents 29 percent of the total number of systems.

Description of Figure 3.5 - Risk Profile Based on Water Treatment System Classification
This graph illustrates the risk profile of water treatment systems in the Atlantic region by the treatment system classification. It illustrates what percentage of each type of system is high, medium and low risk. It also shows the mean overall risk level by the treatment classification.
There are five treatment system classifications:
- None
- Small System
- Level I
- Level II
- MTA
None
- The mean overall risk level for water systems classified as "None" is 5.54.
- 11 percent of the systems classified as None have a low overall risk.
- 72 percent of the systems classified as None have a medium overall risk.
- 17 percent of the systems classified as None have a high overall risk.
Small Systems
- The mean overall risk level for Small Systems is 8.0.
- 100 percent of the Small Systems have a high overall risk.
Level I Systems
- The mean overall risk for Level I Systems is 7.1.
- 50 percent of the Level I systems have a high overall risk.
- 50 percent of the Level I systems have a medium overall risk.
Level II Systems
- The mean overall risk for Level II Systems is 6.18.
- 80 percent of the Level II systems have a medium overall risk.
- 20 percent of the Level II systems have a high overall risk.
MTA (Municipal Type Agreements)
- The mean overall risk for MTA(Municipal Type Agreement) systems is 1.75.
- 89 percent of the MTA (Municipal Type Agreement) systems have a low overall risk.
- 11 percent of the MTA (Municipal Type Agreement) systems have a medium overall risk.
3.3.3 Overall Risk by Number of Connections
For the Atlantic region, systems serving more than 100 connections tend to have a medium overall risk (with one exception), while systems serving less than 100 connections are fairly evenly split between having a medium overall risk and a high overall risk. All, but one, of the Municipal Type Agreement systems are low risk, regardless of the number of connections.
The reasons for the higher risk rating for smaller systems include:
- inadequate treatment of the source water
- untrained operators
- no backup operators
- poor reporting practices.
3.3.4 Component Risks: Water
The overall risk is comprised of five component risks: water source, design, operation, reporting and operator. Each of these component risk factors are discussed below.

Description of Figure 3.6: Water: Risk Profile Based on Risk Components (with MTAs excluded)
This graph illustrates the mean risk score associated with each type of risk component for all water systems in First Nations communities in the Atlantic, except Municipal Type Agreement Systems (MTAs).
- The risk associated with the water source has a mean score of 6.8.
- The risk associated with the design component has a mean score of 5.3.
- The risk associated with the operation component has a mean score of 6.6.
- The risk associated with the reporting component has a mean score of 8.8.
- The risk associated with the operator component has a mean score of 3.2.
| Source | Design | Operation | Reporting | Operator | |
|---|---|---|---|---|---|
| Risk | 6.8 | 5.3 | 6.6 | 8.8 | 3.2 |
| Minimum | 4.0 | 1.0 | 4.0 | 2.0 | 1.0 |
| Maximum | 10.0 | 10.0 | 10.0 | 10.0 | 10.0 |
| Std. Dev. | 2.0 | 2.4 | 1.7 | 2.3 | 3.5 |
3.3.5 Component Risk - Water: Source
The risk associated with the water source has a mean score of 6.8, excluding MTA's. The mean source risk score by type of source is:
- groundwater at 6.0
- ground water under the direct influence of surface water (GUDI) at 9.3
- surface water at 9.0
- Municipal Type Agreement (MTA) at 1.0.
Systems that rely on surface water, or on groundwater under the direct influence (GUDI) of surface water, typically have a higher water-source component risk score than systems that rely on groundwater. The risk formula automatically assigns a higher base risk to these types of systems.
The following figure identifies drivers contributing to water source risk scores.

Description of Figure 3.7 – Source Risk Drivers
This graph identifies the frequency of the main drivers that contribute to water source risk in First Nations communities in the Atlantic region. There are 4 key risk drivers: No Source Water Protection Plan in Place; Deterioration of Water Quality Over Time; Risk of Contamination; and Insufficient Capacity to Meet Future Demands.
- For 85 percent of the systems, there is no Source Water Protection Plan in place.
- For 15 percent of the systems, water quality has deteriorated over time.
- For 54 percent of the systems, there is a risk of contamination.
- For 65 percent of the systems, there is an insufficient capacity to meet future demands.
3.3.6 Component Risk - Water: Design
The risk associated with the design has a mean score of 5.3, excluding MTA's. The mean design risk score by type of source is:
- groundwater at 5.2
- groundwater under the direct influence of surface water (GUDI) at 6.7
- surface water at 4.7
- Municipal Type Agreement (MTA) at 1.8.
The higher design risk for systems with a GUDI source is associated with the relatively recent requirement for GUDI sources to meet treatment levels equivalent to those required for surface water. Prior to this change, the source would have been considered as a groundwater source, and the level of treatment would not meet the minimum level of treatment requirements. The three systems identified as GUDI provide only disinfection and therefore are considered to have a high design risk.
As part of the multi-barrier approach to water treatment, chlorination is now required for all water systems. Typically, a groundwater system has an increased design risk if it has no disinfection systems in place, or if there is insufficient contact time to ensure that the chlorination process is adequate.
There are several key drivers of the region's design risk scores, including:
- failure to meet the Guidelines for Canadian Drinking Water Quality (GCDWQ)
- exceeding the GCDWQ Maximum Acceptable Concentration (MAC) for bacteria
- no disinfection system in place or a disinfection system that is not being used
- no appropriate treatment in place to meet INAC's Protocol requirements
- problems with system reliability
- systems approaching or exceeding design capacity.

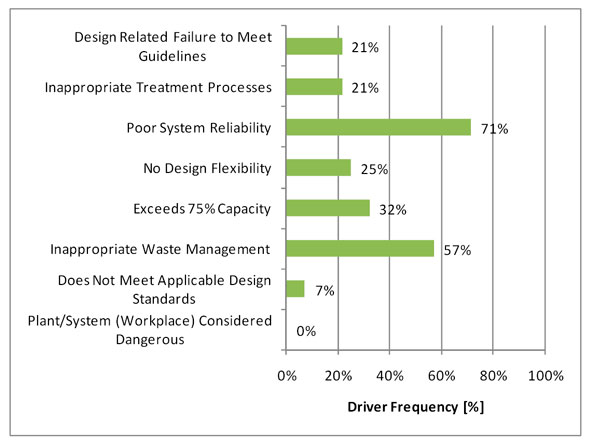
Description of Figure 3.8 – Design Risk Drivers
This graph identifies the frequency of the main drivers that contribute to the design risk for water systems in First Nations communities in the Atlantic region.
There are 8 key risk drivers:
- Failure to Meet Bacteriologial MAC (Maximum Allowable Concentration) due to Design;
- Disinfection System Not in Place;
- Failure to MeetGCDWQ(Guidelines for Canadian Drinking Water Quality) due to Design;
- Inappropriate Treatment Processes;
- Poor System Reliability;
- No Design Flexibility;
- Exceeds 75 percent Capacity; and
- Inappropriate Waste Management.
Risk Drivers are in red and green. The risk drivers in red result in the entire water system being given a high-risk score, regardless of all the other component scores. The Failure to Meet Bacteriological MAC (Maximum Allowable Concentration) is the only risk driver in red. The rest of the risk drivers are in green.
- 4 percent of the water systems failed to meet the bacteriological Maximum Allowable Concentration (MAC) due to the system design. These systems automatically received a high-risk score, regardless of the other component scores.
- 12 percent of the water systems do not have a disinfection system in place.
- 27 percent of the water systems failed to meet the Guidelines for Canadian Drinking Water Quality (GCDWQ) due to the design.
- 31 percent of the water systems have inappropriate treatment processes.
- 31 percent of the water systems have poor system reliability.
- 42 percent of the water systems have no design flexibility.
- 69 percent of the water systems exceed 75 percent of their capacity.
- 15 percent of the water systems have inappropriate waste management.
It should be noted that the design risk drivers in red result in the entire water system being given a high risk score, regardless of all of the other component risk scores.
3.3.7 Component Risk - Water: Operation
The risk associated with operation has a mean score of 6.6, excluding MTA's. The mean operation risk score by type of source is:
- groundwater at 6.6
- groundwater under the direct influence of surface water (GUDI) at 6.7
- surface water at 6.7
- Municipal Type Agreement (MTA) at 2.0.
Areas that increased risk included not maintaining records, not having or not using approved O&M manuals and not scheduling and performing maintenance activities. Increased effort focused on these areas would result in lowering both the component and overall risk scores.
There are several key drivers of the region's operation risk scores, including:
- failure to meet the Guidelines for Canadian Drinking Water Quality (GCDWQ)
- exceeding the GCDWQ Maximum Acceptable Concentration (MAC) for bacteria
- maintenance logs being inadequately maintained
- lack of general system maintenance
- Emergency Response Plan not in place or not in use
- Operation & Maintenance manual not available or not in use.

Description of Figure 3.9 – Operation Risk Drivers
This graph identifies the frequency of the main risk drivers that contribute to the operation risk for water systems in First Nations communities in the Atlantic region.
There are 7 key risk drivers:
- Failure to Meet Bacteriological MAC (Maximum Allowable Concentration) Due to Operations;
- Failure to Meet the Guidelines for Canadian Drinking Water Quality (GCDWQ) Due to Operations;
- Inadequate Operation Logs;
- Inadequate Maintenance Logs;
- Maintenance Not Adequately Performed;
- Emergency Response Plan Not Available for Use; and
- Operation and Maintenance (O & M) Manual Not Available or Not in Use.
Risk Drivers are in red and green. The risk drivers in red result in the entire water system being given a high-risk score, regardless of all the other component scores. Failure to Meet Bacteriological Maximum Allowable Concentration (MAC) due to Operations is the only risk driver in red. The rest of the risk drivers are in green.
- 8 percent of the water systems fail to meet the maximum acceptable concentration (MAC) of bacteria due to operations. These systems automatically received a high-risk score, regardless of all the other component scores.
- 27 percent of the water systems failed to meet the Guidelines for Canadian Drinking Water Quality due to operations.
- 12 percent of the water systems have inadequate operation logs.
- 81 percent of the water systems have inadequate maintenance logs.
- Maintenance is not being adequately performed for 54 percent of the water systems.
- 83 percent of the water systems do not have an Emergency Response Plan available to use.
- For 96 percent of the systems, an Operation & Maintenance (O & M) Manual is not available or not in use.

Description of Figure 3.10 – Summary of Findings: Water Systems Operational Practices
This graph identifies which operational practices are currently being performed, and which operational practices are not being performed, for water systems in First Nations communities in the Atlantic region.
Line Flushing
- 57 percent of the water systems practice line flushing.
- 43 percent of water systems do not practice line flushing.
Line Swabbing
- 100 percent of the water systems do not currently practice line swabbing.
Hydrant Flushing
- 62 percent of the water systems currently practice hydrant flushing.
- 38 percent of the water systems currently do not perform hydrant flushing.
Reservoir Cleaning
- 11 percent of the water systems currently practice reservoir cleaning.
- 89 percent of the water systems do not currently practice reservoir cleaning.
Fire Pump Tests
- 0 percent of the water systems practice fire pump tests.
- 100 percent of the water systems do not practice fire pump tests.
SOPs On site
- 48 percent of the water systems have Standard Operating Procedures (SOPs) on site.
- 52 percent of the water systems do not have Standard Operating Procedures (SOPs) on site.
Maintenance Scheduled and Performed
- 53 percent of the water systems schedule and perform maintenance.
- 47 percent of the water systems do not schedule and perform maintenance.
Repair and Upgrade Records
- 32 percent of the water systems maintain records for repairs and upgrades.
- 68 percent of the water systems do not maintain records for repairs and upgrades.
Operation and Maintenance Efforts Acceptable
- 93 percent of the water systems have acceptable Operation and Maintenance efforts.
- 7 percent of the water systems do not have acceptable Operation and Maintenance efforts.
All Components Working
- All components are working for 77 percent of the systems.
- Not all of the components are working for 23 percent of the systems.
Approximately 57% of the operators practice line and hydrant flushing, however, line swabbing is currently not practiced. Reservoir cleaning and fire pump tests appear not to be undertaken on a regular basis. Records of system repairs and upgrades were available for only 32% of the systems. One or more major components were not working for 23% of the systems.
3.3.8 Component Risk - Water: Reporting
The risk associated with reporting has a mean score of 8.8, excluding MTA's. The risk score of 1.4 for Municipal Type Agreement systems reflects the minimal reporting required for these types of systems. The mean reporting risk score by type of source is:
- groundwater at 9.1
- groundwater under the direct influence of surface water (GUDI) at 10.0
- surface water at 6.3
- Municipal Type Agreement (MTA) at 1.4.
Poor record keeping and inconsistent records are the main risk drivers for all systems (77% and 92%). For systems with a Supervisory Control and Data Acquisition (SCADA) system in place, an additional driver is that the instruments are not being calibrated to ensure that the information being recorded is accurate (31%).
An important consideration is that the systems were evaluated based on the requirements for monitoring and reporting as set out in INAC's Protocol. Typically, the monitoring and reporting being undertaken by the operators does not meet these requirements. Operator awareness and training could have a significant impact on these risk scores.

Description of Figure 3.11 – Reporting Risk Drivers
This graph illustrates the frequency of the main drivers that contribute to reporting risks for water systems in First Nations communities in the Atlantic region.
There are 3 key risk drivers: Inconsistent Records, Supervisory Control and Data Acquisition System (SCADA) not Calibrated and Confirmed Accurate; and Poor Records for Key Parameters.
- For 77 percent of the systems, records are inconsistent.
- For 31 percent of the systems, the Supervisory Control and Data Acquisition System (SCADA) is not calibrated and confirmed to be accurate.
- For 92 percent of the systems, there are poor records for key parameters.
3.3.9 Component Risk - Water: Operator
The risk associated with the operator(s) has a mean score of 3.2, excluding MTA's. It should be noted that a more complicated system (based on treatment classification) requires an operator with a higher level of training. Because systems with higher classifications are less likely to have suitably certified staff, the risk associated with the operator is higher for more complicated systems in the region than for less complicated systems. The mean operator risk score by type of source is:
- groundwater at 2.5
- groundwater under the direct influence of surface water (GUDI) at 4.0
- surface water at 7.0
- Municipal Type Agreement (MTA) at 2.0.
The extent to which existing systems have fully certified primary and backup operators is presented in Table 3.5. Of the 8 systems that require a certified operator for the water treatment system, 63% did not have a fully certified primary operator and 88% did not have a fully certified backup operator. Of the 27 systems that require a certified operator for the distribution system, 41% did not have a fully certified primary operator and 93% did not have a fully certified backup operator.
| Primary Operator | Backup Operator | |||
|---|---|---|---|---|
| Treatment | Distribution | Treatment | Distribution | |
| No. of Systems Currently Without an Operator | 0 | 3 | 2 | 10 |
| ,m,m;n ____________________No. of Systems with Operator with No Certification | 4 | 5 | 5 | 15 |
| No. of Systems with Operator Certified but not to the Required Level of the System | 1 | 3 | 0 | 0 |
| No. of Systems with Operator with Adequate Certification | 3 | 16 | 1 | 2 |
| No. of Systems Not Requiring Operators with Certification | 27 | 8 | 27 | 8 |
| Total No. of Systems | 35 | 35 | 35 | 35 |
Those factors which frequently contribute to increased operator risk are identified in Figure 3.12. A lack of certification, lack of training and the lack of primary or backup operator are common drivers that increase operator risk.

Description of Figure 3.12 – Operator Risk Drivers
This graph illustrates the main drivers that contribute to the operator risk for water systems in First Nations communities in the Atlantic region. There are 5 key risk drivers:
- No Primary Operator and/or Primary Operator Not Certified to the Treatment System Classification;
- Primary Operator Uncertified and/or Insufficient Experience and Training for the Distribution System;
- Primary Operator Not Enrolled in Training;
- No Backup Operator or Backup Operator with No Certification; and
- No Access to Fully Trained Operator.
- For 63 percent of the water systems, there is no primary operator and/or the primary operator is not certified to the level required by the treatment system classification.
- For 30 percent of the water systems, the primary operator is uncertified and/or has insufficient experience and training to operate the distribution system.
- For 62 percent of the water systems, the primary operator is not enrolled in training.
- 88 percent of the water systems have no backup operator or they have a backup operator who has no certification.
- 23 percent of the water systems have no access to a fully trained operator.
3.4 Wastewater Risk Evaluation
A risk assessment was completed for each wastewater system according to INAC's Risk Level Evaluation Guidelines. The risk of each wastewater facility is ranked according to the following categories: effluent receiver, design, operation and maintenance, reporting, and operator. The risk levels of all five categories are used to determine the overall risk for the system. The overall risk score is a weighted average of the component risk scores.
Each of the five risk categories, as well as the overall risk level of the entire system, is ranked numerically from 1 to 10. A risk ranking of 1.0 to 4.0 represents a low risk, a risk ranking of 4.1 to 7.0 represents a medium risk, and a risk ranking of 7.1 to 10.0 represents a high risk.
Of the 28 wastewater systems inspected:
- 7 are categorized as high overall risk
- 12 are categorized as medium overall risk
- 9 systems are categorized as low risk.
All of the low risk systems are Municipal Type Agreements.
Appendix E.2 provides a table that summarizes the correlation between the component risk and the overall risk.
3.4.1 Overall System Risk by Treatment Classification
The following figure demonstrates the correlation between the mean overall system risk and the classification level of the treatment system. For MTA's, it was assumed that the municipality was operating their system in accordance with provincial legislation and therefore resulted in a low risk sewage receiver.
There does not appear to be a correlation between the overall risk and the level of treatment classification in the Atlantic region. Although the treatment complexity increases from "Small System" to "Level III Systems," this increase does not appear to be a driver for the overall system risk.
Figure 3.13 provides a geographical representation of the final risk for the wastewater systems that were inspected.

Description of Figure 3.13 – Atlantic Wastewater System Risk
This image provides a map of the location of high-, medium-, and low-risk wastewater systems in First Nations communities in the Atlantic region. High-risk systems are identified with a red dot, medium-risk systems are identified with a yellow dot, and low-risk systems are identified with a green dot.
The map also includes a pie chart that illustrates the number and percentage of high-, medium-, and low-risk systems in First Nations communities in the Atlantic region.
- There are 28 wastewater systems in the Atlantic region.
- There are 7 high-risk wastewater systems, which represents 25 percent of the total number of wastewater systems.
- There are 12 medium-risk wastewater systems, which represents 43 percent of the total number of wastewater systems.
- There are 9 low-risk wastewater systems, which represents 32 percent of the total number of wastewater systems.

Description of Figure 3.14 – Risk Profile Based on Wastewater Treatment System Classification
This graph illustrates the relationship between the mean overall system risk and the treatment system classification level for wastewater systems in First Nations communities in the Atlantic region. It also illustrates the percentage of low, medium, and high overall risk scores by system type.
Small Systems
- The mean overall wastewater system risk for Small Systems is 6.1.
- 100 percent of Small Systems have a medium overall risk.
Level I Systems
- The mean overall wastewater system risk for Level I Systems is 6.99.
- 60 percent of Level I systems have a medium overall risk, and 40 percent of Level I systems have a high overall risk.
Level II Systems
- The mean overall wastewater system risk for Level II Systems is 6.63.
- 71 percent of Level II Systems have a medium overall risk, and 29 percent of Level II Systems have a high overall risk.
Level III Systems
- The mean overall wastewater system risk for Level III Systems is 7.1.
- 100 percent of Level III Systems have a high overall risk.
MTA(Municipal Type Agreement) Systems
- The mean overall wastewater system risk for MTA (Municipal Type Agreement systems is 1.91.
- 100 percent of MTA systems have a low overall risk.
3.4.2 Overall System Risk by Number of Connections
For the Atlantic region, excluding Municipal Type Agreements, there is no clear pattern between the overall system risk and the number of connections.
3.4.3 Component Risks: Wastewater
The overall risk is comprised of five component risks: effluent receiver, design, operation, reporting and operators. Each of these component risk factors is discussed below. Municipal Type Agreements are excluded from the component risk sections because they are all low-risk systems.

Description of Figure 3.15 – Wastewater: Mean Risk Scores by Risk Component (Excluding MTAs)
The graph shows the mean risk score for all wastewater systems, excluding Municipal Type Agreements (MTAs), by the type of risk component, in First Nations communities in the Atlantic region.
- The risk associated with the effluent has a mean score of 6.1.
- The risk associated with the design has a mean score of 5.5.
- The risk associated with the operation has a mean score of 7.6.
- The risk associated with the reporting has a mean score of 9.2.
- The risk associated with the operator has a mean score of 6.8.
| Effluent | Design | Operation | Reporting | Operator | |
|---|---|---|---|---|---|
| Risk | 6.1 | 5.5 | 7.6 | 9.2 | 6.8 |
| Minimum | 2.0 | 2.0 | 5.0 | 1.0 | 1.0 |
| Maximum | 10.0 | 8.0 | 10.0 | 10.0 | 10.0 |
| Std. Dev. | 2.4 | 2.1 | 1.9 | 2.4 | 3.3 |
3.4.4 Component Risk - Wastewater: Effluent Receiver
The effluent receiver has a mean risk score of 6.1 excluding MTA's, and a fairly even distribution of the risk scores.
There are two key drivers of this risk component:
- the receiving environment
- the extent to which the receiver is required for other human uses, such as fishing, recreation, or drinking water.

Description of Figure 3.16 – Effluent Receiver Risk Drivers
This graph illustrates the frequency of the main drivers that contribute to the effluent risk for wastewater systems in First Nations communities in the Atlantic region, excluding Municipal Type Agreement systems (MTAs). There are four key risk drivers:
- High-Risk Effluent Receiver;
- Possible Species at Risk in the Receiving Environment;
- Nearby Human Use of the Receiving Environment; and
- Receiving Environment is a Sensitive Area.
- 39 percent of the wastewater systems have a high-risk effluent receiver.
- 7 percent of the wastewater systems possibly have species at risk in the receiving environment.
- There is human use nearby the receiving environment for 46 percent of the wastewater systems.
- 0 percent of the wastewater systems have a receiving environment that is a sensitive area.
3.4.5 Component Risk - Wastewater: Design
The risk associated with design has a mean score of 5.5 excluding MTA's. The design component risk has the lowest mean component score. When systems with Municipal Type Agreements are excluded, the remaining systems were evenly split between high, medium and low, design component risk. In addition, two thirds of the overall high-risk systems also have a high design risk.
There are several key drivers of the design component risk scores in the region, including:
- failure to meet Federal Effluent Quality Guidelines
- inappropriate treatment processes
- poor system reliability
- inappropriate waste management.
Description of Figure 3.17 – Design Risk Drivers
This graph illustrates the frequency of the main drivers that contribute to design risk for wastewater systems in First Nations communities in the Atlantic region, excluding Municipal Type Agreements (MTAs).
There are eight key drivers that contribute to design risk:
- Design-Related Failure to meet the Guidelines
- Inappropriate Treatment Processes
- Poor System Reliability
- No Design Flexibility
- Exceeding 75 percent of Capacity
- Inappropriate Waste Management
- Not Meeting Applicable Design Standards
- Plant/System (Workplace) Considered Dangerous.
- 21 percent of the wastewater systems failed to meet the guidelines because of a design-related failure.
- 21 percent of the wastewater systems have inappropriate treatment processes.
- 71 percent of the wastewater systems have poor system reliability.
- 25 percent of the wastewater systems have no design flexibility.
- 32 percent of the wastewater systems exceed 75 percent of the system capacity.
- 57 percent of the wastewater systems have inappropriate waste management.
- 7 percent of the wastewater systems do not meet applicable design standards.
- 0 percent of the plants/systems are considered to be dangerous workplaces.
3.4.6 Component Risk - Wastewater: Operation
The risk associated with the operation has a mean score of 7.6 excluding MTA's. All of the wastewater systems have a medium- or high-risk score. This is identified as an area of opportunity for increased risk mitigation efforts.
There are several key drivers of the operation risk in the region, including:
- failure to meet Federal Effluent Guidelines
- inadequate maintenance logs
- lack of general system maintenance
- Emergency Response Plans not in place or not being used
- Operations & Maintenance manuals not available or not being used.

Description of Figure 3.18 – Operation Risk Drivers
This graph identifies the frequency of the main risk drivers that contribute to the operation risk for wastewater systems in First Nations communities in the Atlantic region, excluding Municipal Type Agreement Systems (MTAs).
There are five key risk drivers:
- Failure to Meet Federal Effluent Quality Guidelines Due to Operations;
- Inadequate Maintenance Logs;
- Maintenance Not Adequately Performed;
- Emergency Response Plan Not Available or Not in Place; and
- Operation and Maintenance (O & M) Manual Not Available or Not in Use.
- 18 percent of the wastewater systems failed to meet Federal Effluent Quality Guidelines due to operations.
- 71 percent of the wastewater systems have maintenance logs that are inadequate.
- For 46 percent of the systems, maintenance is not being adequately performed.
- For 82 percent of the systems, an Emergency Response Plan is not available or not in place.
- For 71 percent of the systems, an Operation and Maintenance manual is not available or is not in use.
3.4.7 Component Risk - Wastewater: Reporting
The risk associated with reporting has a mean score of 9.2 excluding MTA's. The reporting risk component assesses whether operators maintain effluent-testing and system-monitoring records. Poor record keeping is a significant factor in raising the overall risk ranking for many communities in this region.
There are several key drivers of the reporting risk in the region, including:
- inconsistent record keeping
- inconsistent records for key parameters
- instruments not being calibrated.

Description of Figure 3.19 – Reporting Risk Drivers
This graph illustrates the frequency of the main risk drivers that contribute to the reporting risk for wastewater in First Nations communities in the Atlantic region, excluding Municipal Type Agreement Systems (MTAs). There are three key reporting risk drivers:
- Inconsistent Records;
- Poor Records for Key Parameters; and
- Supervisory Control and Data Acquisition (SCADA) System not Calibrated and Confirmed Accurate.
- 64 percent of the wastewater systems have inconsistent records.
- There are poor records for key parameters for 64 percent of the wastewater systems.
- For 11 percent of the wastewater systems, the Supervisory Control and Data Acquisition (SCADA) System has not been calibrated and confirmed to be accurate.
3.4.8 Component Risk - Wastewater: Operator
The risk associated with the operator has a mean score 6.8 excluding MTA's. Operator risk is determined by whether or not the operators have adequate certification.
The extent to which existing wastewater systems have fully certified primary and backup operators is presented in Table 3.6. Of the 19 systems which require a certified operator for the wastewater treatment system, 74% did not have a fully certified primary operator and 100% did not have a fully certified backup operator. Of the 22 systems which require a certified operator for the collection system, 82% did not have a fully certified primary operator and 100% did not have a fully certified backup operator.
| Primary Operator | Backup Operator | |||
|---|---|---|---|---|
| Treatment | Collection | Treatment | Collection | |
| No. of Systems Currently Without an Operator | 0 | 0 | 7 | 9 |
| No. of Systems with Operator with No Certification | 14 | 18 | 11 | 13 |
| No. of Systems with Operator Certified but not to the Required Level of the System | 0 | 0 | 1 | 0 |
| No. of Systems with Operator with Adequate Certification | 5 | 4 | 0 | 0 |
| No. of Systems Not Requiring Operators with Certification | 9 | 6 | 9 | 6 |
| Total No. of Systems | 28 | 28 | 28 | 28 |
Those factors which frequently contribute to increased wastewater operator risk are identified in Figure 3.20. A lack of certification, lack of training and the lack of primary or backup operator are common drivers that increase operator risk.
Description of Figure 3.20 – Operator Risk Drivers
This graph identifies the main risk drivers that contribute to the operation risk for wastewater in First Nations communities, excluding Municipal Type Agreement Systems (MTAs).
There are five key risk drivers:
- No Primary Operator and/or Primary Operator Not Certified to the Treatment System Classification;
- Primary Operator Uncertified and/or has Insufficient Experience/Training for the Collection System;
- Primary Operator Not Enrolled in Training;
- No Backup Operator and/or Backup Operator Not Certified to Treatment System Classification; and
- No Access to Fully Trained Operator.
- 74 percent of the wastewater systems have no primary operator and/or the primary operator is not certified to the treatment system classification.
- 82 percent of the wastewater systems have a primary operator who is uncertified and/or who has insufficient experience or training for the collection system.
- 82 percent of the wastewater systems have a primary operator who is not enrolled in training.
- 95 percent of the wastewater systems have no backup operator and/or the backup operator is not certified to the treatment system classification.
- 25 percent of the wastewater systems have no access to a fully trained operator.
3.5 Plans
Information was collected regarding the availability of various documents, including Source Water Protection Plans (SWPP), Maintenance Management Plans (MMP), and Emergency Response Plans (ERP).
The following tables provide a summary of the percentages of First Nations that have plans in place:
| Source | Percentage of Water Systems that have a (an)... | ||
|---|---|---|---|
| Source Water Protection Plan | Maintenance Management Plan | Emergency Response Plan | |
| Groundwater | 15% | 0% | 15% |
| Groundwater GUDI | 0% | 0% | 0% |
| MTA | N/A | 11% | 22% |
| Surface Water | 33% | 0% | 33% |
| Overall | 15% | 3% | 17% |
| Percentage of Wastewater Systems that have a (an)… | |
|---|---|
| Maintenance Management Plan | Emergency Response Plan |
| 4% | 18% |
3.5.1 Source Water Protection Plans
Source water protection planning is one component of a multi-barrier approach to providing safe drinking water. Source Water Protection Plans seek to identify threats to the water source. They also establish policies and practices to prevent contamination of the water source and to ensure that the water service provider is equipped to take corrective action in the event of water contamination. Source water protection is appropriate for groundwater and surface water sources.
Only 15% of the water systems inspected have a Source Water Protection Plan in place.
3.5.2 Maintenance Management Plans
Maintenance Management Plans are intended to improve the effectiveness of maintenance activities. MMP's focus on planning, scheduling and documenting preventative maintenance activities and unscheduled maintenance efforts to be documented by the operator(s). The plans represent a change from reactive to proactive thinking, and—when executed properly—help the operator optimize maintenance spending, minimize service disruption, and extend asset life.
Only 3% of the water systems and 4% of the wastewater systems have completed a Maintenance Management Plan in place.
3.5.3 Emergency Response Plans
Emergency Response Plans (ERPs) are intended to be a quick reference to assist operators and other stakeholders in managing and in responding to emergency situations. Emergency Response Plans should be in place for both water and wastewater systems. They include key contact information for those who should be notified and who may be of assistance in case of emergency (agencies, contractors, suppliers, etc.), and they provide standard communication and response protocols. Emergency Response Plans identify recommended corrective actions for "foreseeable" emergencies, and they establish methodologies for addressing unforeseen situations. They are essentially the last potential "barrier" in a multi-barrier approach to protecting the drinking water supply and the natural environment, and they provide the last opportunity to mitigate damages.
17% of the water systems and 18% of the wastewater systems have an Emergency Response Plan in place.
4.0 Cost Analysis
4.1 Upgrades to Meet INAC Protocols: Water
In 2006, INAC began to develop a series of Protocol documents for centralised and decentralised water and wastewater systems in First Nations communities. The Protocols contain standards for the design, construction, operation, maintenance, and monitoring of these systems.
One of the objectives of this study was to review the existing water and wastewater infrastructure and to identify the potential upgrade costs to meet INAC's Protocols, and federal and provincial guidelines, standards and regulations. The total estimated construction cost for water system upgrades to meet the INAC Protocol is $28M.
Table 4.1 provides a breakdown of the estimated total capital costs. A separate line item is included for engineering and contigency. Figure 4.1 provides a comparison graph of each of the categories. Note that treatment upgrades and storage and pumping upgrades make up approximately half of the estimated costs.
| Description | Protocol - Estimated Cost | Federal - Estimated Cost | Provincial - Estimated Cost |
|---|---|---|---|
| Building | $2,106,000 | $104,500 | $1,341,000 |
| Distribution | $2,395,500 | $2,050,000 | $2,395,500 |
| Equipment | $140,500 | $135,500 | $141,950 |
| Monitoring Equipment | $295,500 | $218,500 | $295,500 |
| Source | $2,067,450 | $230,000 | $2,067,450 |
| Storage & Pumping | $4,440,000 | $4,329,500 | $4,440,000 |
| Treatment | $10,242,500 | $10,123,500 | $10,242,500 |
| Standby Power | $1,055,000 | $250,000 | $1,055,000 |
| Engineering & Contingencies | $5,685,500 | $4,368,900 | $5,497,500 |
| Construction Total Estimate | $28,427,950 | $21,810,400 | $27,476,400 |
There are 13 water systems that may have groundwater under the direct influence (GUDI) of surface water supplies. Upgrade costs for these systems are estimated assuming that they will prove to be secure groundwater supplies and recommendations for GUDI studies are identified to confirm this.
If the GUDI studies indicate that these supplies should be considered to be surface water rather than groundwater, then additional upgrade requirements will be necessary for these systems to meet INAC's Protocols. It is estimated that, depending on system capacity and site indices, an additional $1.0 to 2.5 million will be required for each system that needs to be upgraded to surface-water treatment.
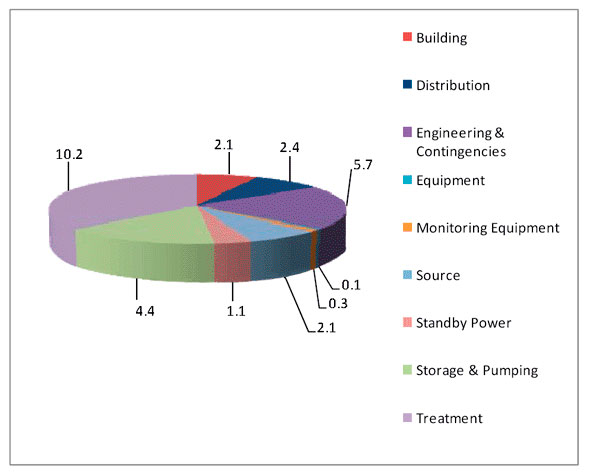
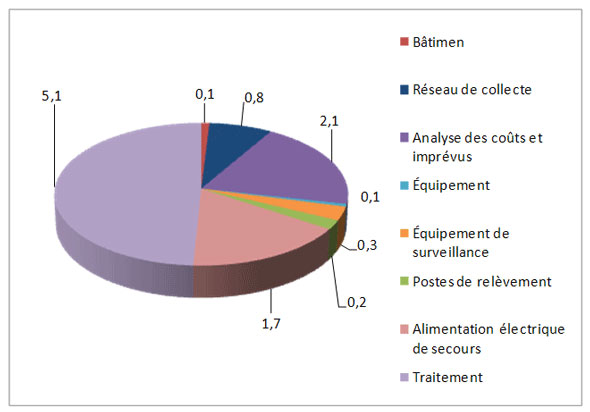
Description of Figure 4.1 – Breakdown of the Estimated Construction Costs to Meet INAC's Protocols: Water ($ -M)
This pie chart provides a breakdown (in millions of dollars) of the estimated construction costs of the upgrades that are required for water systems in First Nations communities in the Atlantic region to meet INAC's Protocols.The costs are divided into nine categories:
- Building
- Distribution
- Engineering & Contingencies
- Equipment
- Monitoring Equipment
- Source
- Standby Power
- Storage & Pumping
- Treatment
- The total estimated building cost for water systems in First Nations communities in the Atlantic region to meet INAC's Protocols is 2.1 million dollars.
- The total estimated distribution cost for water systems in First Nations communities in the Atlantic region to meet INAC's Protocols is 2.4 million dollars.
- The total estimated engineering and contingencies cost for water systems in First Nations communities in the Atlantic region to meet INAC's Protocols is 5.7 million dollars.
- The total estimated equipment cost for water systems in First Nations communities in the Atlantic region to meet INAC's Protocols is 0.1 million dollars.
- The total estimated monitoring equipment cost for water systems in First Nations communities in the Atlantic region to meet INAC's Protocols is 0.3 million dollars.
- The total estimated source cost for water systems in First Nations communities in the Atlantic region to meet INAC's Protocols is 2.1 million dollars.
- The total estimated standby power cost for water systems in First Nations communities in the Atlantic region to meet INAC's Protocols is 1.1 million dollars.
- The total estimated storage and pumping cost for water systems in First Nations communities in the Atlantic region to meet INAC's Protocols is 4.4 million dollars.
- The total estimated treatment cost for water systems in First Nations communities in the Atlantic region to meet INAC's Protocols is 10.2 million dollars.
The following lists provide a summary of the Protocol items for the two categories with the highest cumulative Protocol costs that are listed above.
Treatment:
- Provide spare chemical feed equipment.
- Provide spare disinfection equipment.
- Provide additional filter trains.
- Provide secondary containment for treatment chemicals.
- Provide specific treatment equipment (i.e. arsenic, manganese, etc.)
- Provide Supervisory Control and Data Acquisition systems (SCADA).
- Provide conventional treatment systems for groundwater-under-the-direct- influence-of-surface-water sources.
- Provide contact piping.
- Provide surge suppression/uninterruptible power supplies for critical electronic equipment.
- Remove cross connections.
- Upgrade capacity of existing water treatment plants.
Storage & Pumping:
- Expand to provide adequate storage for fire protection and domestic flows.
- Provide screened reservoir vents.
- Provide secondary containment liners for onsite fuel storage.
- Provide storage and pumping.
- Repair reservoirs.
- Retrofit existing reservoirs to include baffling (concrete and/or curtain).
| Description | Protocol - Estimated Cost | Federal - Estimated Cost | Provincial - Estimated Cost |
|---|---|---|---|
| Training | $230,000 | $230,000 | $230,000 |
| GUDI Studies | $535,000 | $45,000 | $535,000 |
| Plans/Documentation | $1,952,500 | $1,312,500 | $1,952,500 |
| Non-Construction Total Estimate | $2,717,500 | $1,587,500 | $2,717,500 |
Plans/Documentation costs include:
- Develop and/or update Emergency Response Plans.
- Develop and/or update Maintenance Management Systems.
- Develop and/or update Operation & Maintenance manuals.
- Develop and/or update Source Water Protection Plans.
- Develop Standard Operating Procedures (SOPs)/Operational Plans (OP).
- Develop wellhead protection plans, including wellhead integrity recommendations.
- Provide as-built/record drawings for facility records.
Additional annual operations and maintenance costs include costs that occur annually for items that are not currently being completed to meet protocols, such as calibrating monitoring equipment, additional sampling, cleaning the reservoir, and backup operator's salary.
| Description | Estimated Cost |
|---|---|
| Sampling | $555,000 |
| Operations | $155,000 |
| Operator | $339,000 |
| Water O&M Total Estimated Cost | $1,049,000 |
The total estimated cost, including construction and non-construction costs, for water system upgrades to meet the INAC Protocol is $31M. This excludes costs associated with potentially GUDI systems, which prove to be GUDI systems as discussed previously.
4.2 Upgrades to Meet Protocols: Wastewater
The total estimated construction cost for wastewater system upgrades to meet INAC Protocol is $10.4M. Increasing treatment capacity and providing standby power accounts for over 66% of the projected cost of meeting INAC's Protocol. Only two systems require an increase in capacity, but increasing a system's capacity requires high-cost upgrades. Providing standby power is a widespread necessity, but the upgrades required to provide standby power cost less than those required to increase capacity.
| Description | Protocol - Estimated Cost | Federal - Estimated Cost | Provincial - Estimated Cost |
|---|---|---|---|
| Building | $100,000 | $0 | $0 |
| Collection System | $780,000 | $780,000 | $780,000 |
| Equipment | $59,500 | $59,500 | $59,500 |
| Monitoring Equipment | $325,000 | $5,000 | $325,000 |
| Pumping Stations | $215,000 | $215,000 | $215,000 |
| Treatment | $5,101,000 | $5,101,000 | $5,101,000 |
| Standby Power | $1,720,000 | $1,660,000 | $1,720,000 |
| Engineering & Contingencies | $2,068,500 | $1,956,500 | $2,043,500 |
| Construction Total Estimate | $10,369,000 | $9,777,000 | $10,244,000 |
Description of Figure 4.2 – Breakdown of the Estimated Construction Costs to Meet INAC's Protocol: Wastewater ($M)
This pie chart provides a breakdown of the estimated construction costs (in millions of dollars) of the wastewater system upgrades that are required for wastewater systems in First Nations communities in the Atlantic region to meet INAC's Protocol.
The construction costs are divided into eight categories:
- Building
- Collection System
- Engineering & Contingencies
- Equipment
- Monitoring Equipment
- Pumping Stations
- Standby Power
- Treatment
- The total estimated building cost for the upgrades that are required for wastewater systems in First Nations communities in the Atlantic region to meet INAC's Protocols is 0.1 million dollars.
- The total estimated collection system cost for the upgrades that are required for wastewater systems in First Nations communities in the Atlantic region to meet INAC's Protocols is 0.8 million dollars.
- The total estimated engineering and contingencies cost for the upgrades that are required for wastewater systems in First Nations communities in the Atlantic region to meet INAC's Protocols is 2.1 million dollars.
- The total estimated equipment cost for the upgrades that are required for wastewater systems in First Nations communities in the Atlantic region to meet INAC's Protocols is 0.1 million dollars.
- The total estimated monitoring equipment cost for the upgrades that are required for wastewater systems in First Nations communities in the Atlantic region to meet INAC's Protocols is 0.3 million dollars.
- The total estimated cost for the pumping station upgrades that are required for wastewater systems in First Nations communities in the Atlantic region to meet INAC's Protocols is 0.2 million dollars.
- The total estimated standby power cost for the upgrades that are required for wastewater systems in First Nations communities in the Atlantic region to meet INAC's Protocols is 1.7 million dollars.
- The total estimated treatment cost for the upgrades that are required for wastewater systems in First Nations communities in the Atlantic region to meet INAC's Protocols is 5.1 million dollars.
Treatment is the major construction-cost category for wastewater system upgrades.
Treatment costs include:
- Installing rodent screens on wastewater outfall.
- Constructing new Rotating Biological Contactor (RBC) sewage treatment facility to meet existing demands.
- Providing additional sewage pumps.
- Providing tertiary treatment (i.e. sand filter).
- Providing treatment for sludge wastes.
- Providing UV disinfection.
- Providing nutrient removal systems.
| Description | Protocol - Estimated Cost | Federal - Estimated Cost | Provincial - Estimated Cost |
|---|---|---|---|
| Training | $160,000 | $160,000 | $160,000 |
| Plans/Documentation | $525,000 | $405,000 | $525,000 |
| Studies | $55,000 | $30,000 | $55,000 |
| Non-Construction Total Estimate | $740,000 | $595,000 | $740,000 |
Additional annual operations and maintenance costs include costs that occur annually for items that are not currently being completed to meet protocols, such as calibrating monitoring equipment, sampling and backup operator's salary. The largest cost item was sampling which is consistent with the fact that most First Nations do not currently monitor effluent quality as required by the Protocol.
| Description | Estimated Cost |
|---|---|
| Calibration | $6,000 |
| Operator - Back-up | $45,000 |
| Sampling | $289,000 |
| Wastewater O&M Total Estimated Cost | $340,000 |
The total estimated cost, including construction and non-construction costs, for wastewater system upgrades is $11M.
4.3 Upgrade Cost Summary
Table 4.7 provides a summary of the upgrade costs to meet INAC's Protocols, and federal and provincial standards, guidelines and regulations.
| Total Estimated Cost | ||
|---|---|---|
| Water | Wastewater | |
| Upgrade to meet Protocol | $31,145,450 | $11,109,000 |
| Upgrade to meet Federal Guidelines | $23,397,900 | $10,372,000 |
| Upgrade to meet Provincial Guidelines | $30,193,900 | $10,984,000 |
4.4 Asset Condition and Reporting System Needs
ACRS (Asset Condition and Reporting System) inspections were completed for all water and wastewater related assets. For the purposes of this assessment, ACRS needs were limited to required repairs of existing facilities, and did not include any upgrade costs, in order to avoid duplication with the Upgrade to Protocol needs identified. The following two tables (Tables 4.10 and 4.11) provide a summary of the required operation & maintenance repairs broken down by the type of asset for both water and wastewater systems.
| Asset Code | Description | Estimated Cost |
|---|---|---|
| A5A | Buildings | $167,775 |
| B1B | Watermains | $446,000 |
| B1C/B1D | Treatment | $71,500 |
| B1E | Reservoirs | $769,750 |
| B1F | Community Wells | $693,650 |
| B1H | High Lift Pumping | $64,500 |
| Water ACRS Total Estimated Cost | $2,213,175 |
| Asset Code | Description | Estimated Cost |
|---|---|---|
| A5B | Buildings | $37,050 |
| B2A | Sewers | $315,000 |
| B2H | Lift Stations & Forcemains | $1,038,350 |
| B2C/B2D | Treatment | $59,750 |
| B2E/B2I | Lagoons | $399,000 |
| B2F | Septic Systems | $17,500 |
| Wastewater ACRS Total Estimated Cost | $1,866,650 |
4.5 Community Servicing
An analysis was completed to evaluate future servicing alternatives for a 10-year design period. The analysis considers a variety of alternatives, including expanding existing systems, developing new systems, establishing local Municipal Type Agreements (if applicable), and using individual systems.
A theoretical operation and maintenance cost was developed for each alternative, along with a 30-year life-cycle cost. The cost of the upgrades that are necessary for systems to meet INAC's Protocol is included in the new servicing cost, if appropriate (i.e. for new servicing alternatives that include continued use of the existing system).
The following table summarizes the capital cost and the total estimated operation & maintenance cost of the recommended servicing alternatives.
| Total Estimated Cost | Cost Per Connection | |||
|---|---|---|---|---|
| Water | Wastewater | Water | Wastewater | |
| Future Servicing Cost | $110,000,000 | $100,000,000 | $11,900 | $10,700 |
| Annual O&M to service future growth | $9,000,000 | $8,800,000 | $1,000 | $900 |
The majority of communities in the Atlantic Region are serviced by piped water and sewer. In most cases, extension of the existing piped systems was found to be the most viable servicing option.
5.0 Regional Summary
Neegan Burnside Ltd. and its sub-consultants visited all of the 33 First Nations in the Atlantic region during the completion of this project. Nine of the First Nations are serviced by Municipal Type Agreements with neighbouring municipalities. The majority of First Nations are serviced by piped distribution systems; only two First Nations are serviced entirely by individual wells and septic systems. The percentage of Municipal Type Agreements appears to be higher in the Atlantic region than in other regions of Canada. The proximity of Atlantic First Nations to adjacent municipalities may explain this difference.
In the Atlantic region, six water systems and seven wastewater systems were identified as high-risk systems. High-risk systems in the region typically require system upgrades or improved operational procedures to meet the applicable guidelines, regulations, and protocols for treated water quality or sewage effluent quality. Although there are many factors that contribute to risk, the analysis suggests that INAC, Health Canada, and Band Councils should give design and operational concerns the most weight, particularly when the concern is related to the protection of public health or to the environment. The data indicates that risk could be significantly reduced if all systems were operated and maintained by trained and certified operators, and if operators completed monitoring and record keeping in accordance with INAC's Protocols.
Another area that INAC, Health Canada and Band Councils need to address is the lack of planning tools, including Source Water Protection Plans (SWPPs), Operations and Maintenance Manuals (O & Ms), Maintenance Management Plans (MMPs), and Emergency Response Plans (ERPs).
Various individual First Nations commented that current Operations & Maintenance budgets are often insufficient to retain operators, to provide ongoing component replacement and to perform all of the monitoring and recording requirements of the Protocol.
Wastewater sampling prior to effluent discharge appears to be another area that INAC, Health Canada and Band Councils could address in order to reduce the overall risk significantly. Sampling, testing and recording the effluent quality prior to discharge would reduce the reporting risk for these systems.
To address the reporting risk component for wastewater systems, INAC—in conjunction with Band Councils, Health Canada, and/or Environment Canada—could develop a protocol for sampling, testing, reporting and monitoring.
Appendix A Glossary of Terms and Acronyms
Aeration (see also lagoon): The process of bringing air into contact with a liquid (typically water), usually by bubbling air through the liquid, spraying the liquid into the air, allowing the liquid to cascade down a waterfall, or by mechanical agitation. Aeration serves to (1) strip dissolved gases from solution, and/or (2) oxygenate the liquid. (Gowen Environmental)
Aesthetic Objective (AO): Aesthetic objectives are set for drinking water quality parameters such as colour or odour, where exceeding the objective may make the water less pleasant, but not unsafe. (INAC Protocol for Decentralised Water and Wastewater)
Ammonia (See also: Potable water; Effluent quality requirements): A pungent colorless gaseous alkaline compound of nitrogen and hydrogen (NH3) that is very soluble in water and can easily be condensed to a liquid by cold and pressure (Merriam-Webster). Ammonia is used in several areas of water and wastewater treatment, such as pH control. It is also used in conjunction with chlorine to produce potable water. The existence of ammonia in wastewater is common in industrial sectors as a by-product of cleaning agents. This chemical impacts both human and environmental conditions. Treatment of ammonia can be completed in lagoon systems and mechanical plants. (R.M. Technologies)
Arsenic: A metallic element that forms a number of compounds. It is found in nature at low levels, mostly in compounds with oxygen, chlorine, and sulphur; these are called inorganic arsenic compounds. Organic arsenic in plants and animals combines with carbon and hydrogen. Inorganic arsenic is a human poison. Organic arsenic is less harmful. High levels of inorganic arsenic in food or water can be fatal. (Medicinenet.com)
Aquifer (confined): A layer of soil or rock below the land surface that is saturated with water. There are layers of impermeable material both above and below it, and it is under pressure so that when the aquifer is penetrated by a well, the water will rise above the top of the aquifer. (INAC Protocol for Decentralised Water and Wastewater Systems)
Aquifer (unconfined): An unconfined aquifer is one whose upper water surface (water table) is at atmospheric pressure, and thus is able to rise and fall. (INAC Protocol for Decentralised Water and Wastewater Systems)
As-built/record drawings: Revised set of drawing submitted by a contractor upon completion of a project or a particular job. They reflect all changes made in the specifications and working drawings during the construction process, and show the exact dimensions, geometry, and location of all elements of the work completed under the contract. Also called as-built drawings or just as-builts.
ACRS Inspection (Asset Condition Reporting System Inspection): For centralised water and wastewater systems, an ACRS (asset condition reporting system) inspection of the system is to be performed once every three (3) years by a qualified person (consulting engineer, Tribal Council engineer), who is not from the First Nation involved, to assess the condition of the asset, adequacy of maintenance efforts, and need for additional maintenance work. The ACRS inspection report will be discussed with, and submitted to, the First Nation council and the INAC regional office. Inspections will be conducted in accordance with the ACRS Manual, a copy of which can be obtained from the INAC regional office.
Bacteria (plural) bacterium (singular): Microscopic living organisms usually consisting of a single cell. Bacteria can aid in pollution control by consuming or breaking down organic matter in sewage and/or other water pollutants. Some bacteria may also cause human, animal, and plant health problems. Bacteria are predominantly found in the intestines and feces of humans and animals. The presence of coliform bacteria in water indicates the contamination of water by raw or partially treated sewage. (INAC Protocol for Decentralised Water and Wastewater Systems)
Baffle (concrete and/or curtain): Vertical/horizontal impermeable barriers in a pond or reservoir. Baffles direct the flow of water into the longest possible path through the reservoir in order to eliminate short-circuiting in the water treatment system. In potable water treatment, short-circuiting can reduce the effectiveness of disinfectants. In effluent treatment, short-circuiting may result in an increase of pollutants at the outlet. Shortcircuiting occurs when water flows directly from the inlet to the outlet across a pond or reservoir. (Layfield)
BOD5 (Biochemical Oxygen Demand): The most widely used parameter of organic pollution applied to both wastewater and surface water is the 5-day BOD (BOD5). This determination involves the measurement of the dissolved oxygen used by microorganisms in the biochemical oxidation of organic matter. BOD test results are used to: determine the approximate quantity of oxygen that will be required to biologically stabilize the organic matter present; to determine the size of waste treatment facilities; to measure the efficiency of some treatment processes; and to determine compliance with wastewater discharge permits. (Metcalf & Eddy)
Capacity (actual vs. design): Refers to the capacity of the treatment system, with the "design capacity" being the flow rate proposed by the designer or manufacturer. If the system is not operating to design levels, the "actual capacity" could be limited by failing pumps, clogged filters or not meeting the Protocol (i.e. Protocol requires two filter trains such that one could operate while another is being cleaned/repaired and this was previously not explicitly required; therefore, the actual capacity is half of the design capacity).
Chemical feed equipment: All equipment associated with introducing chemicals to the raw water as part of the treatment process including coagulants, coagulant aids, disinfectants, etc.
Chlorine: A disinfectant used in either gas or liquid from gas that is added to water to protect the consumer from bacteria and other micro-organisms. It is widely used because it is inexpensive and easily injected into water. Because of its concentration, a gallon can treat a large amount of water. However, chlorine use does have drawbacks: when chlorine is used as a disinfectant it combines with naturally occurring decaying organic matter to form Trihalomethanes (THMs). (Vital Life Systems)
Chlorination: The application of chlorine to water, sewage or industrial wastes for disinfection (reduction of pathogens) or to oxidize undesirable compounds. (City of Toronto)
Chlorine Residual: The chlorine level in potable water immediately after it has been treated. (Ontario Ministry of the Environment)
Circuit Rider (see also Circuit Rider Training Program): Under the department's Circuit Rider Trainer Program (CRTP) INAC provides funds to engage circuit riders (third party water and wastewater system experts who provide water and wastewater system operators with on-site, mentoring, training, and emergency assistance). The third-party service providers that provide circuit rider services also provide operators with a 24/7 emergency hotline. (INAC Protocol for Centralised Wastewater Systems in First Nations Communities)
Circuit Rider Training Program: The main vehicle by which most First Nations operators receive the required training to operate their systems. This program provides qualified experts who rotate through a circuit of communities, providing hands-on training for the operators on their own system. Circuit rider trainers also help the First Nations with minor troubles and issues of operation and maintenance of their systems. (INAC Plan of Action)
Cistern: A tank for storing potable water or other liquids, usually placed above the ground. (Bow River Basin Council, cited in Alberta Environment Glossary)
Class "D" Cost Estimates: A preliminary estimate, for each community visited, based on available site information, which indicates the approximate magnitude (+/- 40%) of the cost of the actions recommended in the report, and which may be used in developing long-term capital plans and for a preliminary discussion of proposed capital projects.
Collection piping: Sanitary sewer collecting wastewater from individual buildings and homes, for treatment and disposal at a public facility.
Component risk / component risk factors: The overall risk is determined by five component risks: water source/effluent, design, operation, reporting, and operator.
Community Health Representatives (CHRs): Health Canada's local health representatives. They undertake bacteriological and chlorine residual sampling of distributed water within most First Nation communities.
Contact piping: Dedicated watermain to provide chlorine contact time before potable water is distributed to the first user.
Containment liners (for on-site fuel storage): A form of secondary containment used for diesel driven generators or fire pumps.
Continuous discharge to a receiving body: The release of treated wastewater effluent to a lake, river, stream, etc. where the rate of release is continuous (i.e. not batch discharge).
Conventional Wastewater Treatment: Consists of preliminary processes, primary settling to remove heavy solids and floatable materials, secondary biological aeration to metabolize and flocculate colloidal and dissolved organics, and secondary settling to remove additional solids. Tertiary treatment such as disinfection or filtration to further treat the wastewater depending on the level of treatment required for discharge. Waste sludge drawn from these operations is thickened and processed for ultimate disposal, usually either land application or landfilling. Preliminary treatment processes include coarse screening, medium screening, shredding of solids, flow measuring, pumping, grit removal, and pre-aeration. Chlorination of raw wastewater sometimes is used for odor control and to improve settling characteristics of the solids.
Conventional Water Treatment: Consists of a combination of coagulation (adding chemicals called coagulants), flocculation (particles binding together with coagulants) and sedimentation (settling of particles) to remove a large amount of organic compounds and suspended particles, filtration (water passing through porous media) to remove bacteria protozoa and viruses (slow sand filtration) or suspended particles (rapid sand filtration), and disinfection to ensure all the bacteria protozoa and viruses are removed, and provide safe drinking water.
Cross connections: A cross connection is a link between a possible source of pollution and a potable water supply. A pollutant may enter the potable water system when a) the pressure of the pollution source exceeds the pressure of the potable water source or b) when a sudden loss of pressure occurs in the water system and "backflow" occurs. The flow through a water treatment plant should have no instances of treated water coming into contact with raw or wastewater. Backflow preventers should be tested regularly and any actual physical links should be removed.
Decentralized System: A group or groups of communal (as opposed to private) on-site water or wastewater systems. (INAC Protocol for Decentralised Water and Wastewater Systems)
Dedicated transmission main: A length of watermain which has no service connections or hydrants; can refer to the length of raw watermain from a raw water source to the water treatment plant or in the distribution system where there are larger distances between homes.
Discharge Frequency: The frequency in which treated wastewater is discharged; could be continuous, seasonal, annual, etc.
Discharge quality data: Data acquired through the completion of a laboratory analysis of treated wastewater effluent prior to obtaining permission to discharge. Relevant parameters for testing include: 5 day Biochemical Oxygen Demand, Suspended Solids, Fecal Coliforms, pH, Phenols, Oils & Greases, Phosphorus and Temperature.
Disinfectant: A disinfectant is a chemical (commonly chlorine, chloramines, or ozone) or physical process (e.g., ultraviolet light) that inactivates or kills microorganisms such as bacteria, viruses, and protozoa. (INAC Protocol for Decentralised Water and Wastewater Systems)
Disinfection: A process that has as its objective destroying or inactivating pathogenic micro-organisms in water. (Government of Alberta, Environmental Protection and Enhancement Act, cited in Alberta Environment Glossary)
Disinfection By-products: Disinfection by-products are chemical, organic and inorganic substances that can form during a reaction of a disinfectant with naturally present organic or anthropogenic matter in the water. (Lenntech)
Distribution Classification > piped / trucked: Refers to the classification of the delivery of potable water leaving the water treatment plant. This can be either piped (via watermain) or trucked (via truck delivery to individual homes/cisterns). The level of classification involves the number of house connections (population served).
Domestic flows: All demands in the water system excluding fire flows.
Drinking Water: Water of sufficiently high quality that can be consumed or used without risk of immediate or long term harm.
Drinking Water Advisory (DWA): Drinking Water Advisories (DWAs) are preventive measures that are regularly issued in municipalities and communities across Canada; they protect public health from waterborne contaminants that can be present in drinking water. A DWA can be issued in any community and may include boil water advisories, do not consume advisories and do not use advisories. (INAC "Fact Sheet")
Effluent: 1. The liquid waste of municipalities/communities, industries, or agricultural operations. Usually the term refers to a treated liquid released from a wastewater treatment process. (Bow River) 2. The discharge from any on-site sewage treatment component. (Alberta Municipal Affairs; cited in Alberta Environment Glossary)
Effluent quality data: Any test results or monitoring data that describes the condition of treated wastewater effluent.
Effluent Quality Requirements: All effluents from wastewater systems in Canada must comply with all applicable federal legislation including the Canadian Environmental Protection Act, 1999 and the Fisheries Act, as well as any other applicable legislation, including provincial, depending on the geographical location of the system. In addition, all discharges from First Nations wastewater systems shall meet the quality requirements found in the Guidelines for Effluent Quality and Wastewater Treatment at Federal Establishments - EPS 1-EC-76-1 (1976 Guidelines).
For the purposes of determining effluent quality related to ammonia and chlorine, the Notice Requiring the Preparation and Implementation of Pollution Prevention Plans for Inorganic Chloramines and Chlorinated Wastewater Effluents and the Guideline for the Release of Ammonia Dissolved in Water Found in Wastewater Effluents contain additional and/or updated information to the requirements provided in the 1976 Guidelines.
A copy of the Guideline for the Release of Ammonia Dissolved in Water Found in Wastewater Effluents can be found at Environment Canada's website. (INAC Protocol for Centralised Wastewater Systems in First Nations Communities)
Effluent Receiver (also referred to as the receiving body; the receiving environment; the receiver) (see also Effluent and Component risks): The environment that receives treated wastewater, including lakes, rivers, wetlands, sub-surfaces, title fields, open marines, and enclosed bays. It may also refer to a community's method for dealing with wastewater (e.g. Municipal Type Agreements or evaporation).
Elevated Storage: A water tower, which is a reservoir or storage tank mounted on a tower-like structure at the summit of an area of high ground in a place where the water pressure would otherwise be inadequate for distribution at a uniform pressure. (Collins)
Emergency Response Plan (ERP): Emergency response plans for water and wastewater systems are intended to be a quick reference to assist operators and other stakeholders in managing and responding to emergency situations. They include key contact information for persons to be notified and for persons who may be of assistance (e.g. agencies, contractors, suppliers, etc.), as well as standard communication and response protocols. Emergency response plans identify recommended action for "foreseeable" emergencies, and provide methodologies for unforeseen situations.
Facultative Lagoon: The most common type of wastewater treatment lagoon used by small communities and individual households. Facultative lagoons rely on both aerobic and anaerobic decomposition of waste, can be adapted for use in most climates and require no machinery to treat wastewater.
Filter: A device used to remove solids from a mixture or to separate materials. Materials are frequently separated from water using filters. (Edwards Aquifier)
Filter train equipment: Includes all components that form part of the water filtration process from where the raw water enters the filter process to where the filtered water leaves the treatment unit. This does not refer to the disinfection equipment.
Filtration: The mechanical process which removes particulate matter by separating water from solid material, usually by passing it through sand. (Edwards Aquifier)
Fire pump tests: A monthly test for the basic operation and functionality of the fire pump.
Grade Level Storage: A treated water storage reservoir that is constructed at grade, typically with earth mounded on top to provide some frost protection.
GPS: Global Positioning System (GPS) -A navigational system involving satellites and computers that can determine the latitude and longitude of a receiver on Earth by computing the time difference for signals from different satellites to reach the receiver.
Groundwater: Groundwater is any water that is obtained from a subsurface water-bearing soil unit (called an aquifer). 1) Water that flows or seeps downward and saturates soil or rock, supplying springs and wells. The upper surface of the saturate zone is called the water table. 2) Water stored underground in rock crevices and in the pores of geologic materials that make up the Earth's crust. (INAC, Protocol for Decentralised Water and Wastewater Systems)
Groundwater, confined: Groundwater that is under pressure significantly greater than atmospheric, with its upper limit the bottom of a bed with hydraulic conductivity distinctly lower than that of the material in which the confined water occurs. (INAC, Protocol for Decentralised Water and Wastewater Systems)
Groundwater, unconfined: Water in an aquifer that has a water table that is exposed to the atmosphere. (INAC Protocol for Decentralised Water and Wastewater Systems)
Groundwater under the direct influence of surface water (GUDI): This term refers to groundwater sources (e.g., wells, springs, infiltration galleries, etc.) where microbial pathogens are able to travel from nearby surface water to the groundwater source. (Government of Nova Scotia)
Guidelines: Guidelines as referred to in this Assessment include all federal and provincial water and wastewater guidelines for domestic potable water and household sanitary waste. These guidelines include the "Guidelines for Canadian Drinking Water Quality" and all its recommended health and aesthetic guidelines for water quality.
Guidelines for Canadian Drinking Water Quality (GCDWQ): Water quality guidelines developed by the Federal-Provincial-Territorial Committee on Drinking Water and have been published by Health Canada since 1968.
Canadian drinking water supplies are generally of excellent quality. However, water in nature is never "pure." It picks up traces of everything it comes into contact with, including minerals, silt, vegetation, fertilizers, and agricultural run-off. While most of these substances are harmless, some may pose a health risk. To address this risk, Health Canada works with the provincial and territorial governments to develop guidelines that set out the maximum acceptable concentrations of these substances in drinking water. These drinking water guidelines are designed to protect the health of the most vulnerable members of society, such as children and the elderly. The guidelines set out the basic parameters that every water system should strive to achieve in order to provide the cleanest, safest and most reliable drinking water possible.
The Guidelines for Canadian Drinking Water Quality deal with microbiological, chemical and radiological contaminants. They also address concerns with physical and aesthetic characteristics of water, such as taste and odour. (Health Canada)
Guidelines for Effluent Quality and Wastewater Treatment at Federal Establishments, April 1976: The purpose of these guidelines is to indicate the degree of treatment and effluent quality that will be applicable to all wastewater discharged from existing and proposed Federal installations. Use of these guidelines is intended to promote a consistent wastewater approach towards the cleanup and prevention of water pollution and ensure that the best practicable control technologies used. (Government of Canada)
Highlift Pumping: Refers to pumps installed that provide treated water into the water distribution system at pressure; either directly or via water tower.
Hydrant Flushing (see line flushing and swabbing)
Influent: Water, wastewater, or other liquid flowing into a reservoir, basin or treatment plant. (Gowen)
Lagoon: A shallow pond where sunlight, bacterial action, and oxygen work to purify wastewater. Lagoons are typically used for the storage of wastewaters, sludges, liquid wastes, or spent nuclear fuel. (Edwards Aquifier)
Lagoon, aerated: See Aeration
Lagoon, facultative: See Facultative Lagoon.
L/c/d: Measurement of daily water usage as Litres per capita, per day.
Level of Service Standards (INAC): The Level of Service Standards (LOSS), determined on a national basis, are the levels of service that the Department of Indian Affairs and Northern Development (DIAND) is prepared to financially support to assist First Nations in providing community services comparable to the levels of service that would generally be available in non-native communities of similar size and circumstances.
The Level of Service Standards provide a description of criteria which will be used to establish the level of funding for safe, cost-effective, domestic water supply and wastewater disposal systems for on-reserve housing units and administrative, operative, institutional and recreational buildings. (INAC "Water and Sewage Systems")
Lift Station (also Pumping Station): A point in the sewer system where the wastewater needs to be pumped (lifted) to a higher elevation so that gravity can be used to bring the wastewater to the treatment plant. (Hailey City Hall Public Works)
Line flushing and swabbing (also referred to as watermain swabbing and flushing): Watermain swabbing entails inserting a soft material shaped like a bullet into the watermain through a fire hydrant. The diameter is slightly larger than the watermain and the bullet (swab) is pushed along the watermain by water pressure. As it passes through the watermain, the swab executes a scouring action on the sediment inside the watermain.
During watermain flushing, high velocity water flowing from hydrants is used to remove loose sediment from watermains. (City of Guelph)
L/p/d: Measurement of daily water usage as Litres per person, per day.
MAC (Maximum acceptable concentration): In the Guidelines for Canadian Drinking Water Quality (GCDWQ), Maximum Acceptable Concentrations (MACs) have been established for certain physical, chemical, radiological and microbiological parameters or substances that are known or suspected to cause adverse effects on health. For some parameters, Interim Maximum Acceptable Concentrations (IMACs) are also recommended in the guidelines.
Drinking water that continually has a substance at a greater concentration than the specified MACs will contribute significantly to consumer exposure to the substance and may, in some instances, produce harmful health effects. However, the short-term presence of substances above the MAC levels does not necessarily mean the water constitutes a risk to health. (INAC, National Assessment Summary Report)
Maintenance Management Plan (MMP): Maintenance management plans apply to both water and wastewater systems. They are intended to improve the effectiveness of maintenance activities and are focused on planning, scheduling, and documenting preventative maintenance activities and on documenting unscheduled maintenance.
Manganese: Manganese is a mineral that naturally occurs in rocks and soil and is a normal constituent of the human diet. In some places, it exists in well water as a naturally occurring groundwater mineral, but may also be present due to underground pollution sources. Manganese may become noticeable in tap water at concentrations greater than 0.05 milligrams per liter (mg/L) of water by imparting a colour, odour, or taste to the water. However, health effects from manganese are not a concern until concentrations are approximately 10 times higher. (Conneticut Dept. of Health)
Mechanical Plant/ Mechanical Treatment: Refers to any type of wastewater treatment plant including treatments systems consisting of rotating biological contactors (RBC), sequencing batch reactors (SBR), extended aeration (EA), etc. It does not include natural forms of wastewater treatment like lagoons or septic systems.
Metals Scan (Full): A full metal scan refers to what laboratories call Inductively Coupled Plasma Mass Spectrometry (ICP-MS) analysis for the evaluation of trace metals in water samples. This test covers a complete scan of over 20 trace metals in a single analysis.
Municipal Type Agreement (MTA): The situation where First Nations are supplied with treated water from or send their wastewater to a nearby municipality, as outlined in a formal agreement between the two parties. The term is also used in this report to describe a system where the First Nation is supplied with treated water or wastewater treatment services by another First Nation or other independent body such as a corporate entity such as a Casino etc.
Multi-Barrier Approach: Approach used to ensure that drinking water is safe. In the past, the term ‘multi-barrier' referred only to the barriers involved in the actual treatment of raw water to provide quality drinking water. This approach has now been expanded to include a number of key elements that are an integral part of a drinking water program to ensure delivery of safe, secure supplies of drinking water. Barriers may be physical (eg: filter) or administrative (eg: planning) in nature. (Alberta Environment, Glossary & Alberta's Drinking Water Program)
None: Indicates that the treatment and/or distribution/collection system has not been classified.
O & M: Operation and Maintenance.
Operational Plan (OP): An Operational Plan is the primary instrument for communicating the Community's quality management system (QMS) from the public works departments (water and wastewater) to Chief and Council, and from Council to INAC, Health Canada and the community members.
Phosphorus: A non-metallic element of the nitrogen family that occurs widely especially as phosphates (Merriam-Webster). Phosphorus occurs naturally in rocks, soil, animal waste, plant material, and even the atmosphere. In addition to these natural sources, phosphorus comes from human activities such as agriculture, discharge of industrial and municipal waste, and surface water runoff from residential and urban areas. Nutrients held in soil can be dissolved in water and carried off by leaching, tile drainage or surface runoff.
Phosphorus does not pose a direct threat to human health; it is an essential component of all cells and is present in bones and teeth. It does, however, pose an indirect threat to both aesthetics and to human health by affecting source waters used for drinking and recreation. For example, excessive nutrients can promote the growth of algal blooms, which can contribute to a wide range of water quality problems by affecting the potability, taste, odour, and colour of the water. (Canadian Council of Ministers of the Environment)
Piped Distribution System: A water distribution system which relies on pipes to convey water through pumping or elevated storage to the end user. Different from trucked distribution in that a trucked distribution system delivers water to end users in batch quantities to individual holding tanks (cisterns).
Potable water: Potable water is water that is destined for human consumption. For the purposes of the Protocol for Centralised Drinking Water Systems in First Nations Communities, water destined for human consumption is water that is consumed directly as drinking water, water that is used in cooking, water that is used to wash food, and water that is used for bathing infants (individuals under 1 year in age). (INAC, Protocol for Centralised Drinking Water Systems in First Nations Communities)
PPU: People per unit. Measurement to describe housing density.
Primary Operator: The main operator of a water or wastewater system. The primary operator must be certified to the level of the treatment and distribution/collection system.
Primary Wastewater Treatment: Removal of particulate materials from domestic wastewater, usually done by allowing the solid materials to settle as a result of gravity. Typically, the first major stage of treatment encountered by domestic wastewater as it enters a treatment facility. Primary treatment plants generally remove 25 to 35 percent of the Biological Oxygen Demand (BOD) and 45 to 65 percent of the total suspended matter. Also, any process used for the decomposition, stabilization, or disposal of sludges produced by settling. (North American Lake Management Society; cited in Alberta Environment Glossary)
Protocol for Safe Drinking Water in First Nations Communities: Standards for design, construction, operation, maintenance, and monitoring of drinking water systems and is intended for use by First Nations staff responsible for water systems. It is also intended for use by Indian and Northern Affairs Canada (INAC) staff, Public Works and Government Services Canada (PWGSC) for INAC staff, and all others involved in providing advice or assistance to First Nations in the design, construction, operation, maintenance, and monitoring of their drinking water systems in their communities, in accordance with established federal or provincial standards, whichever are the most stringent.
Any water system that produces drinking water destined for human consumption, that is funded in whole or in part by INAC, and that serves five or more households or a public facility, must comply with the requirements of this protocol. (INAC Protocol)
Quality Assurance/Quality Control (QA/QC): A quality management system that focuses on fulfilling quality requirements and providing confidence that quality requirements will be fulfilled.
Reporting Risk: The Reporting risk level is the risk inherent with the operational method of recording data and providing the required reports. This would include both manual and automatic methods of record keeping. The reporting risk ranking is based on the adequacy of the operational records and the number of reports submitted during the year compared to the total number of records and reports required according to the appropriate legislation, standards, and operation procedures of the system in question.
Reservoir: A man-made lake that collects and stores water for future use. During periods of low river flow, reservoirs can release additional flow if water is available. (Government of Alberta, Water for Life, cited in Alberta Glossary)
Reservoir Cleaning: This involves the pump-down, clean-out, removal of settled material, disinfection and refill of a water storage reservoir. This activity requires confined space entry equipment and training.
Retrofit: 1. To furnish with new or modified parts or equipment not available or considered necessary at the time of manufacture; 2. To install (new or modified parts or equipment) in something previously manufactured or constructed; 3. To adapt to a new purpose or need: modify. (Merriam-Webster)
Rotating Biological Contactor (RBC): A technology used to treat wastewater classified as mechanical treatment.
Risk (Management Risk Level/Management Risk Score): Risk is defined in INAC's Management Risk Level Evaluation Guidelines for Water and Wastewater Systems in First Nations Communities (Revised 2010). These guidelines follow the Multi-Barrier Approach for water management. This approach, developed by the Federal-Provincial-Territorial Committee on Drinking Water and the Canadian Council of Ministers of the Environment (CCME) Water Quality Task Group, is intended to prevent the presence of water-borne contaminants in drinking water by ensuring effective safeguards are in place at each stage of a drinking water system.
Following that approach, INAC assesses five main components of a system to determine an overall system management risk score:
- Source Water (drinking water systems) or Effluent Receiver (wastewater systems)
- System Design
- Operation and Maintenance
- Records and Reporting
- Operator Training and Experience
Each of these components is assigned a risk score, which are then weighed to determine the overall management risk score of a system. The resulting score will then result in the management of the system as being classified as either high risk, medium risk, or low risk.
-High Risk: Major deficiencies in most of the components. Should a problem arise, the system and management as a whole is unlikely to be able to compensate, thus there is a high probability that any problem could result in unsafe water. Issues should be addressed as soon as possible.
-Medium Risk: Minor deficiencies in several components, or major deficiencies in one or two components. Should a problem arise, the system and management can probably compensate for the problem, but the noted deficiencies makes this uncertain, thus there is a medium probability that any problem could result in unsafe water. Issues need to be addressed.
-Low Risk: Minor or no deficiencies with the system or management. Should a problem occur, it is likely that the system and management as a whole will be able to compensate and continue to provide safe water while the issue is being resolved.
It is important to distinguish between INAC's system management risk level and drinking water quality. The actual quality of the water produced by a system is but one part of determining the overall system management risk level.
Unsafe drinking water is noted through the implementation of Drinking Water Advisories (DWA), not by the management risk level of the system. DWA come in multiple forms, the most common being the boil water advisory.
A system with a high-risk ranking under INAC's management evaluation is, because of its multiple deficiencies, likely to be unable to cope with problems that may occur in the system that result in a DWA. This means that DWA are likely to occur more frequently and to have a longer-term duration on a high-risk system. On the other hand, while problems can and do occur in low-risk systems, because of better overall risk management, these systems are more likely to address the problem in the short term, resulting in the rapid removal of problems and DWA.
This means that a high-risk drinking system can still produce perfectly safe and potable water. Deficiencies should be addressed as quickly as possible, however, before any issues arise with the water quality. (INAC, Management Risk Level Evaluation Guidelines)
SCADA (Supervisory Control and Data Acquisition) system: Refers to a control and/or computer system that can monitor, record and control infrastructure, or facility-based processes.
Screened reservoir vents: Reservoir vents should be screened to allow air movement and to prevent vermin from entering.
Seasonal discharge: Discharge of wastewater at times of maximum or substantial stream flow. This may vary from location to location.
Secondary containment for treatment chemicals: Secondary containment is required for the storage of all regulated hazardous materials. Secondary containment must be constructed using materials capable of containing a spill or leak for at least as long as the period between monitoring inspections. A means of providing overfill protection for any primary container may be required. This may be an overfill prevention device and/or an attention getting high level alarm. Materials that in combination may cause a fire or explosion, the production of a flammable, toxic, poisonous gas, or the deterioration of a primary or secondary container will be separated in both the primary and secondary treatment containment so as to avoid intermixing.
Secondary Treatment: involving the biological process of reducing suspended, colloidal, and dissolved organic/inorganic matter in effluent from primary treatment systems and which generally removes 80 to 95 percent of the Biochemical Oxygen Demand (BOD) and suspended matter. Secondary wastewater treatment may be accomplished by biological or chemical-physical methods. Activated sludge and trickling filters are two of the most common means of secondary treatment. (North American Lake Management Society, cited in Alberta Glossary)
Septic tank: A tank used to detain domestic wastes to allow the settling of solids prior to distribution to a leach field for soil absorption. Septic tanks are used when a piped wastewater collection system is not available to carry them to a treatment plant. A settling tank in which settled sludge is in immediate contact with sewage flowing through the tank, and wherein solids are decomposed by anaerobic bacterial action. (INAC Protocol for Centralised Wastewater)
Septic system: A combination of underground pipe(s) and holding tank(s) which are used to hold, decompose, and clean wastewater for subsurface disposal. (Bow River, cited in Alberta Glossary)
Sequencing Batch Reactor (SBR): A treatment technology used to treat wastewater classified as mechanical treatment.
Sewage treatment plant (STP) (also known as Wastewater Treatment Plant (WWTP) or Water Pollution Control Plant (WPCP)): Facility designed to treat wastewater (sewage) by removing materials that may damage water quality and threaten public health. (Ontario Ministry of Environment)
Sewage treatment systems: Facility or system designed to treat wastewater (sewage) by removing materials that may damage water quality and threaten public health. (Ontario Ministry of Environment)
Shoot-out: A septic system consisting of a septic tank with untreated wastewater effluent being discharged to the surface; this poses a health risk.
Sludge: The accumulated wet or dry solids that are separated from wastewater during treatment. This includes precipitates resulting from the chemical or biological treatment of wastewater. (Government of Alberta, Activities, cited in Alberta Glossary)
Source Classification: The determination of the water source classification in this assessment includes the options of: surface water, groundwater, GUDI or MTA. Surface water includes water from lakes or rivers; groundwater includes any well water that is not influenced by surface water infiltration; GUDI is any groundwater source under the direct influence of surface water; MTA as a source refers to the community acquiring the treated water from a municipality.
Source risk: The risk inherent in the quality and quantity of the raw source water prior to treatment.
Source Water Protection: 1. The prevention of pollution of the lakes, reservoirs, rivers, streams, and groundwater that serve as sources of drinking water. Wellhead protection would be an example of a source water protection approach that protects groundwater sources, whereas management of land around a lake or reservoir used for drinking water would be an example for surface water supplies. Source water protection programs typically include: delineating source water protection areas; identifying sources of contamination; implementing measures to manage these changes; and planning for the future. (North American Lake Management Society, cited in Alberta Glossary)
2. Action taken to control or minimize the potential for introduction of chemicals or contaminants in source waters, including water used as a source of drinking water (Alberta Environment, Standards and Guidelines, cited in Alberta Glossary).
SPS: An abbreviation of the term sewage pumping station.
Standard Operating Procedures (SOPs): An SOP is a written document or instruction detailing all steps and activities of a process or procedure. This would include all procedures used in water/wastewater treatment processes that could affect the quality.
Standpipe Storage: An above-grade storage facility where the storage volume is contained within the entirety of the structure. This type of storage is most feasible for use where there is sufficient change in the topography to allow for maximum usable volume in the standpipe.
Storage Type: Refers to whether the community water storage is via grade-level, below-grade or elevated storage (including standpipes and towers). In some cases there is no storage thus the storage type would be considered "direct pump."
Surface water: Surface water is any water that is obtained from sources, such as lakes, rivers, and reservoirs that are open to the atmosphere. (INAC, Protocol for Centralised Drinking Water)
System Designer: A system designer is a person, such as a professional engineer, who is qualified to design a water or wastewater systems. (INAC, Protocol for Centralised Drinking Water)
System Operator: A system operator is a First Nation employee or third party under contract to a First Nation who is tasked with managing a water or wastewater system. (INAC, Protocol for Centralised Drinking Water)
System Manager: A system manager is a First Nation employee or third party under contract to a First Nation who is tasked with managing a water or wastewater system. (INAC, Protocol for Centralised Drinking Water)
Tertiary Treatment: Selected biological, physical, and chemical separation processes to remove organic and inorganic substances that resist conventional treatment practices. Tertiary Treatment processes may consist of flocculation basins, clarifiers, filters, and chlorine basins or ozone or ultraviolet radiation processes. Tertiary techniques may also involve the application of wastewater to land to allow the growth of plants to remove plant nutrients. Can include advanced nutrient removal processes. (North American Lake Management Society, cited in Alberta Glossary)
Trihalomethanes (THMs): Chemical compounds that can be formed when water is disinfected using chlorine or bromine as the chemical disinfection agent. These chemical compounds are formed when organic material present in the raw source water reacts with chlorine or bromine. Therefore, THMs are classified as disinfection by-products (DBPs). The primary source of organic material comes from decaying vegetation found in lakes, rivers and streams and for this reason, THMs are more commonly observed in water systems that use a surface water source. The four chemical compounds that are measured and used to calculate total THMs are: chloroform, bromoform, bromodichloromethane (BDCM) and chlorodibromomethane (CDBM). THMs are a concern in potable water because there is scientific evidence that they may pose a risk in the development of cancer.
Treatment Certification: The treatment level to which an operator is certified for water treatment and distribution and wastewater treatment and collection systems (see Treatment Classification).
Treatment Classification: The size (flow) and complexity of a water or wastewater system is used to determine the Class of a system using a point template. The knowledge and experience it takes to operate a system is closely related to its classification and is reflected in the level of certification of the operator. Systems that are small and relatively simple, are classified as Small Water or Wastewater Systems. Larger or more complex systems are ranked as Class I, II, III, and IV with the highest being Class IV. Systems should be operated under the supervision of an operator certified to at least the same level of the facility.
TSS (Total Suspended Solids): Measure of the amount of non-dissolved solid material present in water or wastewater. Total suspended solids (TSS) can cause: a) interference with light penetration (in UV applications), b) build-up of sediment and c) can carry nutrients and other toxic pollutants that cause algal blooms and potential reduction in aquatic habitat (wastewater).
Underground Storage: A water storage facility (reservoir/clearwell) which is located 100% below-grade. Often located below the water treatment plant.
Waste: Any solid or liquid material, product, or combination of them that is intended to be treated or disposed of or that is intended to be stored and then treated or disposed. This does not include recyclables. (Government of Alberta, Activities Designation Regulation, cited in Alberta Glossary)
Waste management plan: A Waste Management Plan identifies and describes types of waste generated during operations and how they are managed and disposed of.
Wastewater (Industrial Wastewater, Domestic Wastewater): A combination of liquid and water-carried pollutants from homes, businesses, industries, or farms; a mixture of water and dissolved or suspended solids. (North American Lake Management Society, cited in Alberta Glossary)
Wastewater System: an organized process and associated structures for collecting, treating, and disposing of wastewater. For the purposes of this report, it is a system serving five or more houses. It includes any or all of the following:
- Sewers and pumping stations that make up a wastewater collection system.
- Sewers and pumping stations that transport untreated wastewater from a wastewater collection system to a wastewater treatment plant.
- Wastewater treatment plants.
- Facilities that provide storage for treated wastewater.
- Wastewater sludge treatment and disposal facilities.
- Sewers that transport treated wastewater from a wastewater treatment plant to the place where it is disposed of.
- Treated wastewater outfall facilities, including the outfall structures to a watercourse or any structures for disposal of treated wastewater to land or to wetlands. (Government of Alberta, Environmental Protection and Enhancement Act, cited in Alberta Glossary)
Wastewater Treatment: Any of the mechanical, chemical or biological processes used to modify the quality of wastewater (sewage) in order to make it more compatible or acceptable to man and his/her environment. (North American Lake Management System, cited in Alberta Glossary)
Wastewater Treatment Plant: Any structure, thing, or process used for the physical, chemical, biological, or radiological treatment of wastewater before it is returned to the environment. The term also includes any structure, thing, or process used for wastewater storage or disposal, or sludge treatment, storage, or disposal. (Government of Alberta, Activities, cited in Alberta Glossary)
Watermain: A principal pipe in a system of pipes for conveying water, especially one installed underground. (American Heritage Dictionary)
Water quality: The term used to describe the chemical, physical, and biological characteristics of water, usually with respect to its suitability for a particular purpose. (INAC, Protocol for Centralised Drinking Water)
Water use: The term water use refers to water that is used for a specific purpose, such as for domestic use, irrigation, or industrial processing. Water use pertains to human interaction with and influence on the hydrolic cycle, and includes elements, such as water withdrawal from surface- and ground-water sources, water delivery to homes and businesses, consumptive use of water, water released from wastewater-treatment plans, water returned to the environment, and in-stream uses, such as using water to produce hydroelectric power. (INAC, Protocol for Centralised Drinking Water)
Water Well: An opening in the ground, whether drilled or altered from its natural state, that is used for the production of groundwater, obtaining data on groundwater, or recharging an underground formation from which groundwater can be recovered. By definition in the provincial Water Act, a water well also includes any related equipment, buildings, and structures. (Government of Alberta, Water for Life, cited in Alberta, Glossary)
Wellhead Protection Area: A protected surface and subsurface zone surrounding a well or well field supplying a public water system to keep contaminants from reaching the well water. (Edwards Aquifier)
Wellhead Protection Plan: A wellhead protection plan defines the wellhead protection area, identifies potential sources of contamination, manages the potential contaminant sources including properly decommissioning abandoned wells, identifies emergency and contingency plans (i.e. what to do if the well becomes contaminated or requires additional capacity) and provides overall public awareness.
References
Alberta Environment. Alberta's Drinking Water Program: A ‘Source to Tap, Multi-barrier' Approach, 2008. Unpublished
The American Heritage® Dictionary of the English Language, Fourth Edition copyright ©2000 by Houghton Mifflin Company. Updated in 2009.
Alberta Municipal Affairs. Alberta Private Sewage Systems Standard of Practice Handbook, 2000.
Bow River Basin Council. Guidebook to Water Management: Background Information on Organizations, Policies, Legislation, Programs, and Projects in the Bow River Basin, 2002
Collins English Dictionary - Complete & Unabridged 10th Edition 2009 © William Collins Sons & Co. Ltd. 1979, 1986 © HarperCollins Publishers 1998, 2000, 2003, 2005, 2006, 2007, 2009.
City of Toronto. Biosolids and Residuals Masterplan (PDF)
Government of Canada. Guidelines for Effluent Quality and Wastewater Treatment at Federal Establishments, April 1976.
Layfield Environmental Systems. "AquaGuide Floating and Fixed Baffles
Ontario Ministry of the Environment. Technical Report: Drinking Water System at the Kashechewan First Nation. November 10, 2005.
R.M. Technologies; Water Treatment
UNEP (2000) International source book on environmentally sound technologies for wastewater and stormwater management /p>
Waterwiki
Connecticut Department of Health, Drinking Water Section. Fact Sheet: Manganese in Drinking Water (257 Kb)
Edwards Aquifier Website: Glossary of Water Resource Terms
Government of Alberta. Activities Designation Regulation, 2003
Government of Alberta. Environmental Protection and Enhancement Act, 2000
Government of Alberta. Water for Life: Alberta's Strategy for Sustainability., 2003
Government of British Columbia, Environmental Protection Division. Glossary of Water Terms.
Government of Nova Scotia. Government of Nova Scotia. Protocol for Determining Groundwater Under the Direct Influence of Surface Water.
Gowen Environmental Ltd. "Contaminated and Hazardous Waste Site Management Glossary I."
Hailey City Hall, Public Works
Health Canada. Canadian Drinking Water Guidelines
Lenntech Water Treatment Solutions. "Disinfection By-Products."
Vital Life Systems. "Water Treatment Terminology."
Appendix B System Summary
Appendix B.1 Water System Summary
Regional Roll-Up Summary: Water
Region: Atlantic
Total No. of First Nations: 33
Participating No. of First Nations: 33
Participation Level: 100%
No. of Community Reports Issued: 35
| Groundwater | GUDI | Surface | MTA | Totals | |
|---|---|---|---|---|---|
| Total No. of Systems | 20 | 3 | 3 | 9 | 35 |
| System Age | |||||
| 0-5 years (2006 - 2010) | 2 | 0 | 0 | 0 | 2 |
| 5-10 years (2001 - 2005) | 2 | 0 | 1 | 1 | 4 |
| 10-15 years (1996 - 2000) | 2 | 0 | 2 | 2 | 6 |
| 15-20 years (1991 - 1995) | 7 | 0 | 0 | 2 | 9 |
| >20 years (≤ 1990) | 7 | 3 | 0 | 4 | 14 |
| Treatment | |||||
| None - Direct Use | 2 | 0 | 0 | 0 | 2 |
| Disinfection only | 14 | 2 | 0 | 0 | 16 |
| Conventional Filtration | 4 | 1 | 3 | 0 | 8 |
| MTA | 0 | 0 | 0 | 9 | 9 |
| Classification - Treatment | |||||
| Small System | 1 | 0 | 0 | 0 | 1 |
| Level I | 0 | 1 | 1 | 0 | 2 |
| Level II | 3 | 0 | 2 | 0 | 5 |
| MTA | 0 | 0 | 0 | 9 | 9 |
| None | 16 | 2 | 0 | 0 | 18 |
| Classification - Distribution | |||||
| Small System | 3 | 1 | 0 | 0 | 4 |
| Level I | 13 | 2 | 3 | 1 | 19 |
| Level II | 4 | 0 | 0 | 0 | 4 |
| MTA | 0 | 0 | 0 | 8 | 8 |
| Distribution | |||||
| Piped | 20 | 3 | 3 | 9 | 35 |
| Water Quality | |||||
| Fails Health | |||||
| Yes, fails health due to: | 5 | 1 | 2 | 1 | 9 |
| Design | 2 | 0 | 0 | 1 | 3 |
| Operation | 3 | 0 | 1 | 0 | 4 |
| Combination | 0 | 1 | 0 | 0 | 1 |
| Unknown | 0 | 0 | 1 | 0 | 1 |
| Fails Aesthetic | |||||
| Yes, fails aesthetic due to: | 5 | 0 | 0 | 0 | 5 |
| Design | 4 | 0 | 0 | 0 | 4 |
| Operation | 1 | 0 | 0 | 0 | 1 |
| Combination | 0 | 0 | 0 | 0 | 0 |
| Unknown | 0 | 0 | 0 | 0 | 0 |
| Primary Operator - Treatment | |||||
| Not certified | 1 | 1 | 2 | 0 | 4 |
| No operator | 0 | 0 | 0 | 0 | 0 |
| Not required | 16 | 2 | 0 | 9 | 27 |
| Certified to Level | 2 | 0 | 1 | 0 | 3 |
| Certified | 1 | 0 | 0 | 0 | 1 |
| Back-up Operator - Treatment | |||||
| Not certified | 3 | 0 | 2 | 0 | 5 |
| No operator | 1 | 1 | 0 | 0 | 2 |
| Not required | 16 | 2 | 0 | 9 | 27 |
| Certified to Level | 0 | 0 | 1 | 0 | 1 |
| Certified | 0 | 0 | 0 | 0 | 0 |
| Primary Operator - Distribution | |||||
| Not certified | 1 | 1 | 2 | 1 | 5 |
| No operator | 3 | 0 | 0 | 0 | 3 |
| Not required | 0 | 0 | 0 | 8 | 8 |
| Certified to Level | 13 | 2 | 1 | 0 | 16 |
| Certified | 3 | 0 | 0 | 0 | 3 |
| Back-up Operator - Distribution | |||||
| Not certified | 12 | 1 | 2 | 0 | 15 |
| No operator | 7 | 2 | 0 | 1 | 10 |
| Not required | 0 | 0 | 0 | 8 | 8 |
| Certified to Level | 1 | 0 | 1 | 0 | 2 |
| Certified | 0 | 0 | 0 | 0 | 0 |
| Risk (mean) | Groundwater | GUDI | Surface | MTA | Mean | Mean excluding MTA |
|---|---|---|---|---|---|---|
| Final | 5.7 | 6.7 | 6.3 | 1.8 | 4.8 | 5.9 |
| Source | 6.0 | 9.3 | 9.0 | 1.0 | 5.3 | 6.8 |
| Design | 5.2 | 6.7 | 4.7 | 1.8 | 4.4 | 5.3 |
| Operations | 6.6 | 6.7 | 6.7 | 2.0 | 5.4 | 6.6 |
| Reporting | 9.1 | 10.0 | 6.3 | 1.4 | 6.9 | 8.8 |
| Operator | 2.5 | 4.0 | 7.0 | 2.0 | 2.9 | 3.2 |
Appendix B.2 Wastewater System Summary
Regional Roll-Up Summary: Wastewater
Region: Atlantic
Total No. of First Nations: 33
Participating No. of First Nations: 33
Participation Level: 100%
No. of Community Reports Issued: 35
| Septic | Aerated Lagoon | Facultative Lagoon | Mechanical | Other | MTA | Totals | |
|---|---|---|---|---|---|---|---|
| Total No. of Systems | 1 | 7 | 6 | 5 | 0 | 9 | 28 |
| System Age | |||||||
| 0-5 years (2006 - 2010) |
0 | 0 | 2 | 1 | 0 | 0 | 3 |
| 6-10 years (2001 - 2005) |
0 | 1 | 0 | 0 | 0 | 0 | 1 |
| 10-15 years (1996 - 2000) |
0 | 0 | 2 | 3 | 0 | 0 | 5 |
| 15 -20 years (1991 - 1995) |
0 | 2 | 1 | 0 | 0 | 3 | 6 |
| 20 years (≤ 1990)-->
> 20 years (≤ 1990) |
1 | 4 | 1 | 1 | 0 | 6 | 13 |
| Classification - Treatment | |||||||
| Small System | 1 | 0 | 0 | 0 | 0 | 0 | 1 |
| MTA | 0 | 0 | 0 | 0 | 0 | 9 | 9 |
| Level I | 0 | 5 | 5 | 0 | 0 | 0 | 10 |
| Level II | 0 | 2 | 1 | 4 | 0 | 0 | 7 |
| Level III | 0 | 0 | 0 | 1 | 0 | 0 | 1 |
| Classification - Collection | |||||||
| Small System | 0 | 0 | 0 | 0 | 0 | 1 | 1 |
| Level I | 1 | 7 | 6 | 4 | 0 | 2 | 20 |
| Level II | 0 | 0 | 0 | 1 | 0 | 0 | 1 |
| MTA | 0 | 0 | 0 | 0 | 0 | 6 | 6 |
| Collection | |||||||
| Piped | 1 | 7 | 6 | 4 | 0 | 8 | 26 |
| Trucked | 0 | 0 | 0 | 0 | 0 | 0 | 0 |
| Combined | 0 | 0 | 0 | 1 | 0 | 1 | 2 |
| Effluent Quality | |||||||
| No data | 0 | 4 | 3 | 3 | 0 | 8 | 18 |
| Meets | 0 | 0 | 2 | 0 | 0 | 1 | 3 |
| Does not meet | 1 | 3 | 1 | 2 | 0 | 0 | 7 |
| Primary Operator - Treatment | |||||||
| Not certified | 1 | 4 | 4 | 5 | 0 | 0 | 14 |
| No operator | 0 | 0 | 0 | 0 | 0 | 0 | 0 |
| Not required | 0 | 0 | 0 | 0 | 0 | 9 | 9 |
| Certified to Level | 0 | 3 | 2 | 0 | 0 | 0 | 5 |
| Certified | 0 | 0 | 0 | 0 | 0 | 0 | 0 |
| Back-Up Operator - Treatment | |||||||
| Not certified | 1 | 5 | 4 | 1 | 0 | 0 | 11 |
| No operator | 0 | 2 | 2 | 3 | 0 | 0 | 7 |
| Not required | 0 | 0 | 0 | 0 | 0 | 9 | 9 |
| Certified to Level | 0 | 0 | 0 | 0 | 0 | 0 | 0 |
| Certified | 0 | 0 | 0 | 1 | 0 | 0 | 1 |
| Primary Operator - Collection | |||||||
| Not certified | 1 | 6 | 3 | 5 | 0 | 3 | 18 |
| No operator | 0 | 0 | 0 | 0 | 0 | 0 | 0 |
| Not required | 0 | 0 | 0 | 0 | 0 | 6 | 6 |
| Certified to Level | 0 | 1 | 3 | 0 | 0 | 0 | 4 |
| Certified | 0 | 0 | 0 | 0 | 0 | 0 | 0 |
| Back-Up Operator - Collection | |||||||
| Not certified | 1 | 5 | 4 | 2 | 0 | 1 | 13 |
| No operator | 0 | 2 | 2 | 3 | 0 | 2 | 9 |
| Not required | 0 | 0 | 0 | 0 | 0 | 6 | 6 |
| Certified to Level | 0 | 0 | 0 | 0 | 0 | 0 | 0 |
| Certified | 0 | 0 | 0 | 0 | 0 | 0 | 0 |
| Receiver | |||||||
| Large river | 0 | 0 | 2 | 1 | 0 | 0 | 3 |
| Creek | 0 | 3 | 0 | 0 | 0 | 0 | 3 |
| Lake, reservoir | 0 | 0 | 1 | 2 | 0 | 0 | 3 |
| Open marine, enclosed bay | 1 | 1 | 1 | 1 | 0 | 0 | 4 |
| River | 0 | 2 | 2 | 1 | 0 | 0 | 5 |
| Wetland | 0 | 1 | 0 | 0 | 0 | 0 | 1 |
| MTA | 0 | 0 | 0 | 0 | 0 | 9 | 9 |
| Risk (mean) |
Septic | Aerated Lagoon | Facultative Lagoon | Mechanical | Other | MTA | Mean | Mean excluding MTA |
|---|---|---|---|---|---|---|---|---|
| Final | 6.1 | 6.9 | 6.4 | 7.3 | 0.0 | 1.9 | 5.2 | 6.8 |
| Effluent Receiver | 2.0 | 6.0 | 6.3 | 6.8 | 0.0 | 1.2 | 4.5 | 6.1 |
| Design | 8.0 | 5.6 | 5.3 | 5.2 | 0.0 | 1.6 | 4.3 | 5.5 |
| Operations | 7.0 | 8.4 | 7.2 | 7.2 | 0.0 | 3.4 | 6.3 | 7.6 |
| Reporting | 10.0 | 9.1 | 8.5 | 10.0 | 0.0 | 2.0 | 6.9 | 9.2 |
| Operator | 5.0 | 6.4 | 5.7 | 9.2 | 0.0 | 1.1 | 5.0 | 6.8 |
Appendix C Site Visit Methodology
Site Visits
Typical Day
Arrive in Community – Lead/Senior Inspector & Technical Support
- Meet with Circuit Rider and/or DIAND representative and First Nation/Tribal Council Representatives to undergo introductions and provide a brief synopsis of the activities to be undertaken for the day. This is based on the assumption that the First Nation has been fully briefed by DIAND on the purpose, process and benefits for the First Nation to cooperate and collaborate with the project.
- Confirm the various components that the First Nation uses to provide water to the entire community (i.e. number and types of distribution systems, source types, private wells, etc.) to help build assessment form for the community.
- Pre-select areas to undertake private system evaluations on community map.
- Confirm any missing background data that may be available allowing the First Nation time during the day to have Public Works Director/Supervisor/Secretary/ etc to locate such materials.
Lead/Senior – Inspector
- Meet with Chief/Housing Manager/Band Manager/Finance Manager, to identify:
- future servicing needs (planned development and population growth)
- servicing constraints (source availability, soils, groundwater, bedrock, topography, etc.)
- identify the extent to which non structural solutions or optimization strategies (water conservation, leak reduction, etc) have been previously investigated or implemented
- confirm current population and housing numbers
- obtain financial information not previously provided
- note community concerns related to future servicing.
- Complete a walk through of the water plant from source to storage.
- Prepare a flow schematic (internal use).
- Complete the assessment questionnaire on treatment/storage/operations/operator(s) etc. with Operator/Circuit Rider.
- Take photographs.
- Travel to main sewage pumping station and wastewater treatment facility.
- Complete a walk through of the plant from influent to effluent.
- Prepare a flow schematic (internal use).
- Complete assessment questionnaire.
- Take photographs.
- Complete ACRS update.
- Repeat for additional water or wastewater facilities.
- Review information collected by Technical Support
- Gather all background/operational data gathered by First Nation.
- Complete overall notes.
Technical Support
- Gather any relevant operational data (water and wastewater), if not already provided and arrange with the First Nation to have copied/scanned that day.
- Obtain GPS coordinates of source(s) and treatment.
- Complete the source questions on the assessment questionnaire.
- Undertake sampling of the raw and/or treated water, if necessary.
- Take photographs.
- Complete ACRS update.
- Travel around community with First Nation representative and undertake private system assessments for water and/or septic including GPS coordinates, photographs, assessment forms and sampling.
- Meet back with Lead/Senior Inspector at wastewater location and assist with sampling, if required.
Sampling Requirements
Water Sampling
The terms of reference state, "The sampling program for public water systems should reflect the requirements of the most stringent regulations applicable in the Province in which the community is located. However, should an adequate sampling program already be in place, then existing data may be used. Bidders should assume sampling and testing will be required for 5% of total wells, septics, and cisterns identified in SW5. Septics and cisterns only require a visual inspection. All bidders are required to carry a $500,000 allowance for this purpose. Any variances should be identified in the Inception Report."
Health Canada data is anticipated to be available for the majority of the water systems. Where data is not available, sampling will be conducted as part of the inspection.
Minimum existing data required will include:
Community systems
- bacteriological – monthly available for previous year
- general chemistry – annually (treated)
- full Volatile Organic Compound analysis – within 5 years
Private wells
- bacteriological – one sample within past year
- basic chemistry – one sample within past year
For public systems where data is not available, treated water samples will be obtained and submitted to a laboratory for testing that would include; Basic Chemistry, Full Metals Scan, Bacteria and Volatile Organic Compounds.
For public systems that include a piped distribution system and where distributed water quality data is not available, a sample will be taken from the most remote point in the distribution system and sampled for Disinfection By-Products.
For individual wells, samples will be obtained from a representative number of wells (5% of total wells) in the community. The testing will include; Basic Chemistry, Full Metals Scan and Bacteria.
Wastewater Sampling
For systems lacking existing discharge quality data, and that will be discharging at the time of the site visit, representative samples will be obtained and submitted to a laboratory for testing. This would include seasonal discharges at the time of the site visit and from plants with continuous discharge to a receiving body. Sewage treatment systems providing an equivalent to secondary treatment (lagoons, and mechanical facilities) for which effluent quality data does not include the parameters of BOD5, TSS, and E.Coli, will be sampled in the field, if they are in fact discharging at the time of site visit. Similarly, sewage treatment systems providing an equivalent to tertiary treatment for which effluent quality data does not include BOD5, TSS, Ammonia, Total Phosphorous and E.Coli, will be sampled in the field, if they are in fact discharging at the time of the site visit.
Appendix D: First Nation Water Summaries
Appendix D.1: Individual First Nation Water Summary
| First Nation Information | Water System Information | ||||
|---|---|---|---|---|---|
| Band # | Band Name | System Name | System Number | Water Source | Treatment Class |
| 1 | Abegweit | 12499 | MORELL No. 2 | Groundwater | None |
| 1 | Abegweit | 12479 | ROCKY POINT No 3 | Groundwater | None |
| 1 | Abegweit | 12459 | SCOTCHFORT No 4, Siteno 6002 | Groundwater | None |
| 18 | Acadia | MTA | MTA | MTA | |
| 20 | Annapolis Valley | 6474 | CAMBRIDGE No 32 | Groundwater | None |
| 4 | Buctouche | 17002 | CWS | Groundwater | None |
| 5 | Burnt Church | 6467 | BURNT CHURCH No 14 | Groundwater | None |
| 22 | Chapel Island First Nation | 6475 | CHAPEL ISLAND No 5 | Eau de surface | Level II |
| 7 | Eel Ground | 6468 | EEL GROUND No 2 | Groundwater | None |
| 8 | Eel River Bar First Nation | 17003 | Eel River 3 | MTA | MTA |
| 3 | Elsipogtog First Nation | 6465 | RICHIBUCTO No 15 | Groundwater | None |
| 23 | Eskasoni | 6476 | ESKASONI No 3A | Groundwater | None |
| 9 | Fort Folly | FORT FOLLYMTA WATER SYSTEM | MTA | MTA | |
| 30 | Glooscap First Nation | NEW001 | GLOOSCAPMTA WATER SYSTEM | MTA | MTA |
| 11 | Kingsclear | 6469 | KINGSCLEAR No 6 | GroundwaterESIDES | None |
| 2 | Lennox Island | NEW001 | LENNOX ISLAND WATER SYSTEM | Groundwater | None |
| 6 | Madawaska Maliseet First Nation | NEW003 | MTA POUR AQUEDUC | MTA | MTA |
| 26 | Membertou | NEW001 | MTA WATER SYSTEM | MTA | MTA |
| 14 | Metepenagiag Mikmaq Nation | 6470 | RED BANK No 4 | Groundwater | None |
| 47 | Miawpukek | 6480 | SAMIAJIJ MIAWPUKEK - Water treatment system | Eau de surface | Level I |
| 27 | Millbrook First Nation | MTA | MTA | MTA | |
| 32 | Mushuau Innu First Nation | MUSHUAU Water treatment system | Eau de surface | Level II | |
| 12 | Oromocto | 17004 | CWS | MTA | MTA |
| 13 | Pabineau | 9816 | PABINEAUNo 11 | GroundwaterESIDES | Level I |
| 19 | Paqtnkek First Nation | NEW001 | PETOW SUBDIVISION Pumphouse | Groundwater | Level II |
| 19 | Paqtnkek First Nation | 6473 | POMQUET AND AFTON No 23 (station de pompageno 1) | Groundwater | None |
| 24 | Pictou Landing First Nation | 6478 | FISHER'S GRANT No 24 | Groundwater | None |
| 15 | Saint Mary's | NEW001 | WATER SYSTEM | MTA | MTA |
| 33 | Sheshatshiu Innu First Nation | 7103 | Sheshatshiu Water Treatment Plant | Groundwater | None |
| 25 | Shubenacadie | 6481 | INDIAN BROOK I.R. No 14 | Groundwater | Level II |
| 25 | Shubenacadie | NEW ROSS Pumphouse | Groundwater | Small System | |
| 16 | Tobique | 6471 | TOBIQUENo 20 | Groundwater | None |
| 28 | Wagmatcook | 6477 | WAGMATCOOK No 1 | Groundwater | Level II |
| 29 | Waycobah First Nation | 6479 | WHYCOCOMAGH No 2 | Groundwater | None |
| 17 | Woodstock | 6472 | WOODSTOCK No 23 | GroundwaterESIDES | None |
| First Nation Information | Water System Information | |||||
|---|---|---|---|---|---|---|
| Band # | Band Name | Const Year | Design Capacity [m3/d] | Actual Capacity [m3/d] | Max Daily Volume [m3/d] | Disinfection |
| 1 | Abegweit | 1992 | 229 | 229 | 27.3 | Yes |
| 1 | Abegweit | 1992 | 229 | 229 | 38.1 | No |
| 1 | Abegweit | 1992 | 916 | 916 | 133 | No |
| 18 | Acadia | 1990 | MTA | |||
| 20 | Annapolis Valley | 1984 | 605 | 605 | 287 | Yes |
| 4 | Buctouche | 1991 | 381 | 381 | 101 | Yes |
| 5 | Burnt Church | 1977 | 588 | 588 | 917 | Yes |
| 22 | Chapel Island First Nation | 2000 | 544 | 305 | 301 | Yes |
| 7 | Eel Ground | 1998 | 660 | 660 | 561 | Yes |
| 8 | Eel River Bar First Nation | 2000 | n/a | n/a | n/a | MTA |
| 3 | Elsipogtog First Nation | 1992 | 1926 | 1926 | 1408 | Yes |
| 23 | Eskasoni | 1987 | 3168 | 2420 | 2279 | Yes |
| 9 | Fort Folly | 1991 | MTA | |||
| 30 | Glooscap First Nation | 2004 | MTA | |||
| 11 | Kingsclear | 1987 | 1090 | 1090 | 718 | Yes |
| 2 | Lennox Island | 2008 | 1235 | 1235 | 523 | Yes |
| 6 | Madawaska Maliseet First Nation | 1993 | MTA | |||
| 26 | Membertou | 1980 | MTA | |||
| 14 | Metepenagiag Mikmaq Nation | 2005 | 976 | 976 | 411 | Yes |
| 47 | Miawpukek | 2004 | 781 | Yes | ||
| 27 | Millbrook First Nation | 1970 | MTA | |||
| 32 | Mushuau Innu First Nation | 2000 | 850 | 850 | 792 | Yes |
| 12 | Oromocto | 2000 | MTA | |||
| 13 | Pabineau | 1975 | 196 | 95 | 95 | Yes |
| 19 | Paqtnkek First Nation | 2005 | 136 | 136 | 171.9 | Yes |
| 19 | Paqtnkek First Nation | 1980 | 65 | 65 | 86 | Yes |
| 24 | Pictou Landing First Nation | 1975 | 290 | 290 | 462 | Yes |
| 15 | Saint Mary's | 1982 | MTA | |||
| 33 | Sheshatshiu Innu First Nation | 1993 | 1713 | 1713 | Yes | |
| 25 | Shubenacadie | 1990 | 862 | 862 | 1060 | Yes |
| 25 | Shubenacadie | 1995 | unknown | unknown | 23 | No |
| 16 | Tobique | 1988 | 1555 | 1555 | 1357 | Yes |
| 28 | Wagmatcook | 2007 | 544 | 544 | 609 | Yes |
| 29 | Waycobah First Nation | 1997 | 458 | 458 | 625 | Yes |
| 17 | Woodstock | 1955 | 583 | 216 | 143 | Yes |
| First Nation Information | Water System Information | ||
|---|---|---|---|
| Band # | Band Name | Reservoir Type | Reservoir Capacity |
| 1 | Abegweit | None | |
| 1 | Abegweit | None | |
| 1 | Abegweit | None | |
| 18 | Acadia | None | MTA |
| 20 | Annapolis Valley | Underground | 240 |
| 4 | Buctouche | None | 0 |
| 5 | Burnt Church | Elevated | 568 |
| 22 | Chapel Island First Nation | Elevated | 282 |
| 7 | Eel Ground | Grade Level | 670 |
| 8 | Eel River Bar First Nation | None | MTA |
| 3 | Elsipogtog First Nation | Elevated | 950 |
| 23 | Eskasoni | Standpipe | 1 926 |
| 9 | Fort Folly | None | MTA |
| 30 | Glooscap First Nation | None | MTA |
| 11 | Kingsclear | Grade Level | 480 |
| 2 | Lennox Island | Standpipe | 1 140 |
| 6 | Madawaska Maliseet First Nation | None | MTA |
| 26 | Membertou | MTA | |
| 14 | Metepenagiag Mikmaq Nation | Grade Level | 455 |
| 47 | Miawpukek | Underground | |
| 27 | Millbrook First Nation | None | MTA |
| 32 | Mushuau Innu First Nation | Underground | 410 |
| 12 | Oromocto | None | MTA |
| 13 | Pabineau | None | |
| 19 | Paqtnkek First Nation | Grade Level | 360 |
| 19 | Paqtnkek First Nation | Underground | 95 |
| 24 | Pictou Landing First Nation | Standpipe, souterrain | 900 |
| 15 | Saint Mary's | None | MTA |
| 33 | Sheshatshiu Innu First Nation | Standpipe | 757 |
| 25 | Shubenacadie | Elevated | 1 280 |
| 25 | Shubenacadie | None | |
| 16 | Tobique | Underground | 1 220 |
| 28 | Wagmatcook | Standpipe | 3,440 |
| 29 | Waycobah First Nation | Elevated | 418 |
| 17 | Woodstock | Underground | 738 |
| First Nation Information | Distribution System Information | |||||||
|---|---|---|---|---|---|---|---|---|
| Band # | Band Name | Distribution Class | Population Served | Homes Piped | Homes Trucked | Number of Trucks in Service | Pipe Length | Pipe Length / Connection |
| 1 | Abegweit | Small System | 28 | 9 | 0 | 0 | 244 | 27 |
| 1 | Abegweit | Small System | 50 | 16 | 0 | 0 | 450 | 28 |
| 1 | Abegweit | Level I | 136 | 44 | 0 | 0 | 1646 | 37 |
| 18 | Acadia | MTA | 205 | 69 | 0 | 0 | 1036 | 15 |
| 20 | Annapolis Valley | Level I | 127 | 57 | 0 | 0 | 1765 | 30 |
| 4 | Buctouche | Level I | 104 | 37 | 0 | 0 | 1315 | 35 |
| 5 | Burnt Church | Level I | 1128 | 260 | 0 | 0 | 8960 | 34 |
| 22 | Chapel Island First Nation | Level I | 574 | 145 | 0 | 0 | 5780 | 39 |
| 7 | Eel Ground | Level I | 690 | 180 | 0 | 0 | 5495 | 30 |
| 8 | Eel River Bar First Nation | Level I | 431 | 155 | 0 | 0 | 5360 | 34 |
| 3 | Elsipogtog First Nation | Level II | 2160 | 600 | 0 | 0 | 9522 | 15 |
| 23 | Eskasoni | Level II | 3684 | 950 | 0 | 0 | 26394 | 27 |
| 9 | Fort Folly | MTA | 35 | 22 | 0 | 0 | 2360 | 107 |
| 30 | Glooscap First Nation | MTA | 108 | 22 | 0 | 0 | 2977 | 135 |
| 11 | Kingsclear | Level I | 803 | 185 | 0 | 0 | 6938 | 37 |
| 2 | Lennox Island | Level I | 484 | 120 | 0 | 0 | 3010 | 25 |
| 6 | Madawaska Maliseet First Nation | MTA | 149 | 80 | 0 | 0 | 2533 | 31 |
| 26 | Membertou | MTA | 959 | 312 | 0 | 0 | 5474 | 17 |
| 14 | Metepenagiag Mikmaq Nation | Level I | 423 | 138 | 0 | 0 | 7173 | 51 |
| 47 | Miawpukek | Level I | 961 | 305 | 0 | 0 | 12800 | 41 |
| 27 | Millbrook First Nation | MTA | 868 | 346 | 0 | 0 | 12170 | 35 |
| 32 | Mushuau Innu First Nation | Level I | 975 | 170 | 0 | 0 | 13500 | 79 |
| 12 | Oromocto | MTA | 352 | 98 | 0 | 0 | 2273 | 23 |
| 13 | Pabineau | Small System | 60 | 30 | 0 | 0 | 3950 | 131 |
| 19 | Paqtnkek First Nation | Level I | 191 | 56 | 0 | 0 | 2500 | 44 |
| 19 | Paqtnkek First Nation | Level I | 236 | 69 | 0 | 0 | ||
| 24 | Pictou Landing First Nation | Level I | 554 | 151 | 0 | 0 | 4978 | 32 |
| 15 | Saint Mary's | MTA | 912 | 250 | 0 | 0 | 5800 | 23 |
| 33 | Sheshatshiu Innu First Nation | Level II | 2108 | 350 | 0 | 0 | 9800 | 28 |
| 25 | Shubenacadie | Level I | 1305 | 340 | 0 | 0 | 17116 | 50 |
| 25 | Shubenacadie | Small System | 24 | 6 | 0 | 0 | 525 | 87 |
| 16 | Tobique | Level II | 1681 | 356 | 0 | 0 | 9445 | 26 |
| 28 | Wagmatcook | Level I | 750 | 147 | 0 | 0 | 9471 | 64 |
| 29 | Waycobah First Nation | Level I | 925 | 260 | 0 | 0 | 8464 | 32 |
| 17 | Woodstock | Level I | 296 | 80 | 0 | 0 | 4129 | 51 |
| First Nation Information | Water System Information | |||
|---|---|---|---|---|
| Band # | Band Name | System # | System Name | Water Source |
| 1 | Abegweit | 12499 | MORELLNO. 2 | Groundwater |
| 1 | Abegweit | 12479 | ROCKY POINT NO. 3 | Groundwater |
| 1 | Abegweit | 12459 | SCOTCHFORT NO.4, Site #06002 | Groundwater |
| 18 | Acadia | MTA | MTA | |
| 20 | Annapolis Valley | 6474 | CAMBRIDGE NO. 32 | Groundwater |
| 4 | Buctouche | 17002 | CWS | Groundwater |
| 5 | Burnt Church | 6467 | BURNT CHURCH NO. 14 | Groundwater |
| 22 | Chapel Island First Nation | 6475 | CHAPEL ISLAND NO. 5 | Surface Water |
| 7 | Eel Ground | 6468 | EEL GROUND NO. 2 | Groundwater |
| 8 | Eel River Bar First Nation | 17003 | Eel River 3 | MTA |
| 3 | Elsipogtog First Nation | 6465 | RICHIBUCTO NO. 15 | Groundwater |
| 23 | Eskasoni | 6476 | ESKASONI NO. 3A | Groundwater |
| 9 | Fort Folly | FORT FOLLYMTA WATER SYSTEM | MTA | |
| 30 | Glooscap First Nation | NEW001 | GLOOSCAPMTA WATER SYSTEM | MTA |
| 11 | Kingsclear | 6469 | KINGSCLEAR NO. 6 | GroundwaterGUDI |
| 2 | Lennox Island | NEW001 | LENNOX ISLAND WATER SYSTEM | Groundwater |
| 6 | Madawaska Maliseet First Nation | NEW003 | WATERMTA | MTA |
| 26 | Membertou | NEW001 | MTA WATER SYSTEM | MTA |
| 14 | Metepenagiag Mikmaq Nation | 6470 | RED BANK NO. 4 | Groundwater |
| 47 | Miawpukek | 6480 | SAMIAJIJ MIAWPUKEK - water treatment system | Surface Water |
| 27 | Millbrook First Nation | MTA | MTA | |
| 32 | Mushuau Innu First Nation | MUSHUAU WATER TREATMENT PLANT | Surface Water | |
| 12 | Oromocto | 17004 | CWS | MTA |
| 13 | Pabineau | 9816 | PABINEAU NO. 11 | GroundwaterGUDI |
| 19 | Paqtnkek First Nation | NEW001 | PETOW SUBDIVISION PUMPHOUSE | Groundwater |
| 19 | Paqtnkek First Nation | 6473 | POMQUET AND AFTON NO. 23 (Pumphouse #1) | Groundwater |
| 24 | Pictou Landing First Nation | 6478 | FISHER'S GRANT NO. 24 | Groundwater |
| 15 | Saint Mary's | NEW001 | WATER SYSTEM | MTA |
| 33 | Sheshatshiu Innu First Nation | 7103 | Sheshatshiu Water Treatment Plant | Groundwater |
| 25 | Shubenacadie | 6481 | INDIAN BROOK I.R. NO. 14 | Groundwater |
| 25 | Shubenacadie | NEW ROSS PUMPHOUSE | Groundwater | |
| 16 | Tobique | 6471 | TOBIQUE NO. 20 | Groundwater |
| 28 | Wagmatcook | 6477 | WAGMATCOOK NO. 1 | Groundwater |
| 29 | Waycobah First Nation | 6479 | WHYCOCOMAGH NO. 2 | Groundwater |
| 17 | Woodstock | 6472 | WOODSTOCK NO. 23 | GroundwaterGUDI |
| First Nation Information | Water Quality Information | ||||||||
|---|---|---|---|---|---|---|---|---|---|
| Band # | Band Name | Meets/ Does Not Meet GCDWQ | Cause of Failure | Fails Health Guidelines | Fails Aesthetic Guidelines | Fails MAC by Design | Fails MAC by Operation | DWA In Effect | DWA Count |
| 1 | Abegweit | Low Freq, Low Mag | Operation | Yes | No | No | Yes | Yes | 1 |
| 1 | Abegweit | Low Freq, Low Mag | Operation | Yes | No | No | Yes | Yes | 1 |
| 1 | Abegweit | Low Freq, Low Mag | Design | Yes | No | Yes | No | No | 0 |
| 18 | Acadia | Meets Requirements | N/A | N/A | N/A | No | No | No | 0 |
| 20 | Annapolis Valley | Meets Requirements | N/A | N/A | N/A | No | No | No | 0 |
| 4 | Buctouche | Meets Requirements | N/A | N/A | N/A | No | No | Yes | 1 |
| 5 | Burnt Church | Meets Requirements | N/A | No | No | No | No | No | 0 |
| 22 | Chapel Island First Nation | High Freq, Low Mag | Unknown | Yes | No | No | No | No | 0 |
| 7 | Eel Ground | Low Freq, Low Mag | Design | No | Yes | No | No | No | 0 |
| 8 | Eel River Bar First Nation | Meets Requirements | N/A | No | No | No | No | No | 0 |
| 3 | Elsipogtog First Nation | High Freq, Low Mag | Design | No | Yes | No | No | Yes | 1 |
| 23 | Eskasoni | Meets Requirements | N/A | N/A | N/A | No | No | No | 0 |
| 9 | Fort Folly | Meets Requirements | N/A | N/A | N/A | No | No | No | 0 |
| 30 | Glooscap First Nation | High Freq OR High Mag | Design | Yes | No | No | No | No | 0 |
| 11 | Kingsclear | Meets Requirements | N/A | No | No | No | No | No | 0 |
| 2 | Lennox Island | Meets Requirements | N/A | No | No | No | No | No | 0 |
| 6 | Madawaska Maliseet First Nation | Meets Requirements | N/A | N/A | N/A | No | No | No | 0 |
| 26 | Membertou | Meets Requirements | N/A | N/A | N/A | No | No | No | 0 |
| 14 | Metepenagiag Mikmaq Nation | Meets Requirements | N/A | No | No | No | No | No | 0 |
| 47 | Miawpukek | High Freq OR High Mag | Operation | Yes | No | No | No | Yes | 1 |
| 27 | Millbrook First Nation | Meets Requirements | N/A | N/A | N/A | No | No | No | 0 |
| 32 | Mushuau Innu First Nation | Meets Requirements | N/A | No | No | No | No | No | 0 |
| 12 | Oromocto | Meets Requirements | N/A | No | N/A | N/A | No | No | 0 |
| 13 | Pabineau | High Freq, Low Mag | Both | Yes | No | No | No | Yes | 1 |
| 19 | Paqtnkek First Nation | Meets Requirements | N/A | N/A | N/A | No | No | No | 0 |
| 19 | Paqtnkek First Nation | Meets Requirements | N/A | N/A | N/A | No | No | No | 0 |
| 24 | Pictou Landing First Nation | Meets Requirements | N/A | N/A | N/A | No | No | No | 0 |
| 15 | Saint Mary's | Meets Requirements | N/A | No | No | No | No | No | 0 |
| 33 | Sheshatshiu Innu First Nation | Low Freq, Low Mag | Design | No | Yes | No | No | No | 0 |
| 25 | Shubenacadie | Low Freq, Low Mag | Operation | No | Yes | No | No | No | 0 |
| 25 | Shubenacadie | High Freq AND High Mag | Design | Yes | Yes | No | No | No | 0 |
| 16 | Tobique | Meets Requirements | N/A | N/A | N/A | No | No | No | 0 |
| 28 | Wagmatcook | High Freq, Low Mag | Operation | Yes | No | No | No | No | 0 |
| 29 | Waycobah First Nation | Meets Requirements | N/A | N/A | N/A | No | No | No | 0 |
| 17 | Woodstock | Meets Requirements | N/A | No | No | No | No | No | 0 |
| First Nation Information | Water System Information | |||
|---|---|---|---|---|
| Band # | Band Name | System # | System Name | Water Source |
| 1 | Abegweit | 12499 | MORELL NO. 2 | Groundwater |
| 1 | Abegweit | 12479 | ROCKY POINT NO. 3 | Groundwater |
| 1 | Abegweit | 12459 | SCOTCHFORT NO.4, Site #06002 | Groundwater |
| 18 | Acadia | MTA | MTA | |
| 20 | Annapolis Valley | 6474 | CAMBRIDGE NO. 32 | Groundwater |
| 4 | Buctouche | 17002 | CWS | Groundwater |
| 5 | Burnt Church | 6467 | BURNT CHURCH NO. 14 | Groundwater |
| 22 | Chapel Island First Nation | 6475 | CHAPEL ISLAND NO. 5 | Surface Water |
| 7 | Eel Ground | 6468 | EEL GROUND NO. 2 | Groundwater |
| 8 | Eel River Bar First Nation | 17003 | Eel River 3 | MTA |
| 3 | Elsipogtog First Nation | 6465 | RICHIBUCTO NO. 15 | Groundwater |
| 23 | Eskasoni | 6476 | ESKASONI NO. 3A | Groundwater |
| 9 | Fort Folly | FORT FOLLYMTA WATER SYSTEM | MTA | |
| 30 | Glooscap First Nation | NEW001 | GLOOSCAPMTA WATER SYSTEM | MTA |
| 11 | Kingsclear | 6469 | KINGSCLEAR NO. 6 | GroundwaterGUDI |
| 2 | Lennox Island | NEW001 | LENNOX ISLAND WATER SYSTEM | Groundwater |
| 6 | Madawaska Maliseet First Nation | NEW003 | WATERMTA | MTA |
| 26 | Membertou | NEW001 | MTA WATER SYSTEM | MTA |
| 14 | Metepenagiag Mikmaq Nation | 6470 | RED BANK NO. 4 | Groundwater |
| 47 | Miawpukek | 6480 | SAMIAJIJ MIAWPUKEK - water treatment system | Surface Water |
| 27 | Millbrook First Nation | MTA | MTA | |
| 32 | Mushuau Innu First Nation | MUSHUAU WATER TREATMENT PLANT | Surface Water | |
| 12 | Oromocto | 17004 | CWS | MTA |
| 13 | Pabineau | 9816 | PABINEAU NO. 11 | GroundwaterGUDI |
| 19 | Paqtnkek First Nation | NEW001 | PETOW SUBDIVISION PUMPHOUSE | Groundwater |
| 19 | Paqtnkek First Nation | 6473 | POMQUET AND AFTON NO. 23 (Pumphouse #1) | Groundwater |
| 24 | Pictou Landing First Nation | 6478 | FISHER'S GRANT NO. 24 | Groundwater |
| 15 | Saint Mary's | NEW001 | WATER SYSTEM | MTA |
| 33 | Sheshatshiu Innu First Nation | 7103 | Sheshatshiu Water Treatment Plant | Groundwater |
| 25 | Shubenacadie | 6481 | INDIAN BROOK I.R. NO. 14 | Groundwater |
| 25 | Shubenacadie | NEW ROSS PUMPHOUSE | Groundwater | |
| 16 | Tobique | 6471 | TOBIQUE NO. 20 | Groundwater |
| 28 | Wagmatcook | 6477 | WAGMATCOOK NO. 1 | Groundwater |
| 29 | Waycobah First Nation | 6479 | WHYCOCOMAGH NO. 2 | Groundwater |
| 17 | Woodstock | 6472 | WOODSTOCK NO. 23 | GroundwaterGUDI |
| First Nation Information | Operator Information | ||||||
|---|---|---|---|---|---|---|---|
| Band # | Band Name | Primary Operator Exists | Primary Operator Treatment Class | Primary Operator Distribution Class | Secondary Operator Exists | Secondary Operator Treatment Class | Secondary Operator Distribution Class |
| 1 | Abegweit | No | Not Required | No Operator | No | Not Required | No Operator |
| 1 | Abegweit | No | Not Required | No Operator | No | Not Required | No Operator |
| 1 | Abegweit | No | Not Required | No Operator | No | Not Required | No Operator |
| 18 | Acadia | NR | Not Required | Not Required | No | Not Required | Not Required |
| 20 | Annapolis Valley | Yes | Not Required | Level I | No | Not Required | No Operator |
| 4 | Buctouche | Yes | Not Required | No Certification | Yes | Not Required | No Certification |
| 5 | Burnt Church | Yes | Not Required | Level I | Yes | Not Required | Level I |
| 22 | Chapel Island First Nation | Yes | No Certification | No Certification | Yes | No Certification | No Certification |
| 7 | Eel Ground | Yes | Not Required | Level I | Yes | Not Required | No Certification |
| 8 | Eel River Bar First Nation | Yes | Not Required | No Certification | No | Not Required | No Certification |
| 3 | Elsipogtog First Nation | Yes | Not Required | Level I | Yes | Not Required | No Certification |
| 23 | Eskasoni | Yes | Not Required | Level I | Yes | Not Required | No Certification |
| 9 | Fort Folly | NR | Not Required | Not Required | No | Not Required | Not Required |
| 30 | Glooscap First Nation | NR | Not Required | Not Required | No | Not Required | Not Required |
| 11 | Kingsclear | Yes | Not Required | Level I | Yes | Not Required | No Certification |
| 2 | Lennox Island | Yes | Not Required | Level I | No | Not Required | No Operator |
| 6 | Madawaska Maliseet First Nation | NR | Not Required | Not Required | No | Not Required | Not Required |
| 26 | Membertou | NR | Not Required | Not Required | No | Not Required | Not Required |
| 14 | Metepenagiag Mikmaq Nation | Yes | Not Required | Level I | Yes | Not Required | No Certification |
| 47 | Miawpukek | Yes | Level II | Level I | Yes | Level II | Level I |
| 27 | Millbrook First Nation | NR | Not Required | Not Required | No | Not Required | Not Required |
| 32 | Mushuau Innu First Nation | Yes | No Certification | No Certification | Yes | No Certification | No Certification |
| 12 | Oromocto | NR | Not Required | Not Required | No | Not Required | Not Required |
| 13 | Pabineau | Yes | No Certification | No Certification | No | Not Required | No Operator |
| 19 | Paqtnkek First Nation | Yes | No Certification | Level I | Yes | No Certification | No Certification |
| 19 | Paqtnkek First Nation | Yes | Not Required | Level I | Yes | Not Required | No Certification |
| 24 | Pictou Landing First Nation | Yes | Not Required | Level I | Yes | Not Required | No Certification |
| 15 | Saint Mary's | NR | Not Required | Not Required | No | Not Required | Not Required |
| 33 | Sheshatshiu Innu First Nation | Yes | Not Required | Level I | Yes | Not Required | No Certification |
| 25 | Shubenacadie | Yes | Level II | Level I | Yes | No Certification | No Certification |
| 25 | Shubenacadie | Yes | Level II | Level I | Yes | No Certification | No Certification |
| 16 | Tobique | Yes | Not Required | Level II | No | Not Required | No Operator |
| 28 | Wagmatcook | Yes | Level I | Level I | No | Not Required | No Operator |
| 29 | Waycobah First Nation | Yes | Not Required | Level I | Yes | Not Required | No Certification |
| 17 | Woodstock | Yes | Not Required | Level I | No | Not Required | No Operator |
Appendix D.2: Individual First Nation Wastewater Summary
| First Nation Information | Wastewater System Information | |||||||
|---|---|---|---|---|---|---|---|---|
| Band # | Band Name | System # | System Name | Const Year | Receiver Name | Treatment Class | Design Capacity [m3/d] | Max Daily Volume [m3/d] |
| 18 | Acadia | MTA | 1990 | MTA | MTA | |||
| 5 | Burnt Church | 7241 | BURNT CHURCH NO. 14 | 1987 | River | Level I | 216 | 468 |
| 22 | Chapel Island First Nation | 7249 | CHAPEL ISLAND NO. 5 | 1985 | Creek | Level II | 600 | 192 |
| 7 | Eel Ground | 7242 | EEL GROUND NO. 2 | 1998 | River | Level I | 286 | |
| 8 | Eel River Bar First Nation | Eel River 3 | 1995 | MTA | MTA | unknown | 447 | |
| 3 | Elsipogtog First Nation | 7240 | RICHIBUCTO NO. 15 | 1982 | River | Level I | 866.5 | |
| 23 | Eskasoni | 7250 | EskasoniNo. 3 Wastewater Treatment Plant | 1998 | Lake, Reservoir | Level II | 5683 | 1322 |
| 9 | Fort Folly | FORT FOLLYMTA WASTEWATER SYSTEM | 1991 | MTA | MTA | |||
| 11 | Kingsclear | 7243 | KINGSCLEAR NO. 6 | 1978 | Creek | Level I | 333 | |
| 2 | Lennox Island | 14139 | LENNOX ISLAND NO. 1 | 2007 | Open Marine | Level II | 2344 | 218 |
| 6 | Madawaska Maliseet First Nation | NEW002 | WASTEWATERMTA | 1993 | MTA | MTA | ||
| 26 | Membertou | NEW002 | MTA WASTEWATER SYSTEM | 1980 | MTA | MTA | ||
| 14 | Metepenagiag Mikmaq Nation | 7244 | RED BANK NO. 4 | 1991 | Large River | Level I | 176 | |
| 47 | Miawpukek | BURNT WOODS COMMUNAL SYSTEM | 1990 | Open Marine | Small System | 54 | ||
| 47 | Miawpukek | 7254 | SAMIAJIJ MIAWPUKEK - wastewater treatment system | 1985 | Open Marine | Level I | 333 | |
| 27 | Millbrook First Nation | MTA | 1970 | MTA | MTA | |||
| 32 | Mushuau Innu First Nation | MUSHUAU WASTEWATER TREATMENT PLANT | 2000 | Large River | Level I | 548 | 404 | |
| 12 | Oromocto | NEW001 | WASTEWATER SYSTEM | 0 | MTA | MTA | ||
| 19 | Paqtnkek First Nation | 7247 | POMQUET AND AFTON NO. 23 | 2000 | River | Level III | 365 | 177 |
| 24 | Pictou Landing First Nation | 7252 | FISHER'S GRANT NO. 24 | 1979 | Open Marine | Level II | 189 | 204 |
| 15 | Saint Mary's | NEW002 | WASTEWATER SYSTEM | 0 | MTA | MTA | ||
| 33 | Sheshatshiu Innu First Nation | 7644 | Sheshatsiu Wastewater Treatment Plant | 2010 | Lake, Reservoir | Level I | 867 | |
| 25 | Shubenacadie | 7255 | INDIAN BROOK I.R. NO. 14 | 2001 | Creek | Level II | 681 | 542 |
| 16 | Tobique | 7245 | TOBIQUE NO. 20 | 1994 | River | Level I | 625 | 698 |
| 28 | Wagmatcook | 7251 | WAGMATCOOK NO. 1 | 1993 | Wetland | Level I | 288 | 187 |
| 28 | Wagmatcook | WAGMATCOOKRBC | 2010 | Lake, Reservoir | Level II | 309 | 125 | |
| 29 | Waycobah First Nation | NEW001 | WYHCOCOMAGH NO. 2 (MTA) | 1975 | MTA | MTA | 316 | |
| 17 | Woodstock | 7246 | WOODSTOCK NO. 23 | 1998 | Large River | Level II | 518 | 122 |
| First Nation Information | Wastewater System Information | ||||||
|---|---|---|---|---|---|---|---|
| Band # | Band Name | Wastewater System Type | Wastewater Treatment Level | Wastewater Disinfection Chlorine | Wastewater Disinfection UV | Discharge Frequency | Wastewater Sludge Treatment |
| 18 | Acadia | MTA | MTA | MTA | MTA | MTA | MTA |
| 5 | Burnt Church | Aerated lagoon | Secondary | No | No | Continuous | No |
| 22 | Chapel Island First Nation | Aerated lagoon | Secondary | No | Yes | Other | No |
| 7 | Eel Ground | Faculative lagoon | Secondary | No | Yes | Continuous | No |
| 8 | Eel River Bar First Nation | MTA | MTA | MTA | MTA | MTA | MTA |
| 3 | Elsipogtog First Nation | Faculative lagoon | Secondary | No | No | Continuous | No |
| 23 | Eskasoni | SBR | Tertiary | No | Yes | Continuous | Yes |
| 9 | Fort Folly | MTA | MTA | MTA | MTA | MTA | MTA |
| 11 | Kingsclear | Aerated lagoon | Secondary | Yes | No | Continuous | No |
| 2 | Lennox Island | Faculative lagoon | Secondary | No | Yes | Continuous | No |
| 6 | Madawaska Maliseet First Nation | MTA | MTA | MTA | MTA | MTA | MTA |
| 26 | Membertou | MTA | MTA | MTA | MTA | MTA | MTA |
| 14 | Metepenagiag Mikmaq Nation | Faculative lagoon | Secondary | No | Yes | Continuous | No |
| 47 | Miawpukek | Septic | Primary | Yes | No | Continuous | No |
| 47 | Miawpukek | Aerated lagoon | Secondary | No | Yes | Continuous | No |
| 27 | Millbrook First Nation | MTA | MTA | MTA | MTA | MTA | MTA |
| 32 | Mushuau Innu First Nation | Faculative lagoon | Secondary | No | No | Fall | No |
| 12 | Oromocto | MTA | MTA | MTA | MTA | MTA | MTA |
| 19 | Paqtnkek First Nation | SBR | Tertiary | No | Yes | Other | No |
| 24 | Pictou Landing First Nation | RBC | Secondary | Yes | No | Continuous | No |
| 15 | Saint Mary's | MTA | MTA | MTA | MTA | MTA | MTA |
| 33 | Sheshatshiu Innu First Nation | Faculative lagoon | Secondary | No | No | Spring, fall | No |
| 25 | Shubenacadie | Aerated lagoon | Tertiary | No | Yes | Continuous | No |
| 16 | Tobique | Aerated lagoon | Secondary | Yes | No | Continuous | No |
| 28 | Wagmatcook | Aerated lagoon | Secondary | Yes | No | Continuous | No |
| 28 | Wagmatcook | RBC | Tertiary | No | Yes | Continuous | Yes |
| 29 | Waycobah First Nation | MTA | MTA | MTA | MTA | MTA | MTA |
| 17 | Woodstock | RBC | Secondary | No | Yes | Continuous | Yes |
| First Nation Information | Collection System Information | |||||||
|---|---|---|---|---|---|---|---|---|
| Band # | Band Name | System # | System Name | Collection Type | Collection Class | Pop. Served | Homes Piped | Homes Trucked |
| 18 | Acadia | MTA | Piped | MTA | 205 | 69 | 0 | |
| 5 | Burnt Church | 7241 | BURNT CHURCH NO. 14 | Piped | Level I | 1128 | 260 | 0 |
| 22 | Chapel Island First Nation | 7249 | CHAPEL ISLAND NO. 5 | Piped | Level I | 574 | 145 | 0 |
| 7 | Eel Ground | 7242 | EEL GROUND NO. 2 | Piped | Level I | 690 | 180 | 0 |
| 8 | Eel River Bar First Nation | Eel River 3 | Piped | Level I | 431 | 155 | 0 | |
| 3 | Elsipogtog First Nation | 7240 | RICHIBUCTO NO. 15 | Piped | Level I | 2088 | 580 | 0 |
| 23 | Eskasoni | 7250 | EskasoniNo. 3 Wastewater Treatment Plant | Piped, Trucked | Level II | 3622 | 934 | 1 |
| 9 | Fort Folly | FORT FOLLYMTA WASTEWATER SYSTEM | Piped | Small System | 35 | 22 | 0 | |
| 11 | Kingsclear | 7243 | KINGSCLEAR NO. 6 | Piped | Level I | 803 | 185 | 0 |
| 2 | Lennox Island | 14139 | LENNOX ISLAND NO. 1 | Piped | Level I | 484 | 120 | 0 |
| 6 | Madawaska Maliseet First Nation | NEW002 | WASTEWATERMTA | Piped | MTA | 149 | 79 | 0 |
| 26 | Membertou | NEW002 | MTA WASTEWATER SYSTEM | Piped | MTA | 959 | 312 | 0 |
| 14 | Metepenagiag Mikmaq Nation | 7244 | RED BANK NO. 4 | Piped | Level I | 423 | 138 | 0 |
| 47 | Miawpukek | BURNT WOODS COMMUNAL SYSTEM | Piped | Level I | 129 | 41 | 0 | |
| 47 | Miawpukek | 7254 | SAMIAJIJ MIAWPUKEK - wastewater treatment system | Piped | Level I | 803 | 255 | 0 |
| 27 | Millbrook First Nation | MTA | Piped | MTA | 865 | 346 | 0 | |
| 32 | Mushuau Innu First Nation | MUSHUAU WASTEWATER TREATMENT PLANT | Piped | Level I | 975 | 170 | 0 | |
| 12 | Oromocto | NEW001 | WASTEWATER SYSTEM | Piped | MTA | 352 | 98 | 0 |
| 19 | Paqtnkek First Nation | 7247 | POMQUET AND AFTON NO. 23 | Piped | Level I | 427 | 125 | 0 |
| 24 | Pictou Landing First Nation | 7252 | FISHER'S GRANT NO. 24 | Piped | Level I | 554 | 151 | 0 |
| 15 | Saint Mary's | NEW002 | WASTEWATER SYSTEM | Piped | MTA | 912 | 250 | 0 |
| 33 | Sheshatshiu Innu First Nation | 7644 | Sheshatsiu Wastewater Treatment Plant | Piped | Level I | 2090 | 347 | 0 |
| 25 | Shubenacadie | 7255 | INDIAN BROOK I.R. NO. 14 | Piped | Level I | 1305 | 340 | 0 |
| 16 | Tobique | 7245 | TOBIQUE NO. 20 | Piped | Level I | 1691 | 358 | 0 |
| 28 | Wagmatcook | 7251 | WAGMATCOOK NO. 1 | Piped | Level I | 450 | 92 | 0 |
| 28 | Wagmatcook | WAGMATCOOKRBC | Piped | Level I | 300 | 53 | 0 | |
| 29 | Waycobah First Nation | NEW001 | WYHCOCOMAGH NO. 2 (MTA) | Piped, Trucked | Level I | 879 | 247 | 2 |
| 17 | Woodstock | 7246 | WOODSTOCK NO. 23 | Piped | Level I | 296 | 80 | 0 |
| First Nation Information | Collection System Information | Effluent Quality | ||||||
|---|---|---|---|---|---|---|---|---|
| Band # | Band Name | No. of Trucks in Service | Pipe Length | Pipe Length / Connection | Low Pressure Sewer | No. of Pumping Stations | Meets Federal Guidelines (1976) | Cause of Failure |
| 18 | Acadia | 0 | 1103 | 15 | No | 5 | MTA | MTA |
| 5 | Burnt Church | 0 | 6394 | 24 | No | 5 | Unknown | Unknown |
| 22 | Chapel Island First Nation | 0 | 4831 | 33 | No | 5 | Unknown | Unknown |
| 7 | Eel Ground | 0 | 5528 | 30 | No | 2 | Unknown | Unknown |
| 8 | Eel River Bar First Nation | 0 | 3339 | 21 | No | 3 | MTA | MTA |
| 3 | Elsipogtog First Nation | 0 | 9755 | 16 | No | 5 | High Freq OR High Mag | Design |
| 23 | Eskasoni | 1 | 21764 | 23 | No | 13 | Unknown | Unknown |
| 9 | Fort Folly | 0 | 2360 | 107 | No | 1 | MTA | MTA |
| 11 | Kingsclear | 0 | 3085 | 16 | No | 0 | High Freq AND High Mag | Design & Operation |
| 2 | Lennox Island | 0 | 3110 | 25 | No | 7 | Meets Requirements | Unknown |
| 6 | Madawaska Maliseet First Nation | 1 | 2333 | 29 | No | 1.0 | MTA | MTA |
| 26 | Membertou | 0 | 7760 | 24 | No | 1 | MTA | MTA |
| 14 | Metepenagiag Mikmaq Nation | 0 | 7270 | 52 | No | 4 | Meets Requirements | Unknown |
| 47 | Miawpukek | 0 | No | 1 | High Freq OR High Mag | Design | ||
| 47 | Miawpukek | 0 | 8680 | 34 | No | 11 | High Freq AND High Mag | Operation |
| 27 | Millbrook First Nation | 0 | 11249 | 32 | No | 3 | MTA | MTA |
| 32 | Mushuau Innu First Nation | 0 | 6786.66 | 39 | No | 4 | Unknown | Unknown |
| 12 | Oromocto | 0 | 1974 | 20 | No | 4 | MTA | MTA |
| 19 | Paqtnkek First Nation | 0 | 3872 | 30 | No | 2 | Unknown | Unknown |
| 24 | Pictou Landing First Nation | 0 | 3579 | 23 | No | 0 | High Freq AND High Mag | Design & Operation |
| 15 | Saint Mary's | 0 | 3930 | 15 | No | 0 | MTA | MTA |
| 33 | Sheshatshiu Innu First Nation | 0 | 6200 | 17 | No | 4 | Unknown | Unknown |
| 25 | Shubenacadie | 0 | 11624 | 34 | No | 4 | Unknown | Unknown |
| 16 | Tobique | 0 | 8495 | 23 | No | 3 | Unknown | Unknown |
| 28 | Wagmatcook | 0 | 5729 | 62 | No | 2 | High Freq AND High Mag | Design & Operation |
| 28 | Wagmatcook | 0 | No | 0 | Unknown | Unknown | ||
| 29 | Waycobah First Nation | 0 | 6191 | 25 | No | 7 | MTA | MTA |
| 17 | Woodstock | 0 | 4129 | 51 | No | 1 | High Freq OR High Mag | Design & Operation |
| First Nation Information | Operator Information | ||||||
|---|---|---|---|---|---|---|---|
| Band # | Band Name | Primary Operator Exists | Primary Operator Treatment Class | Primary Operator Collection Class | Secondary Operator Exists | Secondary Operator Treatment Class | Secondary Operator Collection Class |
| 18 | Acadia | NR | Not Required | Not Required | No | Not Required | Not Required |
| 5 | Burnt Church | Yes | No Certification | No Certification | Yes | No Certification | No Certification |
| 22 | Chapel Island First Nation | Yes | No Certification | No Certification | Yes | No Certification | No Certification |
| 7 | Eel Ground | Yes | No Certification | No Certification | Yes | No Certification | No Certification |
| 8 | Eel River Bar First Nation | Yes | Not Required | Not Required | No | Not Required | Not Required |
| 3 | Elsipogtog First Nation | Yes | Level I | Level I | Yes | No Certification | No Certification |
| 23 | Eskasoni | Yes | No Certification | No Certification | Yes | Level I | No Certification |
| 9 | Fort Folly | Yes | Not Required | Not Required | No | Not Required | Not Required |
| 11 | Kingsclear | Yes | No Certification | No Certification | Yes | No Certification | No Certification |
| 2 | Lennox Island | Yes | No Certification | No Certification | No | No Operator | No Operator |
| 6 | Madawaska Maliseet First Nation | NR | Not Required | Not Required | No | Not Required | Not Required |
| 26 | Membertou | NR | Not Required | Not Required | No | Not Required | Not Required |
| 14 | Metepenagiag Mikmaq Nation | Yes | No Certification | Level I | No | No Operator | No Operator |
| 47 | Miawpukek | Yes | No Certification | No Certification | Yes | No Certification | No Certification |
| 47 | Miawpukek | Yes | Level I | No Certification | Yes | No Certification | No Certification |
| 27 | Millbrook First Nation | NR | Not Required | Not Required | No | Not Required | Not Required |
| 32 | Mushuau Innu First Nation | Yes | No Certification | No Certification | Yes | No Certification | No Certification |
| 12 | Oromocto | NR | Not Required | Not Required | No | Not Required | Not Required |
| 19 | Paqtnkek First Nation | Yes | No Certification | No Certification | Yes | No Certification | No Certification |
| 24 | Pictou Landing First Nation | Yes | No Certification | No Certification | No | No Operator | No Operator |
| 15 | Saint Mary's | NR | Not Required | Not Required | No | Not Required | Not Required |
| 33 | Sheshatshiu Innu First Nation | Yes | Level I | Level I | Yes | No Certification | No Certification |
| 25 | Shubenacadie | Yes | Level II | Level I | Yes | No Certification | No Certification |
| 16 | Tobique | Yes | Level I | No Certification | No | No Operator | No Operator |
| 28 | Wagmatcook | Yes | No Certification | No Certification | No | No Operator | No Operator |
| 28 | Wagmatcook | Yes | No Certification | No Certification | No | No Operator | No Operator |
| 29 | Waycobah First Nation | Yes | Not Required | Not Required | Yes | Not Required | Not Required |
| 17 | Woodstock | Yes | No Certification | No Certification | No | No Operator | No Operator |
Appendix E: Risk Summary
Appendix E.1: Individual First Nation Water Risk Summary
| Risk Level | |
|---|---|
| High Risk | 8.0 - 10.0 |
| Medium Risk | 5.0 - 7.0 |
| Low Risk | 1.0 - 4.0 |
| Band # | Band Name | System # | System Name | Water Source | Treatment Class | Source Risk | Design Risk | Operations Risk | Report Risk | Operator Risk | Final Risk Score |
|---|---|---|---|---|---|---|---|---|---|---|---|
| 1 | Abegweit | 12499 | MORELL NO. 2 | Ground- water |
None | 4.0 | 2.0 | 9.0 | 10.0 | 10.0 | 8.0 |
| 1 | Abegweit | 12479 | ROCKY POINT NO. 3 | Ground- water |
None | 4.0 | 8.0 | 10.0 | 10.0 | 9.0 | 8.6 |
| 1 | Abegweit | 12459 | SCOTCHFORT NO.4, Site #06002 | Ground- water |
None | 4.0 | 8.0 | 9.0 | 10.0 | 3.0 | 8.0 |
| 20 | Annapolis Valley | 6474 | CAMBRIDGE NO. 32 | Ground- water |
None | 4.0 | 1.0 | 5.0 | 5.0 | 2.0 | 3.1 |
| 4 | Buctou- che |
17002 | CWS | Ground- water |
None | 6.0 | 5.0 | 7.0 | 10.0 | 2.0 | 5.6 |
| 5 | Burnt Church |
6467 | BURNT CHURCH NO. 14 | Ground- water |
None | 6.0 | 4.0 | 6.0 | 7.0 | 1.0 | 4.5 |
| 7 | Eel Ground | 6468 | EEL GROUND NO. 2 | Ground- water |
None | 7.0 | 8.0 | 5.0 | 8.0 | 1.0 | 5.6 |
| 3 | Elsipog- tog First Nation |
6465 | RICHIBUCTO NO. 15 | Ground- water |
None | 6.0 | 8.0 | 5.0 | 10.0 | 1.0 | 5.7 |
| 23 | Eskasoni | 6476 | ESKASONI NO. 3A | Ground- water |
None | 7.0 | 4.0 | 5.0 | 10.0 | 1.0 | 4.6 |
| 2 | Lennox Island | NEW001 | LENNOX ISLAND WATER SYSTEM | Ground- water |
None | 4.0 | 1.0 | 4.0 | 2.0 | 1.0 | 2.3 |
| 14 | Metepe- nagiag Mikmaq Nation |
6470 | RED BANK NO. 4 | Ground- water |
None | 6.0 | 3.0 | 8.0 | 10.0 | 1.0 | 5.1 |
| 19 | Paqtnkek First Nation | NEW001 | PETOW SUBDIVISION PUMPHOUSE | Ground- water |
Level II | 7.0 | 4.0 | 6.0 | 10.0 | 7.0 | 6.1 |
| 19 | Paqtnkek First Nation | 6473 | POMQUET AND AFTON NO. 23 (Pumphouse #1) | Ground- water |
None | 7.0 | 5.0 | 6.0 | 10.0 | 1.0 | 5.2 |
| 24 | Pictou Landing First Nation | 6478 | FISHER'S GRANT NO. 24 | Ground- water |
None | 9.0 | 5.0 | 5.0 | 10.0 | 1.0 | 5.1 |
| 33 | Shesh- atshiu Innu First Nation |
7103 | Sheshatshiu Water Treatment Plant | Ground- water |
None | 5.0 | 8.0 | 7.0 | 9.0 | 1.0 | 6.1 |
| 25 | Shube- nacadie |
6481 | INDIAN BROOKI.R. NO. 14 | Ground- water |
Level II | 7.0 | 5.0 | 8.0 | 10.0 | 1.0 | 5.8 |
| 25 | Shube- nacadie |
NEW ROSS PUMPHOUSE | Ground- water |
Small System | 9.0 | 10.0 | 8.0 | 10.0 | 1.0 | 8.0 | |
| 16 | Tobique | 6471 | TOBIQUE NO. 20 | Ground- water |
None | 9.0 | 5.0 | 5.0 | 10.0 | 3.0 | 5.5 |
| 28 | Wagma- tcook |
6477 | WAGMAT- COOK NO. 1 |
Ground- water |
Level II | 4.0 | 4.0 | 8.0 | 10.0 | 2.0 | 5.4 |
| 29 | Wayco- bah First Nation |
6479 | WHYCO- COMAGH NO. 2 |
Ground- water |
None | 6.0 | 6.0 | 6.0 | 10.0 | 1.0 | 5.4 |
| 11 | Kings- clear |
6469 | KINGSCLEAR NO. 6 | Ground- water GUDI |
None | 9.0 | 5.0 | 5.0 | 10.0 | 1.0 | 5.1 |
| 13 | Pabineau | 9816 | PABINEAU NO. 11 | Ground- water GUDI |
Level I | 10.0 | 8.0 | 8.0 | 10.0 | 10.0 | 8.8 |
| 17 | Wood- stock |
6472 | WOODSTOCK NO. 23 | Ground- water GUDI |
None | 9.0 | 7.0 | 7.0 | 10.0 | 1.0 | 6.3 |
| 18 | Acadia | MTA | MTA | MTA | 1.0 | 1.0 | 3.0 | 1.0 | 1.0 | 1.6 | |
| 8 | Eel River Bar First Nation | 17003 | Eel River 3 | MTA | MTA | 1.0 | 1.0 | 5.0 | 3.0 | 10.0 | 4.2 |
| 9 | Fort Folly | FORT FOLLY MTA WATER SYSTEM | MTA | MTA | 1.0 | 1.0 | 1.0 | 1.0 | 1.0 | 1.0 | |
| 30 | Glooscap First Nation | NEW001 | GLOOSCAP MTA WATER SYSTEM | MTA | MTA | 1.0 | 8.0 | 1.0 | 1.0 | 1.0 | 3.1 |
| 6 | Mada- waska Maliseet First Nation |
NEW003 | WATER MTA | MTA | MTA | 1.0 | 1.0 | 2.0 | 3.0 | 1.0 | 1.5 |
| 26 | Member- tou |
NEW001 | MTA WATER SYSTEM | MTA | MTA | 1.0 | 1.0 | 1.0 | 1.0 | 1.0 | 1.0 |
| 27 | Millbrook First Nation | MTA | MTA | MTA | 1.0 | 1.0 | 3.0 | 1.0 | 1.0 | 1.6 | |
| 12 | Oromocto | 17004 | CWS | MTA | MTA | 1.0 | 1.0 | 1.0 | 1.0 | 1.0 | 1.0 |
| 15 | Saint Mary's | NEW001 | WATER SYSTEM | MTA | MTA | 1.0 | 1.0 | 1.0 | 1.0 | 1.0 | 1.0 |
| 22 | Chapel Island First Nation | 6475 | CHAPEL ISLAND NO. 5 | Surface Water | Level II | 9.0 | 8.0 | 8.0 | 6.0 | 10.0 | 8.3 |
| 47 | Miaw- pukek |
6480 | SAMIAJIJ MIAWPUKEK water treatment system | Surface Water | Level I | 9.0 | 3.0 | 8.0 | 10.0 | 1.0 | 5.4 |
| 32 | Mushuau Innu First Nation | MUSHUAU WATER TREATMENT PLANT | Surface Water | Level II | 9.0 | 3.0 | 4.0 | 3.0 | 10.0 | 5.3 |
Appendix E.2: Individual First Nation Wastewater Risk Summary
| Risk Level | |
|---|---|
| High Risk | 8.0 - 10.0 |
| Medium Risk | 5.0 - 7.0 |
| Low Risk | 1.0 - 4.0 |
| Band # | Band Name | System # | System Name | Recei- ver Type |
Treat- ment Class |
Efflu- ent Risk |
Design Risk | Opera- tions Risk |
Report Risk | Oper- ator Risk | Final Risk Score |
|---|---|---|---|---|---|---|---|---|---|---|---|
| 22 | Chapel Island First Nation | 7249 | CHAPEL ISLAND NO. 5 | Creek | Level II | 7.0 | 2.0 | 5.0 | 4.0 | 10.0 | 5.5 |
| 11 | Kingsclear | 7243 | KINGSCLEAR NO. 6 | Creek | Level I | 8.0 | 8.0 | 10.0 | 10.0 | 9.0 | 8.9 |
| 25 | Shubena- cadie |
7255 | INDIAN BROOK I.R. NO. 14 | Creek | Level II | 7.0 | 5.0 | 7.0 | 10.0 | 1.0 | 5.6 |
| 23 | Eskasoni | 7250 | Eskasoni No. 3 Wastewater Treatment Plant | Lake, reservoir | Level II | 9.0 | 3.0 | 5.0 | 10.0 | 8.0 | 6.4 |
| 33 | Sheshat- shiu Innu First Nation |
7644 | Sheshatsiu Wastewater Treatment Plant | Lake, reservoir | Level I | 10.0 | 6.0 | 5.0 | 10.0 | 2.0 | 6.1 |
| 28 | Wagmat- cook |
0 | WAGMAT- COOK RBC |
Lake, reservoir | Level II | 10.0 | 3.0 | 5.0 | 10.0 | 10.0 | 7.0 |
| 14 | Metepe- nagiag Mikmaq Nation |
7244 | RED BANK NO. 4 | Large river | Level I | 6.0 | 4.0 | 8.0 | 10.0 | 6.0 | 6.4 |
| 32 | Mushuau Innu First Nation | 0 | MUSHUAU WASTEWATER TREATMENT PLANT | Large river | Level I | 5.0 | 6.0 | 8.0 | 1.0 | 10.0 | 6.6 |
| 17 | Woodstock | 7246 | WOODSTOCK NO. 23 | Large river | Level II | 4.0 | 8.0 | 10.0 | 10.0 | 9.0 | 8.1 |
| 18 | Acadia | 0 | MTA | MTA | MTA | 1.0 | 1.0 | 1.0 | 1.0 | 1.0 | 1.0 |
| 8 | EelRiver Bar First Nation | 0 | EelRiver 3 | MTA | MTA | 3.0 | 3.0 | 7.0 | 1.0 | 1.0 | 3.4 |
| 9 | Fort Folly | 0 | FORT FOLLY MTA WASTEWATER SYSTEM | MTA | MTA | 1.0 | 2.0 | 6.0 | 1.0 | 1.0 | 2.5 |
| 6 | Mada- waska Maliseet First Nation |
NEW002 | WASTEWATER MTA | MTA | MTA | 1.0 | 1.0 | 3.0 | 1.0 | 1.0 | 1.5 |
| 26 | Membertou | NEW002 | MTA WASTEWATER SYSTEM | MTA | MTA | 1.0 | 2.0 | 2.0 | 1.0 | 1.0 | 1.5 |
| 27 | Millbrook First Nation | 0 | MTA | MTA | MTA | 1.0 | 1.0 | 3.0 | 1.0 | 1.0 | 1.5 |
| 12 | Oromocto | NEW001 | WASTEWATER SYSTEM | MTA | MTA | 1.0 | 1.0 | 1.0 | 1.0 | 1.0 | 1.0 |
| 15 | Saint Mary's | NEW002 | WASTEWATER SYSTEM | MTA | MTA | 1.0 | 1.0 | 1.0 | 1.0 | 1.0 | 1.0 |
| 29 | Waycobah First Nation | NEW001 | WYHCO- COMAGH NO. 2 (MTA) |
MTA | MTA | 1.0 | 2.0 | 7.0 | 10.0 | 2.0 | 3.8 |
| 2 | Lennox Island | 14139 | LENNOX ISLAND NO. 1 | Open marine | Level II | 4.0 | 2.0 | 5.0 | 10.0 | 9.0 | 5.3 |
| 47 | Miawpukek | 0 | BURNT WOODS COMMUNAL SYSTEM | Open marine | Small System | 2.0 | 8.0 | 7.0 | 10.0 | 5.0 | 6.1 |
| 47 | Miawpukek | 7254 | SAMIAJIJ MIAWPUKEK - wastewater treatment system | Open marine | Level I | 2.0 | 5.0 | 10.0 | 10.0 | 5.0 | 6.1 |
| 24 | Pictou Landing First Nation | 7252 | FISHER'S GRANT NO. 24 | Open marine | Level II | 4.0 | 8.0 | 9.0 | 10.0 | 9.0 | 7.8 |
| 5 | Burnt Church | 7241 | BURNT CHURCH NO. 14 | River | Level I | 7.0 | 6.0 | 8.0 | 10.0 | 10.0 | 7.9 |
| 7 | Eel Ground | 7242 | EEL GROUND NO. 2 | River | Level I | 7.0 | 6.0 | 10.0 | 10.0 | 6.0 | 7.6 |
| 3 | Elsipogtog First Nation | 7240 | RICHIBUCTO NO. 15 | River | Level I | 6.0 | 8.0 | 7.0 | 10.0 | 1.0 | 6.1 |
| 19 | Paqtnkek First Nation | 7247 | POMQUET AND AFTON NO. 23 | River | Level III | 7.0 | 4.0 | 7.0 | 10.0 | 10.0 | 7.1 |
| 16 | Tobique | 7245 | TOBIQUE NO. 20 | River | Level I | 7.0 | 5.0 | 9.0 | 10.0 | 2.0 | 6.3 |
| 28 | Wagmat- cook |
7251 | WAGMAT- COOK NO. 1 |
Wetland | Level I | 4.0 | 8.0 | 10.0 | 10.0 | 8.0 | 7.9 |
Appendix F: Protocol and Servicing Costs
| Band # | Band Name | Community Name | Current Population | Current Homes | Forecast Population | Forecast Homes | Zone Markup |
|---|---|---|---|---|---|---|---|
| 1 | Abegweit | Morell No. 2 | 28 | 9 | 32 | 10 | 0.983 |
| 1 | Abegweit | Rocky Point No. 3 | 50 | 16 | 56 | 18 | 0.983 |
| 1 | Abegweit | Scotchfort No. 4 | 136 | 44 | 154 | 50 | 0.983 |
| 18 | Acadia | Acadia | 338 | 114 | 458 | 174 | 0.900 |
| 20 | Annapolis Valley | Cambridge | 127 | 57 | 175 | 81 | 0.972 |
| 21 | Bear River | Bear River No. 6 | 141 | 43 | 187 | 58 | 0.900 |
| 4 | Buctouche | Buctouche No. 16 | 104 | 37 | 143 | 56 | 1.074 |
| 5 | Burnt Church | Burnt Church No. 14 | 1346 | 310 | 1653 | 386 | 1.074 |
| 22 | Chapel Island First Nation | Chapel Island | 618 | 156 | 817 | 222 | 1.027 |
| 7 | Eel Ground | Eel Ground No. 2 | 709 | 185 | 966 | 270 | 0.983 |
| 8 | Eel River Bar First Nation | Eel River No. 3 | 431 | 156 | 551 | 216 | 0.983 |
| 3 | Elsipogtog First Nation | Richibucto No. 15 | 2595 | 720 | 3258 | 941 | 1.074 |
| 23 | Eskasoni | Eskasoni | 3700 | 954 | 4586 | 1249 | 1.027 |
| 9 | Fort Folly | Fort Folly No. 1 | 35 | 22 | 43 | 30 | 0.983 |
| 30 | Glooscap First Nation | Glooscap | 108 | 22 | 127 | 26 | 0.972 |
| 10 | Indian Island | Indian Island No. 28 | 92 | 45 | 98 | 48 | 1.074 |
| 11 | Kingsclear | Kingsclear | 803 | 185 | 1056 | 248 | 1.048 |
| 2 | Lennox Island | Lennox Island | 484 | 121 | 647 | 161 | 1.074 |
| 6 | Madawaska Maliseet First Nation | St Basile | 149 | 80 | 199 | 130 | 1.048 |
| 26 | Membertou | Membertou No. 28B | 959 | 312 | 1253 | 410 | 0.940 |
| 14 | Metepenagiag Mikmaq Nation | Red Bank No. 4 | 487 | 159 | 675 | 221 | 0.983 |
| 47 | Miawpukek | Miawpukek First Nation | 961 | 305 | 1189 | 381 | 1.263 |
| 27 | Millbrook First Nation | Millbrook First Nation | 921 | 367 | 1208 | 510 | 0.972 |
| 32 | Mushuau Innu First Nation | Mushuau Innu First Nation | 975 | 170 | 1675 | 345 | 2.126 |
| 12 | Oromocto | Oromocto No. 26 | 352 | 98 | 500 | 147 | 1.048 |
| 13 | Pabineau | Pabineau No. 11 | 131 | 65 | 178 | 88 | 0.983 |
| 19 | Paqtnkek First Nation | Pomquet and Afton No. 23 | 427 | 125 | 551 | 166 | 0.972 |
| 24 | Pictou Landing First Nation | Pictou Landing First Nation | 554 | 151 | 744 | 214 | 0.972 |
| 15 | Saint Mary's | Devon No. 30 | 912 | 250 | 1158 | 332 | 1.048 |
| 33 | Sheshatshiu Innu First Nation | Sheshatshiu | 2108 | 350 | 2973 | 566 | 1.221 |
| 25 | Shubenacadie | Indian Brook No. 14 | 1333 | 347 | 1512 | 406 | 0.972 |
| 16 | Tobique | Tobique No. 20 | 1691 | 358 | 2116 | 464 | 1.145 |
| 28 | Wagmatcook | Wagmatcook | 786 | 154 | 864 | 173 | 1.027 |
| 29 | Waycobah First Nation | Whycocomagh No. 2 | 925 | 260 | 1208 | 354 | 1.027 |
| 17 | Woodstock | Woodstock | 340 | 91 | 450 | 127 | 1.048 |
| Band # | Band Name | Upgrade To Protocol | Per Lot Upgrades to Protocol (Current Homes) | Recom- mended Servicing |
Per Lot Recom- mended Servicing (Forecast Homes) |
Recom- mended O&M |
Per Lot O&M (Forecast Homes) |
|---|---|---|---|---|---|---|---|
| 1 | Abegweit | $325,000 | $36,100 | $262,000.00 | $26,200 | $81,000 | $8,100 |
| 1 | Abegweit | $305,000 | $19,100 | $275,000.00 | $15,300 | $89,000 | $4,900 |
| 1 | Abegweit | $525,000 | $11,900 | $1,410,000.00 | $28,200 | $155,000 | $3,100 |
| 18 | Acadia | $ | $ | $1,690,000.00 | $9,700 | $540,000 | $3,100 |
| 20 | Annapolis Valley | $408,500 | $7,200 | $1,020,000.00 | $12,600 | $310,000 | $3,800 |
| 21 | Bear River | $ | $ | $620,000.00 | $10,700 | $230,000 | $4,000 |
| 4 | Buctouche | $2,013,000 | $54,400 | $4,470,000.00 | $79,800 | $150,000 | $2,700 |
| 5 | Burnt Church | $4,402,000 | $14,200 | $11,640,000.00 | $30,200 | $740,000 | $1,900 |
| 22 | Chapel Island First Nation | $551,500 | $3,500 | $3,090,000.00 | $13,900 | $530,000 | $2,400 |
| 7 | Eel Ground | $697,500 | $3,800 | $2,540,000.00 | $9,400 | $380,000 | $1,400 |
| 8 | Eel River Bar First Nation | $10,000 | $100 | $2,530,000.00 | $11,700 | $690,000 | $3,200 |
| 3 | Elsipogtog First Nation | $3,179,000 | $4,400 | $15,400,000.00 | $16,400 | $830,000 | $900 |
| 23 | Eskasoni | $4,083,000 | $4,300 | $14,430,000.00 | $11,600 | $1,100,000 | $900 |
| 9 | Fort Folly | $44,000 | $2,000 | $840,000.00 | $28,000 | $160,000 | $5,300 |
| 30 | Glooscap First Nation | $ | $ | $360,000.00 | $13,800 | $200,000 | $7,700 |
| 10 | Indian Island | $ | $ | $120,000.00 | $2,500 | $175,000 | $3,600 |
| 11 | Kingsclear | $790,000 | $4,300 | $9,100,000.00 | $36,700 | $340,000 | $1,400 |
| 2 | Lennox Island | $229,500 | $1,900 | $1,470,000.00 | $9,100 | $450,000 | $2,800 |
| 6 | Madawaska Maliseet First Nation | $ | $ | $1,840,000.00 | $14,200 | $290,000 | $2,200 |
| 26 | Membertou | $ | $ | $5,000,000.00 | $12,200 | $580,000 | $1,400 |
| 14 | Metepenagiag Mikmaq Nation | $1,805,000 | $11,400 | $3,640,000.00 | $16,500 | $460,000 | $2,100 |
| 47 | Miawpukek | $1,559,500 | $5,100 | $10,250,000.00 | $26,900 | $1,140,000 | $3,000 |
| 27 | Millbrook First Nation | $15,000 | $ | $6,050,000.00 | $11,900 | $580,000 | $1,100 |
| 32 | Mushuau Innu First Nation | $8,163,000 | $48,000 | $40,580,000.00 | $117,600 | $670,000 | $1,900 |
| 12 | Oromocto | $15,000 | $200 | $2,440,000.00 | $16,600 | $590,000 | $4,000 |
| 13 | Pabineau | $1,100,000 | $16,900 | $2,790,000.00 | $31,700 | $340,000 | $3,900 |
| 19 | Paqtnkek First Nation | $480,500 | $3,800 | $3,240,000.00 | $19,500 | $500,000 | $3,000 |
| 24 | Pictou Landing First Nation | $5,272,000 | $34,900 | $8,170,000.00 | $38,200 | $500,000 | $2,300 |
| 15 | Saint Mary's | $20,000 | $100 | $3,870,000.00 | $11,700 | $1,060,000 | $3,200 |
| 33 | Sheshatshiu Innu First Nation | $1,430,000 | $4,100 | $14,310,000.00 | $25,300 | $750,000 | $1,300 |
| 25 | Shubenacadie | $1,216,000 | $3,500 | $3,770,000.00 | $9,300 | $710,000 | $1,700 |
| 16 | Tobique | $510,500 | $1,400 | $11,260,000.00 | $24,300 | $650,000 | $1,400 |
| 28 | Wagmatcook | $771,000 | $5,000 | $2,080,000.00 | $12,000 | $560,000 | $3,200 |
| 29 | Waycobah First Nation | $1,535,000 | $5,900 | $11,970,000.00 | $33,800 | $680,000 | $1,900 |
| 17 | Woodstock | $799,000 | $8,800 | $2,670,000.00 | $21,000 | $510,000 | $4,000 |