Indigenous Services Canada Report on the Mandatory Minimum 5% Target fiscal year 2022 to 2023
Table of contents
- Introduction
- Methodology
- Results
- Lessons Learned and Future Work
- Annex A: Goods and Services (by Reporting Object) Procured by Federal Organizations in 2022 to 2023
- Annex B: Goods and Services Procured by Federal Organizations in 2022 to 2023
- Annex C: Planned Procurements of Goods and Services by Federal Organizations for 2023 to 2024
- Annex D: Goods and Services Where Indigenous Business Capacity Gaps Exist
- Annex E: Best Practices Employed by Federal Organizations to Support the Mandatory Minimum 5% Target
1. Introduction
Background
As part of the Government of Canada's commitment to contribute to improving socio-economic outcomes by increasing opportunities for First Nations, Inuit and Métis businesses through the federal procurement process, on August 6, 2021, Canada announced the establishment of a new procurement target to ensure that a minimum of 5% of the total value of federal contracts are awarded to Indigenous businesses. This mandatory requirement applies to Government of Canada departments and agencies (hereinafter referred to as organizations) listed in Schedules I, I.1 and II of the Financial Administration Act, unless otherwise excluded by other acts, regulations or order-in-council.
Under the Directive on the Management of Procurement, organizations must ensure that a minimum of 5% of the total value of the contracts they award are held by Indigenous businesses annually. This requirement is being phased in over 3 years, and full implementation is expected by the end of fiscal year 2024 to 2025.
The timeline to achieve the minimum mandatory 5% target is as follows:
- Phase 1: 32 organizations scheduled to meet or exceed the 5% target by fiscal year 2022 to 2023
- Phase 2: 20 organizations scheduled to meet or exceed the 5% target by fiscal year 2023 to 2024
- Phase 3: 44 organizations scheduled to meet or exceed the 5% target by fiscal year 2024 to 2025
Policy Requirement and Work to Date
To account for the Government of Canada's achievements against the mandatory minimum target, organizations are required to submit their annual performance reports to Indigenous Services Canada (ISC) within 6 months after fiscal year end. ISC would subsequently publish this information within 12 months after fiscal year end. Organizations are also required to submit to ISC their deputy head-approved annual procurement plans for meeting minimum target of 5%.
Since the launch of the mandatory minimum target, ISC has received performance (results) data for 2022 to 2023 and procurement plans for meeting the mandatory minimum target for 2023 to 2024 and 2024 to 2025 fiscal years.
What We Heard:
"It doesn't matter what they (Department, Government of Canada, etc.) say, I want to see proof, I want to see results. I want to see this in writing so that in 10 years this problem isn't exactly the same."
The objective of this report is to highlight key findings from the 2022 to 2023 performance (results) data and the 2023 to 2024 procurement planning data.
2. Methodology
How is an Indigenous business defined for the purposes of the mandatory minimum target?
For the purposes of the minimum mandatory 5% target, an Indigenous business is defined as:
- A business owned and operated by Elders, band and tribal councils
- A business registered in the Government of Canada's Indigenous Business Directory
- A business registered on a modern treaty beneficiary business list
Contracts awarded to businesses that fall outside of this definition do not count towards the minimum 5% target. For a contract to count towards the minimum 5% target, the contract recipient must have been confirmed to be an Indigenous business as defined above.
Which contracts count towards the mandatory minimum 5% target?
Any contract or subcontract awarded to a business which meets the definition above can count towards the minimum 5% target. This can include various procurement mechanisms, such as:
- Contracts awarded under Procurement Strategy for Indigenous Businesses (PSIB) set-asides
- Contracts awarded to beneficiaries of modern treaty to meet procurement obligations of applicable Modern Treaties
- Contracts awarded to Indigenous businesses registered on the Indigenous Business Directory (IBD) or a beneficiary of a Modern Treaty
- Other types of contracting opportunities that departments may track and that meet the same criteria for Indigenous businesses, for example subcontracting opportunities awarded to Indigenous businesses or contracts entered into by acquisition cards valued at $10,000.00 or less
How is the total value of contracts awarded to Indigenous businesses calculated?
The total value of contracts awarded to Indigenous businesses annually is calculated as a percentage of the aggregated value of contracts awarded by each department.
The percentage is determined by calculating the total value of contracts awarded to Indigenous businesses during the fiscal year (A) divided by the total value of all contracts awarded during the fiscal year (B) less deputy head-approved exceptions (C)Footnote 1 for that fiscal year, and multiplying the result by 100. This figure is used to measure results in, and plans for, meeting the minimum 5% target.
3. Results
3.1. Government-Wide Performance (Results) Data for 2022 to 2023 Fiscal Year
Overall, government-wide performance reports for 2022 to 2023 show successes against the 5% minimum mandatory target by organizations, by phases and by the Government of Canada as a whole. In 2022 to 2023, the Government of Canada awarded $33.5Footnote 2 billion in contracts to Indigenous and non-Indigenous businesses. $1.6 billion, or 6.27%, of all contracts were awarded to Indigenous businesses.
| Phase number | Value of Contracts Awarded to Indigenous Businesses (A) |
Value of All Contracts Awarded (B) |
Value of Deputy Head-Approved Exceptions (C) |
|---|---|---|---|
| 1 | $888,216,606 | $11,414,863,085 | $366,354,820 |
| 2 | $102,495,210 | $2,282,094,580 | $565,012,876 |
| 3 | $641,614,297 | $19,836,052,470 | $6,582,813,855 |
| Total | $1,632,326,114 | $33,533,010,135 | $7,514,181,551 |
| Phase Number | Number and Percentage of Organizations that Met the Target | Number and Percentage of Organizations that Did Not Meet the Target | Number and Percentage of Organizations with N/A |
|---|---|---|---|
| 1 | 28 (87.5%) | 4 (12.5%) | 0 |
| 2 | 14 (70%) | 6 (30%) | 0 |
| 3Table note 1 | 26 (60.5%) | 16 (37.2%) | 1 (2.3%)Table note 2 |
|
|||
How did Phase 1 organizations perform?
Overall Phase 1 federal organizations which were expected to meet the mandatory minimum target of 5% in 2022 to 2023 have reported success.
28 of the 32 organizations (88%) in Phase 1 met or exceeded the mandatory minimum 5% target.
- 14 organizations (56%) spent 10% or higher of the total value of all contracts awarded to Indigenous businesses
- 4 organizations (12.5%) spent 30% or higher of the total value of all contracts awarded to Indigenous businesses
- Financial Consumer Agency of Canda, the highest-ranking organization in Phase 1, contracted nearly half of the value of their total contracts for 2022 to 2023 fiscal year with Indigenous businesses
| Organization | Percentage of Contracts Awarded to Indigenous Business | Value of Contracts Awarded to Indigenous Businesses (A) |
Value of All Contracts Awarded (Expenditure SizeTable note 1) (B) |
Value of Deputy Head- Approved Exceptions (C) |
|---|---|---|---|---|
| Financial Consumer Agency of Canada | 47.6% | $8,587,803 | $18,051,028 (Medium) |
$0 |
| Polar Knowledge Canada | 35.7% | $574,329 | $1,608,125 (Small) |
$0 |
| Parole Board of Canada | 33.5% | $1,052,525 | $3,143,995 (Small) |
$0 |
| Shared Services Canada | 19.3% | $476,294,368 | $2,466,910,459 (Very Large) |
$0 |
| Patented Medicine Prices Review Board Canada | 18.4% | $245,219 | $1,329,643 (Small) |
$0 |
|
||||
What are organizations, which did not meet the target, doing to ensure success in the future?
Four organizations in Phase 1 did not meet the mandatory minimum target of 5%. The size of the organization and capacity constraints introduced by organizational changes may be contributing factors. Despite challenges, they are finding innovative ways to advance the initiative and efforts are in place to help bring improved outcomes for the 2023 to 2024 fiscal year.
| Organization | Results for 2022 to 2023 | Value of All Contracts Awarded (Expenditure Size) (B) |
Value of Contracts Awarded to Indigenous Businesses (A) |
Value of Deputy Head- Approved Exceptions (C) |
|---|---|---|---|---|
| Canadian Radio-Television and Telecommunications Commission | 2.1% | $5,576,004 (Small) |
$118,134 | $0 |
| Office of the Chief Electoral Officer (Elections Canada) | 3.8% | $101,697,079 (Large) |
$3,867,501 | $0 |
| Public Services and Procurement Canada | 2.7% | $5,150,115,224 (Very Large) |
$139,048,765 | $0 |
| Treasury Board of Canada Secretariat | 1.5% | $96,616,505 (Medium) |
$1,433,090 | $0 |
Canadian Radio-Television and Telecommunications Commission (CRTC)
CRTC awarded 2.1% of the total value of its contracts to Indigenous businesses in 2022 to 2023. During that fiscal year, the CRTC's procurement team was undergoing organizational change and had minimal capacity. The CRTC has taken the steps to ensure that at least 5% of the total value of awarded contracts go to Indigenous businesses. The procurement team has identified sectors and projects that it will guide toward Indigenous businesses. It has begun to collect information on what goods and services can be procured from Indigenous businesses depending on the CRTC's needs. For example, the CRTC's IT sector has actively searched for authorized Indigenous resellers. Frequently acquired goods and services will be transferred to these authorized resellers to keep consistent procurement practices with Indigenous businesses. The CRTC will be taking a more aggressive approach to identifying opportunities to award contracts to Indigenous businesses in 2023 to 2024.
Office of the Chief Electoral Officer (Elections Canada)
Elections Canada awarded 3.8% of the total value of its contracts to Indigenous businesses in 2022 to 2023. While the target was not met in this fiscal year, the agency achieved a 100% improvement over results from 2021 to 2022. All procurement and contracting services employees completed the Indigenous Considerations in Procurement course with the Canada School of Public Service. The mandatory minimum target of 5% was made a corporate priority; all procurement planning and requests now require the consideration of possible Indigenous procurement strategies.
Public Services and Procurement Canada (PSPC)
Organizations with large volumes of procurement transactions, large projects and budgets, like PSPC, have more significant challenges related to Indigenous business capacity. PSPC awarded 2.7% of the $5.15 billion total procurement value to Indigenous businesses in 2022 to 2023. While the target was not met, PSPC has taken steps in support of achieving the mandatory minimum 5% target.
PSPC initiated an Indigenous business first strategy for Lower Dollar Value (LDV) procurements (contracts valued at $3.75 million or less) undertaken across the country. Where procurements could not, or would not, be considered for Indigenous businesses first, departmental policy required that explanations be added to the procurement file. Initiation of the Indigenous business first strategy for LDV procurements resulted in $46.0 million of $736.5 million, or 6.2% of LDV contracts going to Indigenous businesses.
PSPC delivered outreach and educational services to procurement officers through PSPC's senior designated official for the management of procurement, and through its coordinator for procurement with Indigenous businesses. It hosted or participated in 403 events tailored towards Indigenous‑led businesses over the fiscal year. In 2022 to 2023, PSPC led or co‑led 13 national and regional Indigenous business information sessions. Work continues to align a number of departmental governance bodies and departmental processes to ensure that there is a commitment to advancing this initiative through an employee culture of understanding and reconciliation.
Treasury Board of Canada Secretariat (TBS)
TBS has taken significant actions to help meet the mandatory minimum 5% target beginning in 2023 to 2024. It has added contracting and procurement to its integrated business planning process, transformed and restructured the procurement team to support Indigenous contracts and integrated business planning, and reinforced practices that require project authorities to consider Indigenous businesses. TBS has also ensured procurement officers complete mandatory training on the Canada School of Public Service entitled Indigenous Considerations in Procurement and used internal systems and messaging to create awareness and to promote and identify Indigenous businesses, especially in top TBS commodity and contracting areas.
Overall, all 4 organizations have made the mandatory minimum 5% target a corporate priority, focused on changing the procurement culture through outreach and educational services to contracting authorities, reinforcing practices that require project authorities to consider Indigenous businesses and using internal systems and messaging to create awareness and to promote and identify Indigenous businesses.
How are organizations in Phases 2 and 3 performing?
Although Phases 2 and 3 are scheduled to meet the mandatory minimum 5% target in 2023 to 2024 fiscal year and 2024 to 2025 fiscal year respectively, these organizations provided performance results for 2022 to 2023 and developed procurement plans. Reports received to date show encouraging results.
In 2022 to 2023, 14 of 20 (70%) organizations in Phase 2 and 26 of 43 (60%) of organizations in Phase 3 met or exceeded the 5% target.
- 19 out of 63 (30%) organizations spent 10% or higher of the total value of all contracts to Indigenous businesses
- 16 out of 63 (25%) organizations spent 20% or higher of the total value of all contracts to on Indigenous businesses
- Administrative Tribunals Support Service of Canada, the highest-ranking organization in Phase 2, contracted nearly 40% of the total value of contracts awarded to all businesses to Indigenous businesses
- Farm Products Council of Canada, the highest-ranking organization in Phase 3, contracted nearly half of the value of their total contracts for 2022 to 2023 with Indigenous businesses. Other top performers in Phase 3 also report impressive numbers
| Organization | Percentage of Contracts Awarded to Indigenous Business | Value of Contracts Awarded to Indigenous Business (A) |
Value of All Contracts Awarded (Expenditure Size) (B) |
Value of Deputy Head- Approved Exceptions (C) |
|---|---|---|---|---|
| Administrative Tribunals Support Service of Canada | 39.9% | $3,227,314 | $8,073,209 (Small) |
$0 |
| Social Sciences and Humanities Research Council | 33.4% | $3,013,104 | $9,014,139 (Small) |
$0 |
| Natural Sciences and Engineering Research Council | 31.7% | $3,032,918 | $9,568,210 (Small) |
$0 |
| Canadian Human Rights Commission | 19.0% | $1,136,637 | $5,957,428 (Small) |
$0 |
| Library and Archives Canada | 14.6% | $2,195,750 | $14,946,298 (Medium) |
$0 |
| Organization | Percentage of Contracts Awarded to Indigenous Business | Value of Contracts Awarded to Indigenous Businesses (A) |
Value of All Contracts Awarded (Expenditure Size) (B) |
Value of Deputy Head- Approved Exceptions (C) |
|---|---|---|---|---|
| Farm Products Council of Canada | 47.7% | $36,997 | $77,509 (Very Small) |
$0 |
| Office of the Information Commissioner | 40.1% | $542,553 | $1,351,649 (Small) |
$0 |
| Office of the Privacy Commissioner | 29.8% | $1,111,850 | $3,725,889 (Small) |
$0 |
| Civilian Review and Complaints Commission for the RCMP | 27.7% | $411,999 | $1,484,003 (Small) |
$0 |
| Canadian Northern Economic Development Agency | 22.0% | $119,640 | $542,177 (Small) |
$0 |
Why are some organizations performing well?
Organizations with large volumes of procurement transactions, large projects and budgets may have more significant challenges related to Indigenous business capacity. 2022 to 2023 results dataFootnote 3 illustrates that 12 out of the 15 top performers in the 3 phases are small or very small organizations. As ISC builds baseline data and receives feedback through engagements, it aims to build the necessary evidence base to determine success factors, which could have broader policy and procedural implications.
Overall, planning and process changes, including government wide procurement officer training, are helping enable Government of Canada to better deliver against the mandatory minimum target. Organizations continue to reimagine departmental procurement in order to maximize Indigenous participation. They are finding and implementing innovative policy and operational approaches to support Indigenous procurement. They are increasing outreach events directed to Indigenous businesses, and adapting events to the specific needs of a community, commodity group etc. See Annex E for a list of best practices.
What are deputy head-approved exceptions and where are they being applied?
In exceptional circumstances, where departments' operational requirements constrain promoting opportunities for Indigenous businesses and are of a substantial monetary value which would have a significant impact on the achievement of the mandatory minimum target of 5%, then such exceptions are permitted upon approval at the deputy head's discretion.
TBS recommends:
- Exceptions are to be applied sparingly and not as a common practice
- Exceptions are to be approved annually by the deputy head and not be automatically carried forward
- Where exceptions are applied, departments are to consider developing a mitigation strategy to avoid seeking an exception for future procurements, where appropriate
- Where an exception has been granted, departments should consider development and inclusion of an Indigenous Participation Plan
While guidance from TBS to support departments' application of deputy head-approved exceptions will continue to be refined, the decision on whether and how to apply an exception is ultimately at the discretion of the deputy head.
In 2022 to 2023, $7.5 billion in deputy head-approved exceptions were applied under the following broad areas: overseas operations, emergency crisis, national security, research and development (space projects), commissionaires, interpreter/transcription contracts, royalties and rights payments, legal database, publications and periodicals, software licenses and proprietary systems.
Data provided to ISC illustrates that the use of deputy head-approved exceptions is not excessive. 17 out of 95 organizations (17.7%) used deputy head-approved exceptions. It is noteworthy that 85.8% of the deputy head-approved exceptions were employed by the Department of National Defense, at $6.45 billion of the $7.5 billion total exceptions. The remaining 16 organizations combined represent 14.2% of the $1.01 billion in deputy head-approved exceptions.
| Organization | Total Value of Deputy Head Approved Exceptions | % of Total Deputy Head Approved Exceptions |
|---|---|---|
| Department of National Defence | $6,447,024,797 | 85.8% |
| All other departments | $1,067,156,754 | 14.2% |
| Total | $7,514,181,551 | 100% |
In which areasFootnote 4 were Government of Canada contracts held by Indigenous businesses in 2022 to 2023?
Performance data for 2022 to 2023 illustrates commodity/service areas where Government of Canada contracts were held with Indigenous businesses. Table 8 presents commodity/services by reporting object name where the total procurement value is greater than $15 million and represents only contracts over $10,000. Informatics Services, Informatics Equipment and Office Equipment and Furniture are the top 3 areas (by reporting object names). See Annex A for a full list.
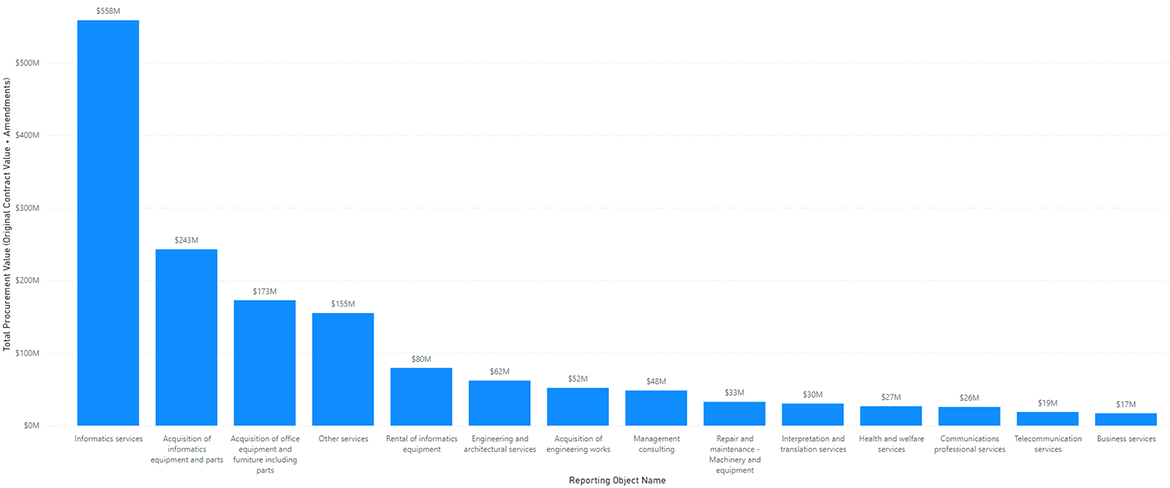
Text alternative for Table 8: Goods and Services (by Reporting Object) Procured in 2022 to 2023
A graph showing the total procurement value (Original contract value + amendments) by Goods and Services category.
- Informatics services: $558 million
- Acquisition of informatics equipment and parts: $243 million
- Acquisition of office equipment and furniture including parts: $173 million
- Other services: $155 million
- Rental of informatics equipment: $80 million
- Engineering and architectural services: $62 million
- Acquisition of engineering works: $52 million
- Management consulting: $48 million
- Repair and maintenance - Machinery and equipment: $33 million
- Interpretation and translation services: $30 million
- Health and welfare services: $27 million
- Communications professional services: $26 million
- Telecommunication services: $19 million
- Business services: $17 million
Informatics Services represented the highest value of contract awards to Indigenous businesses, nearly equaling the combined value of the following 3 types of goods or services. Further work is needed to understand whether these contracts are effective in meeting program objectives to build Indigenous business capacity through access to procurement opportunities.
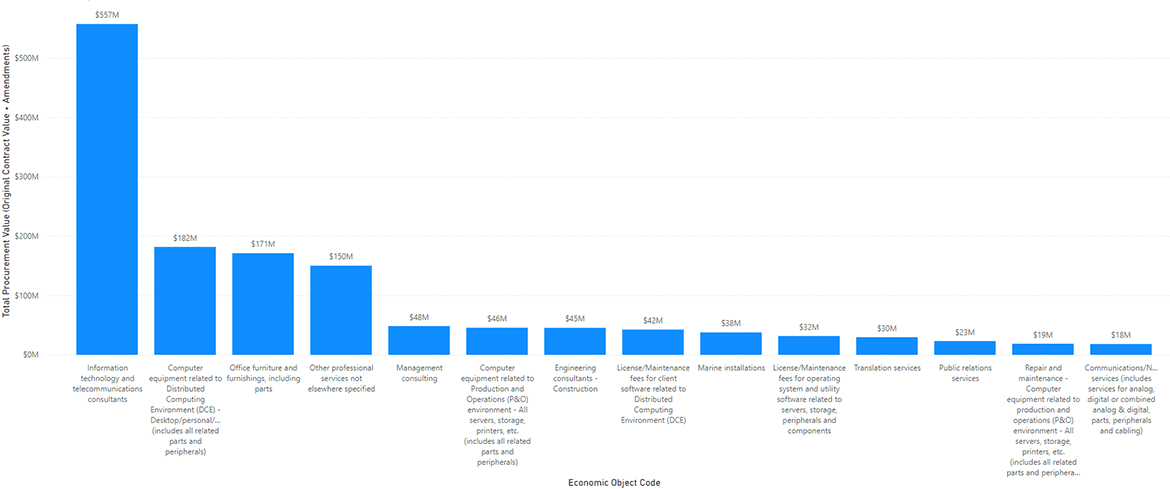
Table 9 presents goods and services broken into a sub-category, by economic objectFootnote 5, where the total value of contracts awarded to Indigenous businesses was greater than $15 million and represents only contracts over $10,000. Information technology and telecommunication consultants, particular computer equipment purchases, and office furnishings make the top 3 economic objects (see Annex B for a full list). ISC is exploring a further breakdown of data (e.g., by average size of contracts, delivery location).
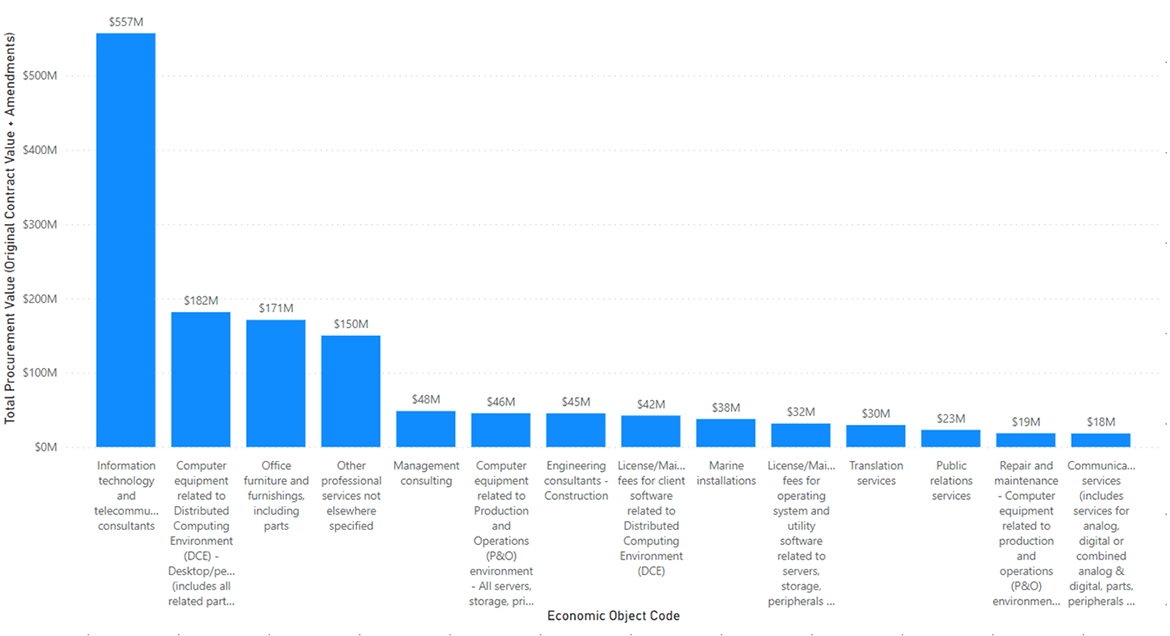
Text alternative for Table 9: Goods and Services (by Economic Object) Procured in 2022 to 2023
A graph showing the total procurement value (Original contract value + amendments) by Economic Object Code
- Information technology and telecommunications consultants: $557 million
- Computer equipment related to Distributed Computing Environment (DCE) - Desktop/personal/portable (includes all related parts and peripherals): $182 million
- Office furniture and furnishings, including parts: $171 million
- Other professional services not elsewhere specified: $150 million
- Management consulting: $48 million
- Computer equipment related to Production and Operations (P and O) environment - All servers, storage, printers, etc. (includes all related parts and peripherals): $46 million
- Engineering consultants - Construction: $45 million
- License/Maintenance fees for client software related to Distributed Computing Environment (DCE): $42 million
- Marine installations: $38 million
- License/Maintenance fees for operating system and utility software related to servers, storage, peripherals and components: $32 million
- Translation services: $30 million
- Public relations services: $23 million
- Repair and maintenance - Computer equipment related to production and operations (P and O) environment - All servers, storage, printers, etc. (includes all related parts and peripherals): $19 million
- Communications/Network services (includes services for analog, digital or combined analog and digital, parts, peripherals and cabling): $18 million
Impact of Information Technology (IT) professional services and other IT resellers
IT procurement, and IT professional services contracting, particularly when it includes a set aside under the PSIB program, has been the subject of intense public scrutiny in recent months. Certainly, this report will include contracts with businesses involved in various types of IT professional services and sales, such as IT resellers. IT resellers are involved in the purchasing of software, hardware or any other services from a manufacturer or any other entity, including wholesaler and distributor and then they sell these purchased goods and services to the consumer. Some buy and sell the product without adding value to the product. Others purchase an existing product, customize and configure it to suit the requirements of clients and then finally sell it to the client.
ISC will continue to explore ways to transform future procurement policies and strategies. ISC is continuing engagements with Indigenous businesses and economic development organizations in order to understand whether these types of IT contracting relationships are meeting their needs and expectations for building community capacity. For example, the department is analyzing alternatives to set asides and stronger monitoring and enforcement requirements for IPPs as ways to improve control, Indigenous business capacity-building and accountabilities in federal contracts.
Since departments and agencies submitted reports in September 2023, this report may include results from companies, who have since been removed from the IBD as they no longer meet the eligibility criteria for PSIB and IBD registration. The IBD list is regularly reviewed and deletions from the list can occur any time as needed. It is important to note the fiscal year 2022 to 2023 data published is a snapshot in time.
3.2. Procurement Planning Data for 2023 to 2024 Fiscal Year
The time between a tender opening and closing can be brief, and procurement planning information can assist Indigenous businesses in preparing for potential tender notices. Procurement planning can also assist federal procurement officials in identifying efforts to ensure that legal obligations are met (such as procurement obligations arising from modern treaties) and to determine when Indigenous procurement measures (such as Indigenous Participation Plans) can be most appropriately and effectively included in the procurement strategy. In some cases, federal organizations are unable to identify Indigenous businesses with capacity, availability and interest to bid for or win a contract. With the procurement planning data, ISC can identify gaps between the need and available Indigenous businesses. In November 2023, ISC shared with Indigenous partners a high-level summary of the Federal Departments' and Agencies' Procurement Plans 2023 to 2024, which was well received. As it was the first procurement planning data, extensive data validation and analysis was required, and key trends are highlighted in this report. Moving forward, ISC's goal is to provide these highlights earlier in the fiscal year, which would allow Indigenous institutions, businesses and other parties to proactively engage with Indigenous communities in order to prepare for future opportunities in the supply chain.
What We Heard:
"Planning data is a missing key – Indigenous partners need to know in advance what procurements are needed to be able to adequately plan."
In which areas are organizations planning to procure with Indigenous businesses in 2023 to 2024Footnote 6?
Planning data for 2023 to 2024 illustrates where Indigenous business capacity is greatestFootnote 7 (See Table 10). Information equipment and parts, office equipment and furniture including parts and informatics services are the top 3 areas (by reporting object) where Government of Canada is planning to procure from Indigenous businesses. Broad good/service reporting objects such as Informatics equipment and parts can be broken down into multiple economic objects, which represent specific goods and services (e.g., keyboards, monitors) (See Annex C for details by Economic Objects).
Text alternative for Table 10: Goods and Services (by Reporting Object) Federal Organizations Plan to Procure in 2023 to 2024
A graph showing the number of organizations who plan to procure specific Goods and Services by Reporting Object
- Acquisition of informatics equipment and parts: 42
- Acquisition of office equipment and furniture including parts: 36
- Informatics services: 31
- Temporary help services: 19
- Other services: 18
- Business services: 14
- Management consulting: 14
- Rental of informatics equipment: 14
- Miscellaneous goods and products: 13
- Interpretation and translation services: 12
- Training and educational services: 9
- Scientific and research services: 6
- Communications professional services: 5
In which areas may Indigenous businesses not be activeFootnote 8 in 2023 to 2024?
Planning data for 2023 to 2024 also illustrates where Indigenous business capacity gap is greatest (see Table 11). Informatics services, Other professional services, and Business services are the top 3 areas (by reporting object names) where Indigenous businesses are not active in federal procurement. It is notable that some of the same categories appear as areas where organizations have plans to procure but also where Indigenous business gaps exist; further analysis is required. See Annex D for a further breakdown of commodity categories into economic objects.
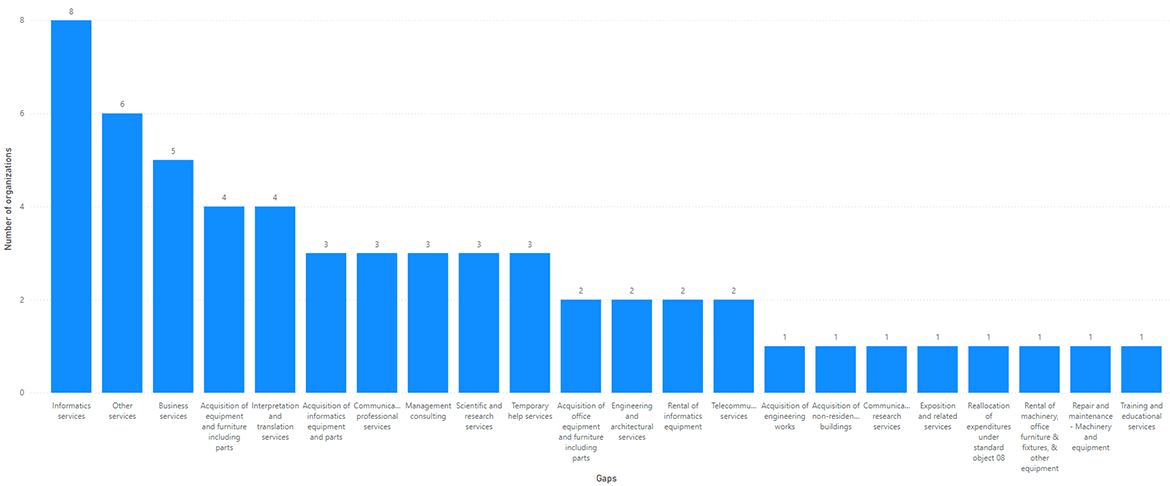
Text alternative for Table 11: Commodities/Services (by Reporting Object Name) Where Indigenous Business Capacity Gaps Exist
A graph showing the number of organizations who identified Indigenous capacity gaps by commodities/services (by Reporting Object)
- Informatics services: 8
- Other services: 6
- Business services: 5
- Acquisition of equipment and furniture including parts: 4
- Interpretation and translation services: 4
- Acquisition of informatics equipment and parts: 3
- Communications professional services: 3
- Management consulting: 3
- Scientific and research services: 3
- Temporary help services: 3
- Acquisition of office equipment and furniture including parts: 2
- Engineering and architectural services: 2
- Rental of informatics equipment: 2
- Telecommunication services: 2
- Acquisition of engineering works: 1
- Acquisition of non-residential buildings: 1
- Communications research services: 1
- Reallocation of expenditures under standard object 08: 1
- Exposition and related services: 1
- Rental of machinery, office furniture and fixtures and other equipment: 1
- Repair and maintenance - Machinery and equipment: 1
- Training and educational services: 1
Projected target for 2023 to 2024 and analysis by phase
A comparison between 2022 to 2023 results and 2023 to 2024 planning data could indicate whether federal organizations are planning on buying more from Indigenous businesses. While it is too early to state this definitively, preliminary analysis indicates Government of Canada is expecting to increase contracts with Indigenous businesses.
In 2022 to 2023, 68 organizations (72%) met or exceeded the target and 28 did not. For fiscal year 2023 to 2024, 72 out of 95 organizations (76%) reported they plan to meet the mandatory minimum 5% targetFootnote 9. Thirteen organizations reported they will not meet the target the same year; and, 11 departments, who mostly fall under Phase 3, did not provide planning data. With 76%Footnote 10 of federal organizations projecting they will meet the target, ISC expects that Government of Canada will be buying more from Indigenous businesses.
An analysis by phase also illustrates the same result.
- For Phase 1, 2 organizations reported they will not meet the target. One organization did not provide planning data. Among the four Phase 1 organizations that did not meet the target in 2022 to 2023, 3 are planning on meeting or exceeding the 5% target in 2023 to 2024
- For Phase 2, 1 organization reported they will not meet the target. One organization did not provide planning data. Among the6 Phase 2 organizations that did not meet the target in 2022 to 2023, 4 are planning on meeting or exceeding the 5% target in 2023 to 2024
- For Phase 3, 10 organizations reported they will not meet the target. Nine organizations did not provide planning data. Among the 16 Phase 3 organizations that did not meet the target in 2022 to 2023, 5 are planning on meeting or exceeding the 5% target in 2023 to 2024
4. Lessons Learned and Future Work
The minimum mandatory 5% target has improved visibility of Indigenous procurement and increased demand for contracts with Indigenous businesses. More work is still needed to connect Indigenous business capacity to opportunities.
ISC has heard that there is a need for the federal government to improve its data collection practices and reporting to better connect Indigenous businesses with opportunities; ISC continues to improve its data strategy to:
- Provide further disaggregated data around economic objects, which will provide a comprehensive list of areas where federal organizations procure
- Provide delivery location (province or territory) of goods and services and geographic information to help provide Indigenous partners a better sense of upcoming business opportunitiesFootnote 11
- Provide qualitative data capturing efforts to assess Indigenous business availability and steps taken to identify Indigenous business capacity
- Speak to efforts in place to mitigate Indigenous business capacity and planned outreach
Once baseline data is developed, ISC will be able to:
- Compare yearly procurement plans and identify trends, opportunities and gaps
- Compare yearly procurement results and assess progress since the launch of the target
- Compare procurement plans with Indigenous businesses against the total value of contract awards to Indigenous businesses
Indigenous partners must be involved as ISC builds its longer-term data strategy. ISC has already heard that distinctions-based and business sector data is important for Indigenous partners. ISC will explore the inclusion of distinctions-based data (e.g., First Nations, Inuit and Métis peoples) in future reports.
Indigenous businesses also want information in relation to how many Indigenous people were employed and how many sub-contractors were involved in a given project, how businesses qualified as Indigenous and where Indigenous peoples were engaged in the project. ISC continues to explore ways to improve data collection tools and as other data preferences emerge through engagement activities with Indigenous business owners, ISC is gaining a better insight into what Indigenous partners need and will continue to explore these as part of the longer-term data strategy.
What We Heard
"We want to know what portion of contracts are being awarded to Indigenous businesses. We need to know the ratio of success […] Where are Indigenous businesses failing and succeeding? A breakdown of who has been awarded, and that it is valid Indigenous businesses being awarded… I want to know what my chances are to be able to respond."
Finally, evidence is critical for improving policy effectiveness. Optimizing data can help inform a longer-term, transformative procurement strategy. By exploring the collection of a broader range of data (e.g., distinctions based, contract sizeFootnote 12, geographic location, etc.), the Government of Canada can develop more tailored policies and improve internal practices. Since ISC (Transformative Indigenous Strategy Division) does not collect data on the socio-economic outcomes, it is not able to demonstrate whether these contracting opportunities are in fact generating economic growth and supporting improved outcomes for Indigenous communities. A longer-term data strategy to measure impacts would need to take into consideration the current systems in place, potential need for modifications to existing systems, or new systems.
What We Heard
"The total dollar value and the number of contracts awarded should contribute to the 5% mandate. If you want to support smaller businesses that are Indigenous owned, we need the smaller contracts as well."
For Indigenous communities, "It is important to look at the bigger picture towards reconciliation… Being creative with [their] value system and how [they] measure success should be considered at the government level when trying to evaluate the 5%. (ISC Engagement Session)" Recognizing Indigenous partners' central role in the minimum 5% target and fostering a culture of awareness, trust and understanding are invaluable in growing Indigenous businesses and improving the socio-economic conditions of Indigenous communities.
Annex A: Goods and Services (by Reporting Object) Procured by Federal Organizations in 2022 to 2023
| Reporting Object Code | Reporting Object Name | Approximate Total Value of Contract Awards |
|---|---|---|
| 47 | Informatics services | Over $550 million |
| 122 | Acquisition of informatics equipment and parts | Over $240 million |
| 123 | Acquisition of office equipment and furniture including parts | Over $170 million |
| 89 | Other services | Over $155 million |
| 52 | Rental of informatics equipment | Over $79 million |
| 42 | Engineering and architectural services | Over $60 million |
| 131 | Acquisition of engineering works | Over $50 million |
| 48 | Management consulting | Over $45 million |
| 65 | Repair and maintenance - Machinery and equipment | Over $32 million |
| 87 | Interpretation and translation services | Over $30 million |
| 45 | Health and welfare services | Over $26 million |
| 35 | Communications professional services | Over $25 million |
| 22 | Telecommunication services | Over $18 million |
| 40 | Business services | Over $17 million |
| 56 | Rental of aircraft and ships | Over $13 million |
| 112 | Mineral products | Over $11 million |
| 60 | Repair and maintenance - Engineering works | Over $8 million |
| 26 | Travel - Non-public servants | Over $7 million |
| 43 | Scientific and research services | Over $6 million |
| 63 | Repair and maintenance - Buildings | Over $5 million |
| 86 | Temporary help services | Over $4 million |
| 137 | Acquisition of residential buildings | Over $3.9 million |
| 21 | Postage, freight, express, and cartage | Over $3.4 million |
| 124 | Acquisition of equipment and furniture including parts | Over $3 million |
| 44 | Training and educational services | Over $2.5 million |
| 126 | Acquisition of other vehicles and parts | Over $2.2 million |
| 134 | Acquisition of non-residential buildings | Over $1.4 million |
| 117 | Miscellaneous goods and products | Over $900,000 |
| 53 | Rental of machinery, office furniture and fixtures and other equipment | Over $670,000 |
| 54 | Rental of motor and other vehicles | Over $610,000 |
| 111 | Food, feed, beverages and tobacco | Over $605,000 |
| 113 | Chemical products | Over $577,000 |
| 30 | Advertising services | Over $570,000 |
| 33 | Exposition and related services | Over $394,000 |
| 121 | Acquisition of machinery and machinery parts | Over $390,000 |
| 36 | Subscriptions and data access services | Over $324,000 |
| 46 | Protection services | Over $227,000 |
| 34 | Communications research services | Over $139,000 |
| 88 | Construction services | Over $117,000 |
| 57 | Rental - Other | Over $113,000 |
| 130 | Acquisition of land | Over $102,000 |
| 25 | Travel - Public Servants | Over $69,000 |
| 32 | Printing and imaging services | Over $57,000 |
| 50 | Rental of land | Over $40,000 |
| 125 | Acquisition of aircraft and ships, including parts | Over $40,000 |
| 31 | Publishing services | Over $40,000 |
| 51 | Rental of buildings | Over $39,000 |
| 82 | Special fees and services | Over $31,000 |
| 114 | Wood, paper and wood products | Over $29,000 |
| 116 | Metals and metal products | Over $24,000 |
| 70 | Utility services | Over $17,000 |
| 41 | Legal services | Over $16,000 |
Annex B: Goods and Services Procured by Federal Organizations in 2022 to 2023
| Economic Object Code | Economic Object | Approximate Dollar Value |
|---|---|---|
| 473 | Information technology and telecommunications consultants | Over $550 million |
| 1283 | Computer equipment related to Distributed Computing Environment (DCE) - Desktop/personal/portable (includes all related parts and peripherals) | Over $180 million |
| 1231 | Office furniture and furnishings, including parts | Over $170 million |
| 499 | Other professional services not elsewhere specified | Over $150 million |
| 491 | Management consulting | Over $48 million |
| 1282 | Computer equipment related to Production and Operations (P and O) environment - All servers, storage, printers, etc. (includes all related parts and peripherals) | Over $45 million |
| 422 | Engineering consultants - Construction | Over $45 million |
| 582 | License/Maintenance fees for client software related to Distributed Computing Environment (DCE) | Over $42 million |
| 1310 | Marine installations | Over $37 million |
| 584 | License/Maintenance fees for operating system and utility software related to servers, storage, peripherals and components | Over $31 million |
| 494 | Translation services | Over $29 million |
| 352 | Public relations services | Over $23 million |
| 672 | Repair and maintenance - Computer equipment related to production and operations (P and O) environment - All servers, storage, printers, etc. (includes all related parts and peripherals) | Over $18 million |
| 223 | Communications/Network services (includes services for analog, digital or combined analog and digital, parts, peripherals and cabling) | Over $18 million |
| 452 | Welfare services | Over $14 million |
| 423 | Engineering consultants - Other | Over $14 million |
| 561 | Rental of aircraft | Over $13 million |
| 859 | Other business services not elsewhere specified | Over $13 million |
| 454 | Paramedical personnel | Over $10 million |
| 1124 | Diesel fuel | Over $8 million |
| 664 | Repair and maintenance - Communications/Networking equipment (includes analog, digital and combined analog/digital equipment, cabling, parts and peripherals) | Over $8 million |
| 628 | Repair and maintenance - Other engineering works | Over $7 million |
| 261 | Non-public servant travel - Operational activities | Over $7 million |
| 492 | Research contracts | Over $5 million |
| 1316 | Roads, highways and airport runways | Over $5 million |
| 819 | Non-professional personal service contracts not elsewhere specified | Over $4 million |
| 1284 | Client software related to Distributed Computing Environment (DCE) | Over $4 million |
| 1339 | Other engineering works | Over $4 million |
| 1335 | Bridges, trestles, culverts, overpasses and viaducts | Over $4 million |
| 813 | Temporary help services | Over $4 million |
| 1370 | Residential buildings | Over $3 million |
| 1285 | Application software (including COTS) and application development and delivery software | Over $3 million |
| 401 | Accounting and audit services | Over $3 million |
| 210 | Transportation of things not elsewhere specified | Over $3 million |
| 656 | Repair and maintenance - Heating, air-conditioning and refrigeration equipment | Over $3 million |
| 1223 | Image/Video communications equipment (includes telepresence/video conferencing equipment, cabling, parts and peripherals) | Over $3 million |
| 645 | Repair and maintenance - Other buildings | Over $2 million |
| 583 | License/Maintenance fees for application software (including COTS) and application development and delivery software | Over $2 million |
| 351 | Communications professional services not elsewhere specified | Over $2 million |
| 585 | License/Maintenance fees for networking software | Over $2 million |
| 1289 | Communications/Networking equipment (includes analog, digital and combined analog/digital equipment, cabling, parts and peripherals) | Over $2 million |
| 673 | Repair and maintenance - Computer equipment related to Distributed Computing Environment (DCE) - Desktop/personal/portable (includes all related parts and peripherals) | Over $2 million |
| 1246 | Other furniture and fixtures including parts | Over $1 million |
| 1123 | Aviation fuel | Over $1 million |
| 1239 | Other office equipment and parts | Over $1 million |
| 1261 | Road motor vehicles | Over $1 million |
| 451 | Other health services not elsewhere specified | Over $1 million |
| 446 | Training consultants | Over $1 million |
| 611 | Repair and maintenance - Waterworks and sewage systems | Over $1 million |
| 630 | Repair and maintenance - Office buildings | Over $1 million |
| 421 | Architectural services | Over $1 million |
| 1249 | Other equipment and Parts | Over $1 million |
| 1364 | Laboratories | Over $1 million |
| 812 | Computer services (includes IT solutions/deliverables as well as IT managed services) | Over $790,000 |
| 1287 | Networking software | Over $790,000 |
| 493 | Interpretation services | Over $717,000 |
| 533 | Rental of machinery, office furniture and fixtures and other equipment | Over $673,000 |
| 1264 | Other vehicles | Over $649,000 |
| 540 | Rental of motor and other vehicles | Over $611,000 |
| 1115 | Miscellaneous food, food materials and food preparations | Over $605,000 |
| 1132 | Pharmaceutical and other medicinal products | Over $577,000 |
| 301 | Advertising services | Over $570,000 |
| 430 | Scientific services | Over $556,000 |
| 1122 | Gasoline | Over $548,000 |
| 1291 | Image/Video communications software (includes telepresence/video conferencing software) | Over $547,000 |
| 231 | Data communications services | Over $534,000 |
| 497 | Services related to the care and maintenance of contaminated sites | Over $528,000 |
| 1179 | Miscellaneous manufactured articles | Over $526,000 |
| 646 | Repair and maintenance - Residential buildings | Over $523,000 |
| 447 | Tuition fees and costs of attending courses including seminars not elsewhere specified | Over $498,000 |
| 665 | Repair and maintenance - Other equipment | Over $486,000 |
| 448 | Purchase of training packages and courses | Over $462,000 |
| 1172 | Office and stationers supplies | Over $444,000 |
| 1360 | Buildings or installations for telecommunications, computer and/or office systems | Over $421,000 |
| 522 | Rental of image/video communications equipment (includes telepresence/video conferencing equipment, cabling, parts and peripherals) | Over $413,000 |
| 639 | Repair and maintenance - Institutional buildings | Over $410,000 |
| 420 | Engineering services not elsewhere specified | Over $400,000 |
| 1211 | Special industry machinery | Over $390,000 |
| 474 | Information management services | Over $358,000 |
| 431 | Scientific consultants | Over $345,000 |
| 332 | Audio-visual services | Over $334,000 |
| 362 | Data and database access services | Over $242,000 |
| 496 | Services related to the remediation of contaminated sites | Over $228,000 |
| 460 | Protection services | Over $227,000 |
| 811 | Contracted building cleaning | Over $210,000 |
| 607 | Repair and maintenance - Highways, roads and streets | Over $195,000 |
| 1399 | Acquisition of land, buildings and works - Reallocation of capital expenditures | Over $176,000 |
| 660 | Repair and maintenance - Measuring, controlling, laboratory, medical and optical instruments, apparatus and accessories | Over $149,000 |
| 1243 | Measuring, controlling, laboratory, medical and optical equipment and parts | Over $146,000 |
| 341 | Communications research services | Over $139,000 |
| 881 | Construction services | Over $117,000 |
| 570 | Rental - Other | Over $113,000 |
| 495 | Services related to the assessment of potentially contaminated sites | Over $109,000 |
| 1301 | Acquisition of land | Over $102,000 |
| 1242 | Electric lighting, distribution and control equipment and Parts | Over $93,000 |
| 1286 | Operating system and utility software related to servers, storage, peripherals and components | Over $84,000 |
| 361 | Electronic subscriptions and electronic publications | Over $82,000 |
| 440 | Education - Non-public servants | Over $76,000 |
| 634 | Repair and maintenance - Commercial buildings | Over $76,000 |
| 566 | Rental of ships | Over $73,000 |
| 251 | Public servant travel - Operational activities | Over $69,000 |
| 635 | Repair and maintenance - Industrial buildings | Over $66,000 |
| 675 | Repair and maintenance - Ships and boats | Over $65,000 |
| 1125 | Light fuel oil | Over $64,000 |
| 213 | Courier services | Over $62,000 |
| 892 | Recreational services | Over $60,000 |
| 331 | Exposition services | Over $60,000 |
| 321 | Printing services | Over $57,000 |
| 232 | Image/Video communications services (includes telepresence/video conferencing services) | Over $52,000 |
| 444 | Teachers and instructors on contract | Over $52,000 |
| 501 | Rental of land | Over $40,000 |
| 1251 | Aircraft parts | Over $40,000 |
| 311 | Publishing services | Over $40,000 |
| 405 | Real property services | Over $39,000 |
| 511 | Rental of office buildings | Over $39,000 |
| 263 | Non-public servant travel - Internal governance | Over $34,000 |
| 1143 | Printed matter, including books, newspapers, pictures, manuscripts and forms | Over $29,000 |
| 1160 | Ferrous metals | Over $24,000 |
| 1263 | Road motor vehicles parts | Over $23,000 |
| 1369 | Other non-residential buildings | Over $23,000 |
| 445 | Tuition fees for courses where employees take training on their own time | Over $21,000 |
| 1245 | Safety and sanitation equipment and parts | Over $19,000 |
| 619 | Repair and maintenance - Electric power installations | Over $19,000 |
| 705 | Waste disposal | Over $17,000 |
| 821 | Membership fees | Over $16,000 |
| 410 | Legal services | Over $16,000 |
| 822 | Hospitality | Over $14,000 |
| 1171 | Medical supplies, instruments, and apparatus | Over $13,000 |
| 1267 | Miscellaneous vehicles parts, including tires and tubes | Over $11,000 |
| 1286 | Operating system and utility software related to servers, storage, peripherals and components | Over $10,000 |
Annex C: Planned Procurements of Goods and Services by Federal Organizations for 2023 to 2024
| Economic Object Code | Economic Object | Number of Organizations |
|---|---|---|
| 1231 | Office furniture and furnishings, including parts | 36 |
| 1283 | Computer equipment related to Distributed Computing Environment (DCE) - Desktop/personal/portable (includes all related parts and peripherals) | 33 |
| 473 | Information technology and telecommunications consultants | 29 |
| 813 | Temporary help services | 19 |
| 499 | Other professional services not elsewhere specified | 16 |
| 1282 | Computer equipment related to Production and Operations (P and O) environment - All servers, storage, printers, etc. (includes all related parts and peripherals) | 15 |
| 491 | Management consulting | 14 |
| 1172 | Office and stationers supplies | 12 |
| 494 | Translation services | 11 |
| 446 | Training consultants | 8 |
| 859 | Other business services not elsewhere specified | 8 |
| 582 | License/Maintenance fees for client software related to Distributed Computing Environment (DCE) | 7 |
| 1285 | Application software (including COTS) and application development and delivery software | 6 |
| 401 | Accounting and audit services | 5 |
| 583 | License/Maintenance fees for application software (including COTS) and application development and delivery software | 5 |
| 321 | Printing services | 4 |
| 351 | Communications professional services not elsewhere specified | 4 |
| 492 | Research contracts | 4 |
| 493 | Interpretation services | 4 |
| 341 | Communications research services | 3 |
| 475 | Information technology services | 3 |
| 585 | License/Maintenance fees for networking software | 3 |
| 822 | Hospitality | 3 |
| 1223 | Image/Video communications equipment (includes telepresence/video conferencing equipment, cabling, parts and peripherals) | 3 |
| 1239 | Other office equipment and parts | 3 |
| 301 | Advertising services | 2 |
| 404 | Communications services | 2 |
| 406 | Material services | 2 |
| 422 | Engineering consultants - Construction | 2 |
| 423 | Engineering consultants - Other | 2 |
| 430 | Scientific services | 2 |
| 892 | Recreational services | 2 |
| 1179 | Miscellaneous manufactured articles | 2 |
| 1284 | Client software related to Distributed Computing Environment (DCE) | 2 |
| 1289 | Communications/Networking equipment (includes analog, digital and combined analog/digital equipment, cabling, parts and peripherals) | 2 |
| 210 | Transportation of things not elsewhere specified | 1 |
| 332 | Audio-visual services | 1 |
| 352 | Public relations services | 1 |
| 402 | Human resources management services | 1 |
| 405 | Real property services | 1 |
| 407 | Acquisition services | 1 |
| 410 | Legal services | 1 |
| 447 | Tuition fees and costs of attending courses including seminars not elsewhere specified | 1 |
| 448 | Purchase of training packages and courses | 1 |
| 452 | Welfare services | 1 |
| 460 | Protection services | 1 |
| 533 | Rental of machinery, office furniture and fixtures and other equipment | 1 |
| 561 | Rental of aircraft | 1 |
| 584 | License/Maintenance fees for operating system and utility software related to servers, storage, peripherals and components | 1 |
| 640 | Repair and maintenance - Buildings and/or installations for telecommunications, computers and/or electronic/automated office systems | 1 |
| 665 | Repair and maintenance - Other equipment | 1 |
| 812 | Computer services (includes IT solutions/deliverables as well as IT managed services) | 1 |
| 819 | Non-professional personal service contracts not elsewhere specified | 1 |
| 823 | Conference fees | 1 |
| 881 | Construction services | 1 |
| 1142 | Paper and paperboard | 1 |
| 1143 | Printed matter, including books, newspapers, pictures, manuscripts and forms | 1 |
| 1249 | Other equipment and Parts | 1 |
| 1286 | Operating system and utility software related to servers, storage, peripherals and components | 1 |
| 1340 | Office buildings | 1 |
| 1358 | Other institutional buildings | 1 |
| 1370 | Residential buildings | 1 |
Annex D: Goods and Services Where Indigenous Business Capacity Gaps Exist
| Economic Object Code | Economic Object | Number of Organizations |
|---|---|---|
| 1231 | Office furniture and furnishings, including parts | 36 |
| 1283 | Computer equipment related to Distributed Computing Environment (DCE) - Desktop/personal/portable (includes all related parts and peripherals) | 33 |
| 473 | Information technology and telecommunications consultants | 29 |
| 813 | Temporary help services | 19 |
| 499 | Other professional services not elsewhere specified | 16 |
| 1282 | Computer equipment related to Production and Operations (P and O) environment - All servers, storage, printers, etc. (includes all related parts and peripherals) | 15 |
| 491 | Management consulting | 14 |
| 1172 | Office and stationers supplies | 12 |
| 494 | Translation services | 11 |
| 446 | Training consultants | 8 |
| 859 | Other business services not elsewhere specified | 8 |
| 582 | License/Maintenance fees for client software related to Distributed Computing Environment (DCE) | 7 |
| 1285 | Application software (including COTS) and application development and delivery software | 6 |
| 401 | Accounting and audit services | 5 |
| 583 | License/Maintenance fees for application software (including COTS) and application development and delivery software | 5 |
| 321 | Printing services | 4 |
| 351 | Communications professional services not elsewhere specified | 4 |
| 492 | Research contracts | 4 |
| 493 | Interpretation services | 4 |
| 341 | Communications research services | 3 |
| 475 | Information technology services | 3 |
| 585 | License/Maintenance fees for networking software | 3 |
| 822 | Hospitality | 3 |
| 1223 | Image/Video communications equipment (includes telepresence/video conferencing equipment, cabling, parts and peripherals) | 3 |
| 1239 | Other office equipment and parts | 3 |
| 301 | Advertising services | 2 |
| 404 | Communications services | 2 |
| 406 | Material services | 2 |
| 422 | Engineering consultants - Construction | 2 |
| 423 | Engineering consultants - Other | 2 |
| 430 | Scientific services | 2 |
| 892 | Recreational services | 2 |
| 1179 | Miscellaneous manufactured articles | 2 |
| 1284 | Client software related to Distributed Computing Environment (DCE) | 2 |
| 1289 | Communications/Networking equipment (includes analog, digital and combined analog/digital equipment, cabling, parts and peripherals) | 2 |
| 210 | Transportation of things not elsewhere specified | 1 |
| 332 | Audio-visual services | 1 |
| 352 | Public relations services | 1 |
| 402 | Human resources management services | 1 |
| 405 | Real property services | 1 |
| 407 | Acquisition services | 1 |
| 410 | Legal services | 1 |
| 447 | Tuition fees and costs of attending courses including seminars not elsewhere specified | 1 |
| 448 | Purchase of training packages and courses | 1 |
| 452 | Welfare services | 1 |
| 460 | Protection services | 1 |
| 533 | Rental of machinery, office furniture and fixtures and other equipment | 1 |
| 561 | Rental of aircraft | 1 |
| 584 | License/Maintenance fees for operating system and utility software related to servers, storage, peripherals and components | 1 |
| 640 | Repair and maintenance - Buildings and/or installations for telecommunications, computers and/or electronic/automated office systems | 1 |
| 665 | Repair and maintenance - Other equipment | 1 |
| 812 | Computer services (includes IT solutions/deliverables as well as IT managed services) | 1 |
| 819 | Non-professional personal service contracts not elsewhere specified | 1 |
| 823 | Conference fees | 1 |
| 881 | Construction services | 1 |
| 1142 | Paper and paperboard | 1 |
| 1143 | Printed matter, including books, newspapers, pictures, manuscripts and forms | 1 |
| 1249 | Other equipment and Parts | 1 |
| 1286 | Operating system and utility software related to servers, storage, peripherals and components | 1 |
| 1340 | Office buildings | 1 |
| 1358 | Other institutional buildings | 1 |
| 1370 | Residential buildings | 1 |
Annex E: Best Practices Employed by Federal Organizations to Support the Mandatory Minimum 5% Target
This annex highlights some best practices employed by Federal organizations to increase the total value of contracts awarded to Indigenous businesses.
- Utilizing an "Indigenous by default" approach in departmental procurement
- In 2022 to 2023, Canada Revenue Agency (CRA), adopted a conditional set-aside approach to all competitive procurements. This means that procurement is open to Indigenous and non-Indigenous businesses, however, if 2 or more Indigenous businesses submit compliant bids, CRA will limit the competition to those Indigenous businesses and will not consider bids from any non-Indigenous businesses that may have been submitted. CRA continues to limit the procurement of all information technology end-user devices to Indigenous businesses by default
- Participating in reverse trade shows with Indigenous businesses
- Fisheries and Oceans Canada (DFO) participated in Industry Days such as Reverse Trade Shows and National Conferences (e.g., Aboriginal Financial Officers Association of Atlantic Canada ((AFOA)) Canada), that serve to inform Indigenous businesses about opportunities with DFO as well as grow departmental knowledge on market capacity
- The Canadian Space Agency's (CSA) Procurement and Contract Administration team has committed to sending representatives to ISC's Reverse Job Fair for Indigenous Businesses and continues to network through CSA's Indigenous Community of Practice to inform and help sectors adopt new practices
- Leveraging Indigenous suppliers qualified on PSPC SOSAs
- Natural Resources Canada's (NRCan) internal procurement business processes have been modified to ensure all Indigenous businesses pre-qualified by Public Services Procurement Canada (PSPC) to provide goods and services through pre-competed instruments are invited to every applicable NRCan Request for Proposal
- Prioritizing early engagement and formation of Indigenous Partnerships
- The Department of National Defence (DND) and Canadian Armed Forces (CAF) are prioritizing early engagement with Indigenous peoples in their areas of responsibility, including to support procurement obligations and objectives in modern treaties, PSIB and the Inuit Nunangat Policy, and to align with the United Nations Declaration on the Rights of Indigenous Peoples Act
- Social Sciences and Humanities Research Council of Canada (SSHRC) is ensuring early engagement with clients and including the PSIB as an element to consider at the outset of each procurement request
- Developing and leveraging internal Indigenous procurement framework
- Agriculture and Agri-Food Canada (AAFC) established a PSIB working group consisting of key stakeholders from across the Department, with the goal of planning and identifying Indigenous set-aside procurements. The Department seeks to identify commodities where opportunities exist to further expand its business with Indigenous suppliers. Indigenous business profiles are shared with business owner groups within the Department, encouraging set-aside procurements when qualified Indigenous businesses are known to exist in the marketplace
- Public Prosecution Service of Canada (PPSC) is making it mandatory within the PPSC to include a minimum of one Indigenous business, where capacity exists, when competing or when using the PSPC mandatory standing offer or supply arrangements
- Transport Canada (TC) developed and implemented a strategy to increase contracts awarded to Indigenous businesses. This is supported by regular oversight and implementation monitoring exercised by senior leadership through the Senior Procurement Review Committee and the Resource and Investment Management Committee. As part of their oversight activities, they develop annual program procurement plans that include details on set-asides for Indigenous businesses
- Monthly/quarterly tracking of procurement spending with Indigenous suppliers
- Women and Gender Equality Canada (WAGE)'s procurement team provided senior management with quarterly reporting on Indigenous procurement target levels using contracting data extracted from the department's financial system
- Office of the Superintendent of Financial Institutions Canada tracks their performance against the minimum 5% target on a quarterly basis to ensure there is an opportunity to adjust procurement plans as required to continue their performance against the target
- Socializing the minimum 5% target/requirements to procurement staff via frequent communiques, mandatory training and information sessions, etc.
- Within Veterans Affairs, Indigenous procurement is highlighted in information sessions offered to areas throughout the Department
- The Royal Canadian Mounted Police (RCMP) requires its corporate management community to take part in annual learning activities
- Across the Government, departmental procurement officers completed the mandatory course Indigenous Considerations in Procurement (COR409) and the Procurement in the Nunavut Settlement Area (COR410) offered by the Canada School of Public Service