Non-Insured Health Benefits program: First Nations and Inuit Health Branch: Annual report 2022 to 2023
PDF Version (3.0 Mb, 116 Pages)
Table of contents
- Section 1: Overview
- Section 2: Client population
- Section 3: NIHB program benefit expenditures
- Section 4: NIHB pharmacy expenditure and utilization data
- Section 5: NIHB Medical Supplies and Equipment (MS&E) expenditure and utilization data
- Section 6: NIHB dental expenditure and utilization data
- Section 7: NIHB Medical transportation expenditure and utilization data
- Section 8: NIHB vision care benefits and utilization data
- Section 9: NIHB mental health counselling expenditure and utilization data
- Section 10: 10 year regional expenditure trends
- Section 11: NIHB program administration
- Section 12: NIHB policy and program initiatives
- Section 13: Technical notes
Section 1: Overview
Introduction
The Non-Insured Health Benefits (NIHB) program provides registered First Nations and recognized Inuit with coverage for a range of medically necessary health benefits including prescription drugs and over-the-counter (OTC) medications, dental and vision care, medical supplies and equipment, mental health counselling, and transportation to access medically required health services that are not available on reserve or in the community of residence. This report covers the 2022 to 2023 fiscal year. A fiscal year runs from April 1 to March 31. During 2022 to 2023, NIHB provided access to benefits coverage for 936,006 eligible clients.
In line with Canada's commitments under the United Nations Declaration of the Rights of Indigenous Peoples and the Truth and Reconciliation Commission's Calls to Action, Indigenous Services Canada (ISC) works with Indigenous organizations including the Assembly of First Nations and the Inuit Tapiriit Kanatami, to advance shared priorities focused on improving health outcomes for First Nations and Inuit.
Now in its twenty-ninth edition, the 2022 to 2023 NIHB Annual Report provides national and regional data on the NIHB program client population, expenditures, benefit types and benefit utilization. This Report is published in accordance with the NIHB program's performance management responsibilities and is intended for the following target audiences:
- First Nations and Inuit organizations and governments at community, regional and national levels
- Regional and Headquarters managers and staff of Indigenous Services Canada and
- Others in government and in non-government organizations with an interest in the provision of health services to First Nations and Inuit communities.
Section 2: Client population
To be an eligible client of the NIHB program, an individual must be a resident of Canada and one of the following:
- a First Nations person who is registered under the Indian Act
- an Inuk recognized by an Inuit Land Claim organization
- a child less than 24 months old whose parent is a registered First Nations person or a recognized Inuk
As of March 31, 2023, there were 936,006 First Nations and Inuit clients eligible to receive benefits under the NIHB program, an increase of 2.2% from March, 2022.
First Nations and Inuit population data are drawn from the Status Verification System (SVS) which is operated by the NIHB program. SVS data on First Nations clients are based on information provided by Indigenous Services Canada. SVS data on Inuit clients are based on information provided by the Governments of the Northwest Territories and Nunavut, and Inuit organizations including the Inuvialuit Regional Corporation, Nunavut Tunngavik Incorporated and the Makivik Corporation.
Amendments to the Indian Act have meant that more individuals are able to claim or restore their status as registered Indians. The Gender Equity in Indian Registration Act, which came into force on January 31, 2011, and An Act to amend the Indian Act in response to the Superior Court of Quebec decision in Descheneaux c. Canada, which came into force December 12, 2017, aim to eliminate known sex-based inequities in registration. Additional amendments came into force on August 15, 2019 which eliminated the 1951 cut-off provision of the Indian Act in order to extend entitlement to grandchildren born or adopted prior to September 4, 1951. Because of this, many people became entitled to be registered as an Indian in accordance with the Indian Act. Once registered, these individuals are eligible to receive benefits through the NIHB program.
The creation of the Qalipu Mi'kmaq First Nations band was announced on September 26, 2011 as a result of a settlement agreement that was negotiated between the Government of Canada and the Federation of Newfoundland Indians (FNI). Through the formation of this band, members of the Qalipu Mi'kmaq became recognized under the Indian Act and eligible for registration.
The British Columbia Tripartite Framework Agreement on First Nation Health Governance was signed by Canada, the First Nations Health Council (FNHC) and the British Columbia Ministry of Health on October 13, 2011. Consistent with the commitments set out in the Framework agreement, between July 2, 2013 and October 1, 2013 the First Nations Health Authority (FNHA) assumed responsibility for the design, management, delivery and/or funding of the delivery of health services to First Nations residing in British Columbia. Since that time, First Nations individuals residing in BC have received their health benefits through the FNHA's Health Benefits Program, which replaced the NIHB program in BC.
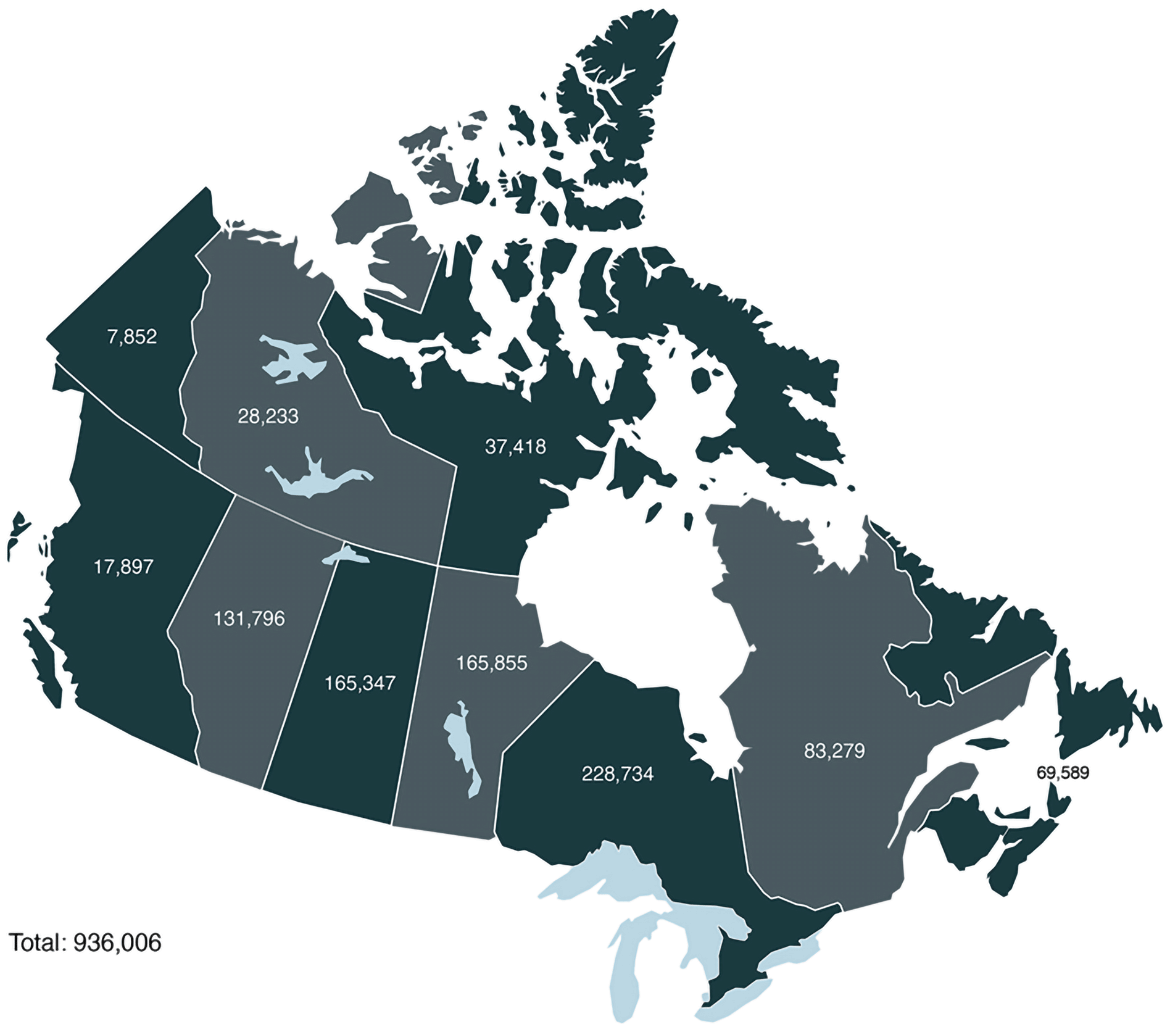
Eligible client population by region: March 2023
Ontario had the largest proportion of the eligible population, representing 24.4% of the national total, followed by Manitoba and Saskatchewan at 17.7% each.
Note that population values are based on region of band registration, which is not necessarily the client's current region of residence. The majority of British Columbia clients previously covered by the NIHB program are now covered by the B.C. First Nations Health Authority (FNHA) and are not represented in this chart. The remaining NIHB clients in B.C. are Inuit clients, or clients associated with B.C. bands, but residing in other provinces and territories of Canada, where they are covered under the NIHB program.
Source: SVS adapted by Program Analytics and Risk Mitigation
Text alternative for Figure 2.1 Eligible client population by region
This image is a map of Canada with the following population values:
- Atlantic has 69,589
- Quebec has 83,279
- Ontario has 228,734
- Manitoba has 165,855
- Saskatchewan has 165,347
- Alberta has 131,796
- British Columbia has 17,897
- Yukon has 7,852
- Northwest Territories have 28,233
- Nunavut has 37,418
- Total eligible population is 936,006
Eligible population by client type and region: March 2022 and March 2023
Of the 936,006 total eligible clients at the end of the 2022 to 2023 fiscal year, 884,102 (94.5%) were First Nations clients while 51,904 (5.5%) were Inuit clients. The number of First Nations clients increased by 2.2% and the number of Inuit clients increased by 1.3%
From March 2022 to March 2023, Quebec had the highest percentage change in total eligible clients with a 4.5% increase, followed by Saskatchewan and Ontario with increases of 2.4% and 2.2% respectively.
| Region | First Nations | Inuit | Total | % Change 2022 to 2023 |
|||
|---|---|---|---|---|---|---|---|
| March 2022 | March 2023 | March 2022 | March 2023 | March 2022 | March 2023 | ||
| Atlantic | 67,839 | 69,137 | 438 | 452 | 68,277 | 69,589 | 1.9% |
| Quebec | 77,824 | 81,267 | 1,891 | 2,012 | 79,715 | 83,279 | 4.5% |
| Ontario | 222,813 | 227,807 | 896 | 927 | 223,709 | 228,734 | 2.2% |
| Manitoba | 162,346 | 165,608 | 242 | 247 | 162,588 | 165,855 | 2.0% |
| Saskatchewan | 161,423 | 165,246 | 95 | 101 | 161,518 | 165,347 | 2.4% |
| Alberta | 128,891 | 131,004 | 766 | 792 | 129,657 | 131,796 | 1.6% |
| B.C. | 17,214 | 17,474 | 408 | 423 | 17,622 | 17,897 | 1.6% |
| Yukon | 7,659 | 7,704 | 142 | 148 | 7,801 | 7,852 | 0.7% |
| N.W.T. | 18,633 | 18,849 | 9,323 | 9,384 | 27,956 | 28,233 | 1.0% |
| Nunavut | 0 | 0 | 37,026 | 37,418 | 37,026 | 37,418 | 1.1% |
| National | 864,668 | 884,102 | 51,227 | 51,904 | 915,895 | 936,006 | 2.2% |
| Source: SVS adapted by Program Analytics and Risk Mitigation | |||||||
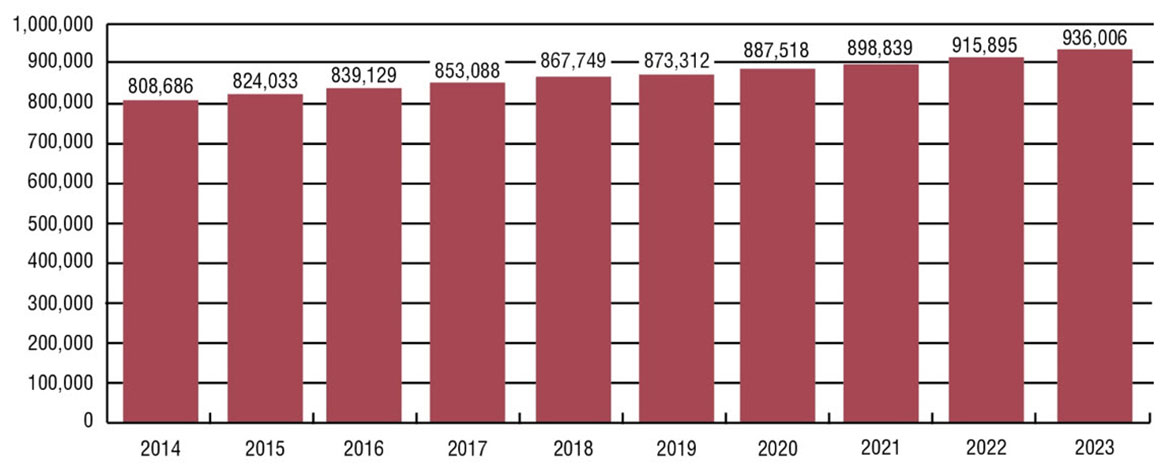
Eligible client population over time: March 2014 to March 2023
Over the past 10 years, the total number of eligible clients in the SVS has increased by 15.7%, from 808,686 in March 2014 to 936,006 in March 2023.
Source: SVS adapted by Program Analytics and Risk Mitigation
Text alternative for Figure 2.2: Eligible client population, March 2014 to March 2023
This image visually describes NIHB eligible population growth over ten years as follows:
- 2014 was 808,686
- 2015 was 824,033
- 2016 was 839,129
- 2017 was 853,088
- 2018 was 867,749
- 2019 was 873,312
- 2020 was 887,518
- 2021 was 898,839
- 2022 was 915,895
- 2023 was 936,006
Over the past five years, the NIHB program's total number of eligible clients increased by 7.2% from 873,312 in March 2019 to 936,006 in March 2023. Quebec had the largest increase in eligible clients over this period, with a growth rate of 14.3%. The Atlantic region and Ontario followed with growth rates of 8.9% and 7.8% respectively.
| Region | March 2019 | March 2020 | March 2021 | March 2022 | March 2023 |
|---|---|---|---|---|---|
| Atlantic | 63,873 | 65,335 | 66,782 | 68,277 | 69,589 |
| Quebec | 72,882 | 74,346 | 76,085 | 79,715 | 83,279 |
| Ontario | 212,176 | 215,751 | 218,784 | 223,709 | 228,734 |
| Manitoba | 157,325 | 159,862 | 160,954 | 162,588 | 165,855 |
| Saskatchewan | 154,323 | 157,162 | 158,785 | 161,518 | 165,347 |
| Alberta | 125,209 | 127,098 | 128,230 | 129,657 | 131,796 |
| B.C. | 17,417 | 16,561 | 17,019 | 17,622 | 17,897 |
| Yukon | 7,579 | 7,673 | 7,742 | 7,801 | 7,852 |
| N.W.T. | 27,771 | 27,816 | 27,847 | 27,956 | 28,233 |
| Nunavut | 34,757 | 35,914 | 36,611 | 37,026 | 37,418 |
| Total | 873,312 | 887,518 | 898,839 | 915,895 | 936,006 |
| Annual % change | 0.6% | 1.6% | 1.3% | 1.9% | 2.2% |
| Source: SVS adapted by Program Analytics and Risk Mitigation | |||||
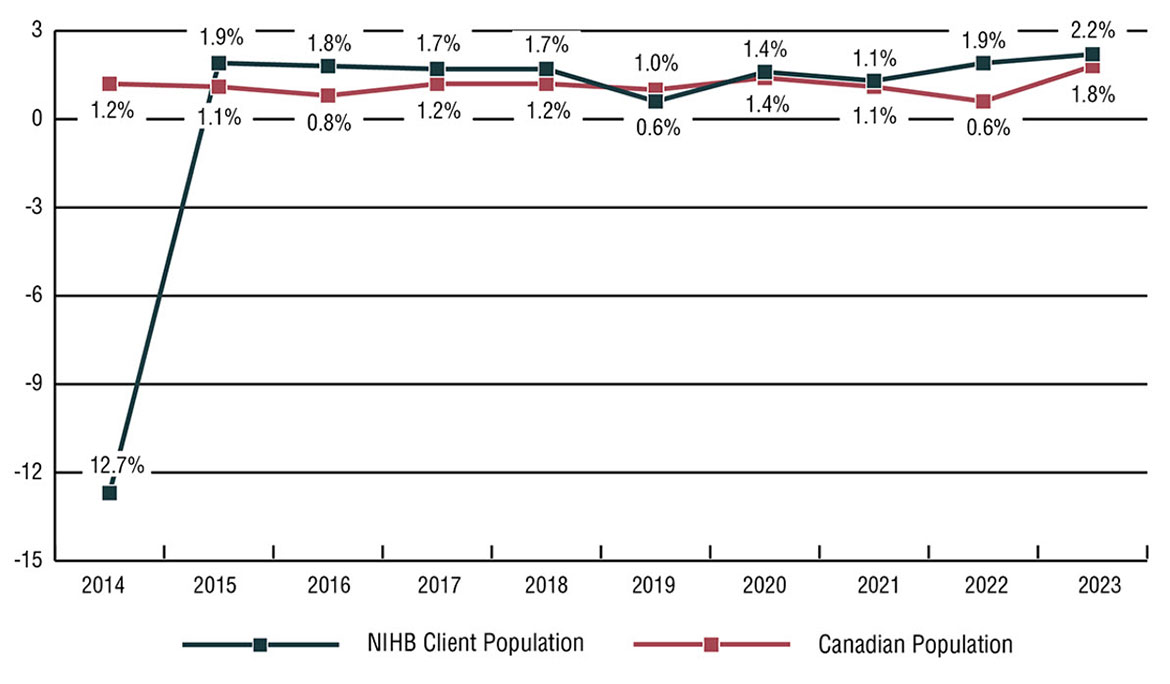
Annual population growth, Canadian population and eligible client population: 2014 to 2023
From 2014 to 2023, the Canadian population increased by 10.8% while the NIHB eligible First Nations and Inuit client population increased by 15.7%.
The lower than average NIHB program client population growth rate in 2014 can be attributed to the transfer of responsibility for First Nations clients living in British Columbia to the First Nations Health Authority (FNHA).
Source: SVS and Statistics Canada Catalogue No. 91-002-XWE, Quarterly Demographic Statistics, adapted by Program Analytics and Risk Mitigation
Text alternative for Figure 2.3: Annual population growth, Canadian population and eligible client population
This image is a line graph that visually describes annual population growth for the NIHB eligible population and for the Canadian population.
| Year | 2014 | 2015 | 2016 | 2017 | 2018 | 2019 | 2020 | 2021 | 2022 | 2023 |
|---|---|---|---|---|---|---|---|---|---|---|
| NIHB client Population | 808,686 | 824,033 | 839,129 | 853,088 | 867,749 | 873,312 | 887,518 | 898,839 | 915,895 | 936,006 |
| Growth rate | -12.7% | 1.9% | 1.8% | 1.7% | 1.7% | 0.6% | 1.6% | 1.3% | 1.9% | 2.2% |
| Canadian population | 35,152,370 | 35,535,348 | 35,832,513 | 36,264,604 | 36,708,083 | 37,058,856 | 37,589,262 | 38,007,166 | 38,226,498 | 38,929,902 |
| Growth rate | 1.2% | 1.1% | 0.8% | 1.2% | 1.2% | 1.0% | 1.4% | 1.1% | 0.6% | 1.8% |
Eligible client population by age group, gender and region: March 2023
The NIHB program recognizes the importance of representative data for our gender diverse client population. As of 2020, clients can choose Male, Female or Another Gender as a gender identifier when applying for or updating their registration with Indigenous Services Canada, which is captured in population and benefit utilization data. As the total number of clients who have chosen Another Gender to-date is low, these data have been suppressed in certain provincial/territorial population totals, in keeping with government practices for safe-guarding the privacy of individuals. All clients are included in National totals.
Of the 936,006 NIHB eligible clients on the SVS as of March 31, 2023 49.2% were male (460,653), 50.8% were female (475,234) and a small percentage of clients selected another gender (119).
The average age of the eligible client population was 35 years of age. By region, this average ranged from a low of 29 years of age in Nunavut to a high of 42 years of age in British Columbia.
The average age of the male and female eligible client population was 34 years and 36 years respectively. The average age for males ranged from a low of 28 years in Nunavut to a high of 40 years in British Columbia. The average age for females varied from a low of 29 years in Nunavut to a high of 44 years in British Columbia.
Table 2.3: Eligible client population by age group, gender and region
Source: SVS adapted by Program Analytics and Risk Mitigation
| Age group | Total | ||||||||||||||
|---|---|---|---|---|---|---|---|---|---|---|---|---|---|---|---|
| 0-4 | 5-9 | 10-14 | 15-19 | 20-24 | 25-29 | 30-34 | 35-39 | 40-44 | 45-49 | 50-54 | 55-59 | 60-64 | 65+ | ||
| Male | 1,184 | 1,953 | 2,522 | 2,667 | 2,682 | 2,736 | 2,795 | 2,443 | 2,237 | 2,201 | 2,417 | 2,212 | 1,914 | 4,199 | 34,162 |
| Female | 1,034 | 1,920 | 2,525 | 2,470 | 2,579 | 2,775 | 2,694 | 2,362 | 2,345 | 2,220 | 2,444 | 2,469 | 2,235 | 5,343 | 35,415 |
| Total | 2,218 | 3,873 | 5,047 | 5,137 | 5,261 | 5,511 | 5,489 | 4,805 | 4,582 | 4,421 | 4,861 | 4,681 | 4,149 | 9,542 | 69,589 |
| Average age: 39 (Male: 38, Female: 40) | |||||||||||||||
| Age group | Total | ||||||||||||||
|---|---|---|---|---|---|---|---|---|---|---|---|---|---|---|---|
| 0-4 | 5-9 | 10-14 | 15-19 | 20-24 | 25-29 | 30-34 | 35-39 | 40-44 | 45-49 | 50-54 | 55-59 | 60-64 | 65+ | ||
| Male | 1,178 | 2,651 | 3,091 | 3,266 | 3,076 | 3,444 | 3,399 | 2,863 | 2,738 | 2,446 | 2,477 | 2,497 | 2,372 | 5,055 | 40,553 |
| Female | 1,059 | 2,450 | 2,960 | 3,037 | 3,044 | 3,353 | 3,296 | 2,984 | 2,642 | 2,525 | 2,600 | 2,895 | 2,635 | 7,236 | 42,716 |
| Total | 2,237 | 5,101 | 6,051 | 6,303 | 6,120 | 6,797 | 6,695 | 5,847 | 5,380 | 4,971 | 5,077 | 5,392 | 5,007 | 12,291 | 83,279 |
| Average age: 39 (Male: 38, Female: 40) | |||||||||||||||
| Age group | Total | ||||||||||||||
|---|---|---|---|---|---|---|---|---|---|---|---|---|---|---|---|
| 0-4 | 5-9 | 10-14 | 15-19 | 20-24 | 25-29 | 30-34 | 35-39 | 40-44 | 45-49 | 50-54 | 55-59 | 60-64 | 65+ | ||
| Male | 2,905 | 6,618 | 8,349 | 8,981 | 8,997 | 9,754 | 9,462 | 8,173 | 7,225 | 6,910 | 7,069 | 7,070 | 6,322 | 13,517 | 111,352 |
| Female | 2,706 | 6,279 | 8,141 | 8,378 | 8,806 | 9,466 | 9,281 | 8,044 | 7,721 | 6,994 | 7,500 | 7,489 | 7,358 | 19,187 | 117,350 |
| Total | 5,611 | 12,897 | 16,490 | 17,359 | 17,803 | 19,220 | 18,743 | 16,217 | 14,946 | 13,904 | 14,569 | 14,559 | 13,680 | 32,704 | 228,734 |
| Average age: 39 (Male: 38, Female: 40) | |||||||||||||||
| Age group | Total | ||||||||||||||
|---|---|---|---|---|---|---|---|---|---|---|---|---|---|---|---|
| 0-4 | 5-9 | 10-14 | 15-19 | 20-24 | 25-29 | 30-34 | 35-39 | 40-44 | 45-49 | 50-54 | 55-59 | 60-64 | 65+ | ||
| Male | 2,923 | 7,708 | 8,724 | 8,455 | 7,680 | 7,732 | 7,232 | 5,829 | 4,824 | 4,523 | 4,344 | 4,046 | 3,182 | 5,382 | 82,584 |
| Female | 2,731 | 7,306 | 8,450 | 8,256 | 7,348 | 7,374 | 7,250 | 5,693 | 4,775 | 4,523 | 4,671 | 4,275 | 3,523 | 7,073 | 83,248 |
| Total | 5,654 | 15,014 | 17,174 | 16,711 | 15,028 | 15,106 | 14,482 | 11,522 | 9,599 | 9,046 | 9,015 | 8,321 | 6,705 | 12,455 | 165,855 |
| Average age: 33 (Male: 32, Female: 33) | |||||||||||||||
| Age group | Total | ||||||||||||||
|---|---|---|---|---|---|---|---|---|---|---|---|---|---|---|---|
| 0-4 | 5-9 | 10-14 | 15-19 | 20-24 | 25-29 | 30-34 | 35-39 | 40-44 | 45-49 | 50-54 | 55-59 | 60-64 | 65+ | ||
| Male | 3,591 | 7,154 | 8,568 | 8,457 | 7,795 | 7,506 | 7,608 | 6,169 | 5,113 | 4,428 | 4,272 | 3,687 | 2,886 | 4,520 | 81,754 |
| Female | 3,383 | 6,992 | 8,304 | 8,393 | 7,568 | 7,614 | 7,414 | 6,154 | 4,993 | 4,534 | 4,530 | 4,102 | 3,343 | 6,249 | 83,573 |
| Total | 6,974 | 14,146 | 16,872 | 16,850 | 15,363 | 15,120 | 15,022 | 12,323 | 10,106 | 8,962 | 8,802 | 7,789 | 6,229 | 10,769 | 165,347 |
| Average age: 32 (Male: 31, Female: 33) | |||||||||||||||
| Age group | Total | ||||||||||||||
|---|---|---|---|---|---|---|---|---|---|---|---|---|---|---|---|
| 0-4 | 5-9 | 10-14 | 15-19 | 20-24 | 25-29 | 30-34 | 35-39 | 40-44 | 45-49 | 50-54 | 55-59 | 60-64 | 65+ | ||
| Male | 2,858 | 5,831 | 7,139 | 6,728 | 6,169 | 6,220 | 5,797 | 4,840 | 3,898 | 3,456 | 3,217 | 2,860 | 2,291 | 3,890 | 65,194 |
| Female | 2,693 | 5,584 | 6,765 | 6,697 | 5,816 | 5,825 | 5,682 | 4,789 | 4,133 | 3,580 | 3,431 | 3,232 | 2,728 | 5,631 | 66,586 |
| Total | 5,551 | 11,415 | 13,904 | 13,425 | 11,985 | 12,045 | 11,479 | 9,629 | 8,031 | 7,036 | 6,648 | 6,092 | 5,019 | 9,521 | 131,796 |
| Average age: 32 (Male: 31, Female: 33) | |||||||||||||||
| Age group | Total | ||||||||||||||
|---|---|---|---|---|---|---|---|---|---|---|---|---|---|---|---|
| 0-4 | 5-9 | 10-14 | 15-19 | 20-24 | 25-29 | 30-34 | 35-39 | 40-44 | 45-49 | 50-54 | 55-59 | 60-64 | 65+ | ||
| Male | 115 | 291 | 402 | 473 | 689 | 777 | 799 | 809 | 733 | 620 | 620 | 569 | 474 | 1,063 | 8,434 |
| Female | 111 | 283 | 417 | 497 | 662 | 708 | 794 | 792 | 720 | 657 | 690 | 705 | 630 | 1,797 | 9,463 |
| Total | 226 | 574 | 819 | 970 | 1,351 | 1,485 | 1,593 | 1,601 | 1,453 | 1,277 | 1,310 | 1,274 | 1,104 | 2,860 | 17,897 |
| Average age: 42 (Male: 40, Female: 44) | |||||||||||||||
| Age group | Total | ||||||||||||||
|---|---|---|---|---|---|---|---|---|---|---|---|---|---|---|---|
| 0-4 | 5-9 | 10-14 | 15-19 | 20-24 | 25-29 | 30-34 | 35-39 | 40-44 | 45-49 | 50-54 | 55-59 | 60-64 | 65+ | ||
| Male | 90 | 206 | 250 | 271 | 298 | 323 | 321 | 320 | 266 | 239 | 287 | 332 | 272 | 431 | 3,906 |
| Female | 100 | 202 | 237 | 244 | 259 | 321 | 320 | 283 | 264 | 220 | 244 | 318 | 310 | 624 | 3,946 |
| Total | 190 | 408 | 487 | 515 | 557 | 644 | 641 | 603 | 530 | 459 | 531 | 650 | 582 | 1,055 | 7,852 |
| Average age: 40 (Male: 39, Female: 41) | |||||||||||||||
| Age group | Total | ||||||||||||||
|---|---|---|---|---|---|---|---|---|---|---|---|---|---|---|---|
| 0-4 | 5-9 | 10-14 | 15-19 | 20-24 | 25-29 | 30-34 | 35-39 | 40-44 | 45-49 | 50-54 | 55-59 | 60-64 | 65+ | ||
| Male | 451 | 863 | 1,066 | 1,056 | 969 | 1,337 | 1,400 | 1,170 | 979 | 793 | 980 | 854 | 689 | 1,302 | 13,909 |
| Female | 371 | 842 | 970 | 1,008 | 1,035 | 1,255 | 1,409 | 1,165 | 946 | 872 | 960 | 939 | 837 | 1,715 | 14,324 |
| Total | 822 | 1,705 | 2,036 | 2,064 | 2,004 | 2,592 | 2,809 | 2,335 | 1,925 | 1,665 | 1,940 | 1,793 | 1,526 | 3,017 | 28,233 |
| Average age: 37 (Male: 36, Female: 38) | |||||||||||||||
| Age group | Total | ||||||||||||||
|---|---|---|---|---|---|---|---|---|---|---|---|---|---|---|---|
| 0-4 | 5-9 | 10-14 | 15-19 | 20-24 | 25-29 | 30-34 | 35-39 | 40-44 | 45-49 | 50-54 | 55-59 | 60-64 | 65+ | ||
| Male | 1,592 | 2,161 | 2,104 | 1,939 | 1,756 | 1,559 | 1,545 | 1,199 | 1,017 | 839 | 851 | 764 | 508 | 971 | 18,805 |
| Female | 1,559 | 2,059 | 2,025 | 1,860 | 1,631 | 1,604 | 1,471 | 1,227 | 984 | 861 | 887 | 815 | 553 | 1,077 | 18,613 |
| Total | 3,151 | 4,220 | 4,129 | 3,799 | 3,387 | 3,163 | 3,016 | 2,426 | 2,001 | 1,700 | 1,738 | 1,579 | 1,061 | 2,048 | 37,418 |
| Average age: 29 (Male: 28, Female: 29) | |||||||||||||||
| Age group | Total | ||||||||||||||
|---|---|---|---|---|---|---|---|---|---|---|---|---|---|---|---|
| 0-4 | 5-9 | 10-14 | 15-19 | 20-24 | 25-29 | 30-34 | 35-39 | 40-44 | 45-49 | 50-54 | 55-59 | 60-64 | 65+ | ||
| Male | 16,887 | 35,436 | 42,215 | 42,293 | 40,111 | 41,388 | 40,358 | 33,815 | 29,030 | 26,455 | 26,534 | 24,891 | 20,910 | 40,330 | 460,653 |
| Female | 15,747 | 33,917 | 40,794 | 40,840 | 38,748 | 40,295 | 39,611 | 33,493 | 29,523 | 26,986 | 27,957 | 27,239 | 24,152 | 55,932 | 475,234 |
| Total | 32,634 | 69,353 | 83,009 | 83,133 | 78,859 | 81,683 | 79,969 | 67,308 | 58,553 | 53,441 | 54,491 | 52,130 | 45,062 | 96,262 | 936,006 |
| Average age: 35 (Male: 34, Female: 36) | |||||||||||||||
| Region | Total | ||||||||||
|---|---|---|---|---|---|---|---|---|---|---|---|
| Atlantic | Quebec | Ontario | Manitoba | Saskatchewan | Alberta | B.C. | Yukon | N.W.T. | Nunavut | ||
| Male | 38 | 38 | 38 | 32 | 31 | 31 | 40 | 39 | 36 | 28 | 34 |
| Female | 40 | 40 | 40 | 33 | 33 | 33 | 44 | 41 | 38 | 29 | 36 |
| Total | 39 | 39 | 39 | 33 | 32 | 32 | 42 | 40 | 37 | 29 | 35 |
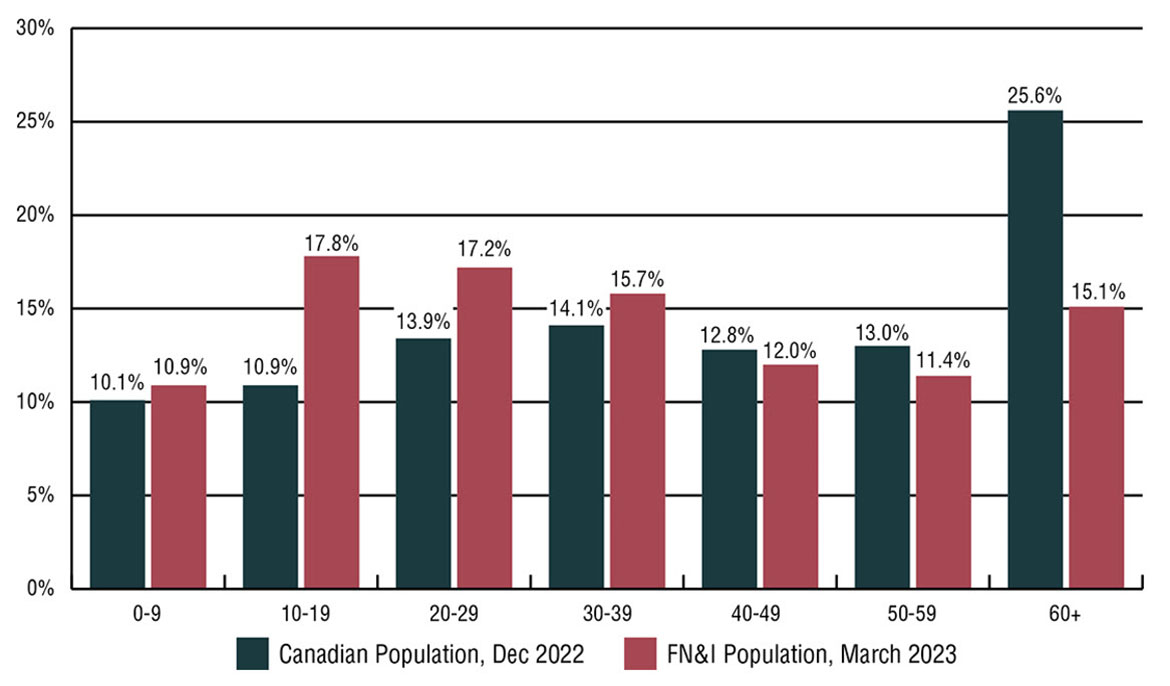
Population analysis by age group: March 2023
The overall NIHB client population is relatively young compared to the general Canadian population. The share of the NIHB client population under 20 years of age was 28.6% compared to 21.1% for the Canadian population. Nearly two-thirds (61.5%) of eligible clients are under the age of 40, compared to 48.6% for the Canadian population. The average age of NIHB clients is 35 compared to 42 years of age for the Canadian population.
Source: SVS and Statistics Canada CANSIM table 051-0001, Population by Age and Sex Group, adapted by Program Analytics and Risk Mitigation
Text alternative for Figure 2.4: Proportion of Canadian population and of the NIHB client population by age group
This image is a bar graph that visually describes the proportion of the Canadian population and the NIHB eligible population by age group, as follows:
- the percentage of the Canadian population aged 0 to 9 is 10.1%
- the percentage of the NIHB population aged 0 to 9 is 10.9%
- the percentage of the Canadian population aged 10 to 19 is 10.9%
- the percentage of the NIHB population aged 10 to 19 is 17.8%
- the percentage of the Canadian population aged 20 to 29 is 13.4%
- the percentage of the NIHB population aged 20 to 29 is 17.2%
- the percentage of the Canadian population aged 30 to 39 is 14.1%
- the percentage of the NIHB population aged 30 to 39 is 15.7%
- the percentage of the Canadian population aged 40 to 49 is 12.8%
- the percentage of the NIHB population aged 40 to 49 is 12.0%
- the percentage of the Canadian population aged 50 to 59 is 13.0%
- the percentage of the NIHB population aged 50 to 59 is 11.4%
- the percentage of the Canadian population aged 60 and over is 25.6%
- the percentage of the NIHB population aged 60 and over is 15.1%
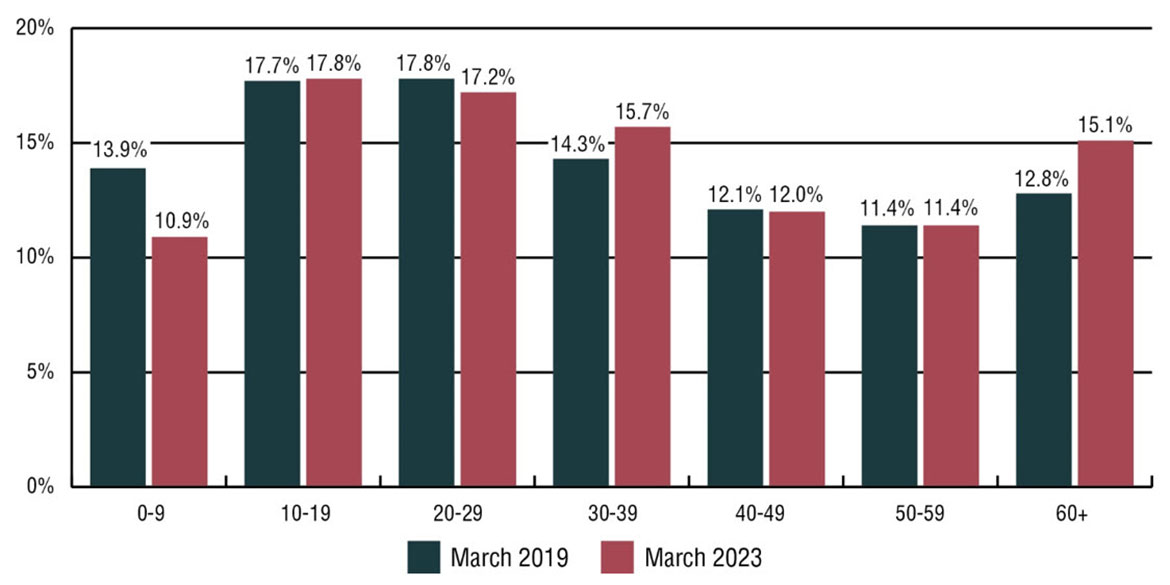
A comparison of March 2019 to March 2023 eligible client population shows an aging population. The client population 40 and above, as a proportional share of the overall client population, increased from 36.3% in 2019 to 38.5% in 2023. The senior population, defined as clients 65 years of age and over, has been slowly increasing as a proportion of the total NIHB client population. In 2014, seniors represented 7.0% of the overall NIHB population. Most recently in 2023, seniors accounted for 10.3%.
Source: SVS adapted by Program Analytics and Risk Mitigation
Text alternative for Figure 2.5: Proportion of eligible NIHB client population by age group
This image is a bar graph that visually describes the proportion of First Nations population and of Inuit population by age group as follows:
- the proportion of the First Nations and Inuit population aged 0 to 9 was 13.9% in March 2019 and 10.9% in March 2023
- the proportion of the First Nations and Inuit population aged 10 to 19 was 17.7% in March 2019 and 17.8% in March 2023
- the proportion of the First Nations and Inuit population aged 20 to 29 was 17.8% in March 2019 and 17.2% in March 2023
- the proportion of the First Nations and Inuit population aged 30 to 39 was 14.3% in March 2019 and 15.7% in March 2023
- the proportion of the First Nations and Inuit population aged 40 to 49 was 12.1% in March 2019 and 12.0% in March 2023
- the proportion of the First Nations and Inuit population aged 50 to 59 was 11.4% in March 2019 and 11.4% in March 2023
- the proportion of the First Nations and Inuit population aged 60 and over was 12.8% in March 2019 and 15.1% in March 2023
Section 3: NIHB program benefit expenditures
Factors influencing NIHB program sustainability: 2022 to 2023
Cost and service pressures on the Canadian health system have been linked to factors such as an aging population and the increased demand for and utilization of health goods, particularly pharmaceuticals, and services. In addition to these factors, NIHB program expenditures are driven by the number of eligible clients and their medical needs. A significant proportion of NIHB clients live in small and remote communities, and require medical transportation to access health services that are not available locally.
Factors influencing NIHB program expenditures
Client base
- Changing demographics, including population growth, an aging population, and uncertainty about the registration of new or existing clients
- Health status, including disease burden and prevalence of chronic and infectious diseases
- Geographic distribution of client population and accessibility of health services
Market forces
- Introduction of newer high-cost therapies and procedures
- Provincial/Territorial health insurance decisions and care staff shortages
- Insurance industry dynamics
- Shift from hospital treatments (insured) to non-insured coverage
- Economic factors which cause increases in the price of fuel, food/meals and accommodations
- Changes in health professional fees and scope of practice
Evidence
- Prescribing and treatment decisions of regulated health professionals
- Advancements in medical research/evidence, treatments and health technologies
- Preventive intervention versus restorative dental treatments
- Input received from First Nations and Inuit partners
NIHB expenditures by benefit ($ millions): 2022 to 2023
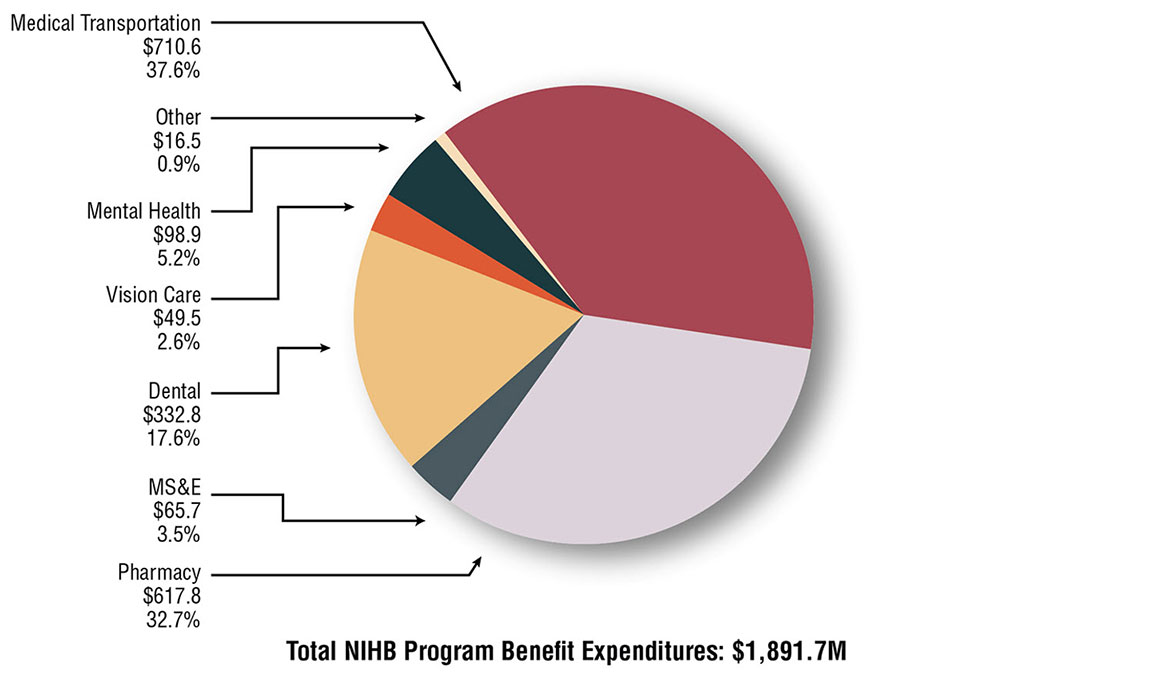
In 2022 to 2023, total NIHB program benefit expenditures were $1,891.7 million. This represents an increase of 11.6% over NIHB expenditures of $1,695.3 million in 2021 to 2022. Medical transportation costs represented the largest proportion of expenditures at 37.6% ($710.6 million), followed by pharmacy benefit costs at 32.7% ($617.8 million) and dental benefit costs at 17.6% ($332.8 million).
NIHB medical transportation, pharmacy and dental benefit expenditures accounted for 87.8% of all NIHB expenditures in 2022 to 2023.
Source: FST adapted by Program Analytics and Risk Mitigation
Text alternative for Figure 3.1: NIHB expenditures by benefit ($ millions)
This image is a pie chart visually describing NIHB expenditures in millions and proportion of total by benefit area for fiscal year 2022 to 2023, as follows.
- total expenditure for medical transportation is $710.6 and proportion of total expenditures is 37.6%
- total expenditure for pharmacy is $617.8 and proportion of total expenditures is 32.7%
- total expenditure for dental is $332.8 and proportion of total expenditures is 17.6%
- total expenditure for medical supplies and equipment is $65.7 and proportion of total expenditures is 3.5%
- total expenditure for mental health counselling is $98.9 and proportion of total expenditures is 5.2%
- total expenditure for vision care is $49.5 and proportion of total expenditures is 2.6%
- total expenditure for other is $16.5 and proportion of total expenditures is 0.9%
Not reflected in the $1,891.7 million in NIHB expenditures are approximately $57.3 million in administration costs. More detail is provided in Section 11.
NIHB expenditures and growth by benefit: 2022 to 2023
NIHB program benefit expenditures increased by 11.6%, or $196.4 million from fiscal year 2021 to 2022. The highest net increase in expenditures were in the NIHB medical transportation and pharmacy benefits at $108.4 and $41.5 million respectively. Factors affecting benefit expenditure growth are discussed in subsequent sections of this report.
| Benefit | Total Expenditures ($ 000's) 2021-2022 |
Total Expenditures ($ 000's) 2022-2023 |
% Change From 2021-2022 |
|---|---|---|---|
| Medical Transportation | $602,208 | $710,614 | 18.0% |
| Pharmacy | $576,251 | $617,767 | 7.2% |
| MS&E | $60,448 | $65,669 | 8.6% |
| Dental | $302,183 | $332,816 | 10.1% |
| Vision Care | $47,819 | $49,484 | 3.5% |
| Mental Health Counselling | $93,890 | $98,855 | 5.3% |
| Other | $12,496 | $16,538 | 32.3% |
| Total Expenditures | $1,695,295 | $1,891,743 | 11.6% |
| Source: FST adapted by Program Analytics and Risk Mitigation Division | |||
Expenditures in the "other" category are related to program oversight, including supplementary funding for the FNHA for additional clients who became eligible after the transfer of responsibilities due to changes in federal legislation, as well as contribution agreements to support engagement with Indigenous partner organizations.
NIHB expenditures by benefit and region (thousands of dollars): 2022 to 2023
Manitoba accounted for the highest proportion of total expenditures at $451.8 million, or 23.9% of the national total, followed by Ontario at $365.1 million (19.3%), and Saskatchewan at $363.3 million (19.2%). By comparison, the lowest expenditures were in the Atlantic region at $92.5 million (4.9%).
Headquarters expenditures by benefit type represent costs paid for claims processing services. Headquarters expenditures in the other category are comprised of operational expenditures associated with NIHB program oversight and policy development. This includes arrangements with the FNHA to provide funding for additional clients who became eligible following the transfer of responsibilities in 2013, due to changes in federal legislation, as well as contribution agreements with Indigenous partner organizations, such as the Assembly of First Nations and Inuit Tapiriit Kanatami, and regional Indigenous organizations. Headquarters expenditures account for 1.6% ($30.3 million) of total NIHB expenditures, and do not include the $57.3 million in administration (HQ) costs outlined in Section 11.
| Region | Medical Transportation | Pharmacy | MS&E | Dental | Vision Care | Mental Health Counselling | Other | Total |
|---|---|---|---|---|---|---|---|---|
| Atlantic | $17,512 | $45,819 | $4,785 | $12,638 | $4,149 | $6,918 | $666 | $92,488 |
| Quebec | $28,921 | $64,799 | $3,149 | $20,427 | $4,081 | $6,381 | $258 | $128,017 |
| Ontario | $140,343 | $113,842 | $10,045 | $67,128 | $8,633 | $24,491 | $587 | $365,069 |
| Manitoba | $233,140 | $120,207 | $13,870 | $60,247 | $7,669 | $16,393 | $273 | $451,799 |
| Saskatchewan | $114,863 | $126,676 | $15,310 | $70,480 | $10,585 | $25,194 | $211 | $363,319 |
| Alberta | $71,908 | $96,511 | $12,503 | $65,240 | $9,446 | $15,815 | $360 | $271,783 |
| North | $103,926 | $33,457 | $5,520 | $30,332 | $4,683 | $3,394 | $485 | $181,796 |
| Headquarters | $0 | $11,929 | $488 | $3,693 | $238 | $270 | $13,698 | $30,317 |
| Total | $710,614 | $617,767 | $65,669 | $332,816 | $49,484 | $98,855 | $16,538 | $1,891,743 |
| Source: FST adapted by Program Analytics and Risk Mitigation | ||||||||
NIHB annual expenditures ($ Millions) and percentage change
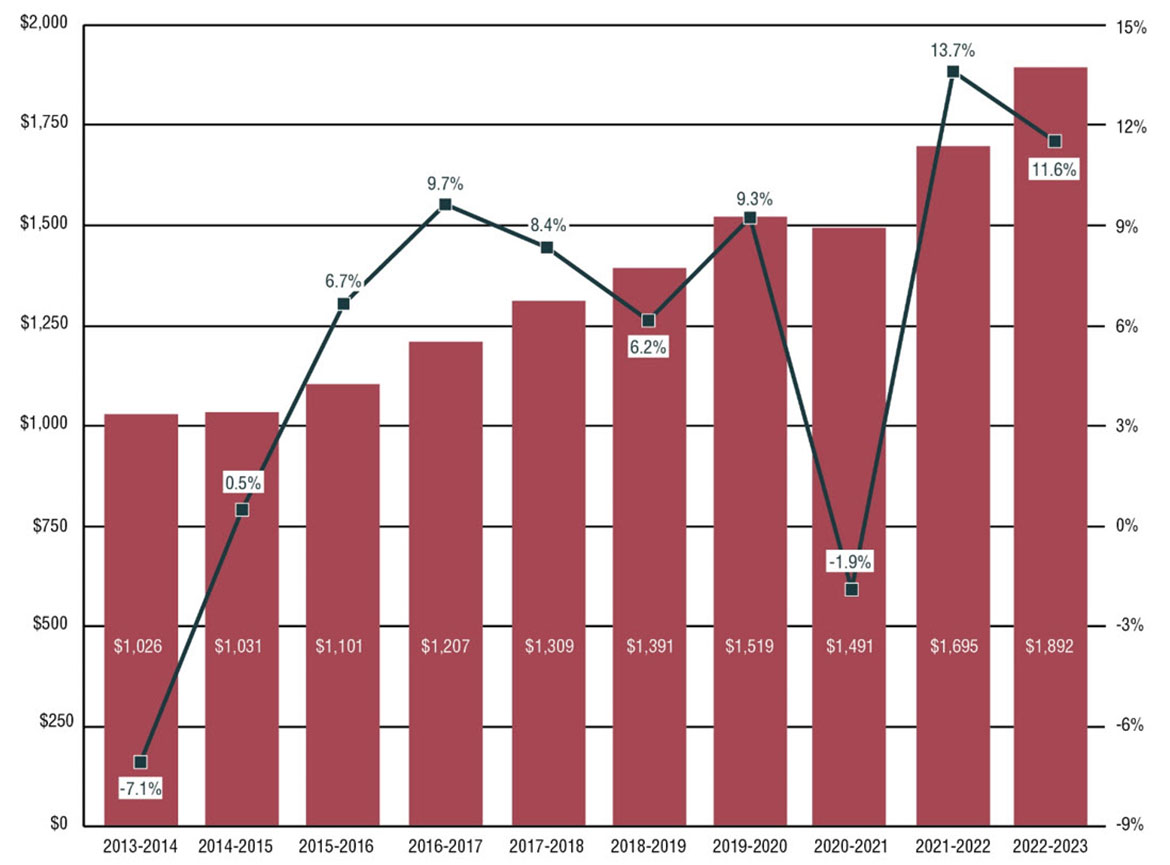
In 2022 to 2023, NIHB program expenditures totalled $1,891.7 million, an increase of 11.6% from $1,695.1 million in 2021 to 2022. Since 2013 to 2014, total expenditures have grown by 84.3%. The annualized rate of growth over this period was 5.8%. There has been wide variation in growth rates between 2013 to 2014 and 2022 to 2023, from a low of -7.1% in 2013 to 2014 to a high of 13.7 % in 2021 to 2022.
Fluctuations in NIHB expenditures growth rates are impacted by a number of factors, as set out in figure 3.1. Changes in the eligible client population have a direct impact on growth. Notable examples include the transfer of responsibility for First Nations clients residing in B.C. to the FNHA in 2013 to 2014, the creation of the Qalipu Mi'kmaq band in 2011, and an increase in eligible clients as a result of amendments to the Indian Act. The coronavirus (COVID-19) outbreak and provincial/territorial public health restrictions on the provision of in-person services in fiscal year 2020 to 2021, along with larger than typical utilization of NIHB benefits in fiscal 2021 to 2022 once restrictions were ended, impacted growth in those years.
If expenditures for FNHA eligible clients are excluded from 2012 to 2013 and 2013 to 2014 total NIHB expenditures, then the growth rate for 2013 to 2014 would have been 2.8%.
Source: FIRMS and FST adapted by Program Analytics and Risk Mitigation
Text alternative for Figure 3.2 NIHB annual expenditures ($ Millions) and percentage change
This image is a bar graph which visually describes NIHB annual expenditures in millions and annual percentage change by fiscal year, as follows:
- 2013 to 2014 is $1,026 and -7.1%
- 2014 to 2015 is $1,031 and 0.5%
- 2015 to 2016 is $1,101 and 6.7%
- 2016 to 2017 is $1,207 and 9.7%
- 2017 to 2018 is $1,309 and 8.4%
- 2018 to 2019 is $1,391 and 6.2%
- 2019 to 2020 is $1,519 and 9.3%
- 2020 to 2021 is $1,491 and -1.9%
- 2021 to 2022 is $1,695 and 13.7%
- 2022 to 2023 is $1,892 and 11.6%
NIHB annual expenditures by benefit (thousands of dollars)
In the 10 year period ending 2022 to 2023, expenditures for NIHB mental health services and medical transportation benefits have grown more than other benefit areas. NIHB mental health expenditures had the highest percentage growth at 598.5%, from $14.2 million in 2013 to 2014 to $98.9 million in 2022 to 2023. NIHB medical transportation had the highest expenditure growth from $352.0 million in 2013 to 2014 to $710.6 million in 2022 to 2023, a change of 101.9%.
Over the same period, NIHB medical supplies and equipment (MS&E) expenditures increased by 114.1% and NIHB dental expenditures increased by 60.6%.
| Benefit | 2013-2014 | 2014-2015 | 2015-2016 | 2016-2017 | 2017-2018 | 2018-2019 | 2019-2020 | 2020-2021 | 2021-2022 | 2022-2023 |
|---|---|---|---|---|---|---|---|---|---|---|
| Medical Transportation | $352,036 | $357,963 | $375,904 | $417,035 | $459,505 | $495,034 | $537,179 | $525,719 | $602,208 | $710,614 |
| Pharmacy | $383,614 | $392,479 | $425,773 | $457,489 | $482,789 | $488,604 | $532,045 | $550,900 | $576,251 | $617,767 |
| MS&E | $30,670 | $29,233 | $30,657 | $37,031 | $40,167 | $47,346 | $54,256 | $51,524 | $60,448 | $65,669 |
| Dental | $207,179 | $201,886 | $217,109 | $235,831 | $248,992 | $269,008 | $282,908 | $236,293 | $302,183 | $332,816 |
| Vision Care | $31,459 | $29,704 | $30,017 | $32,370 | $33,578 | $36,467 | $45,968 | $39,907 | $47,819 | $49,484 |
| Mental Health Counselling | $14,152 | $15,581 | $16,193 | $21,728 | $33,066 | $42,656 | $55,126 | $73,958 | $93,890 | $98,855 |
| Other | $5,406 | $4,005 | $4,858 | $5,974 | $11,143 | $11,450 | $12,001 | $12,314 | $12,496 | $16,538 |
| Total | $1,026,397 | $1,031,488 | $1,100,512 | $1,207,458 | $1,309,240 | $1,390,563 | $1,519,483 | $1,490,615 | $1,695,295 | $1,891,743 |
| Annual % Change | -7.1% | 0.5% | 6.7% | 9.7% | 8.4% | 6.2% | 9.3% | -1.9% | 13.7% | 11.6% |
| Source: FIRMS and FST adapted by Program Analytics and Risk Mitigation | ||||||||||
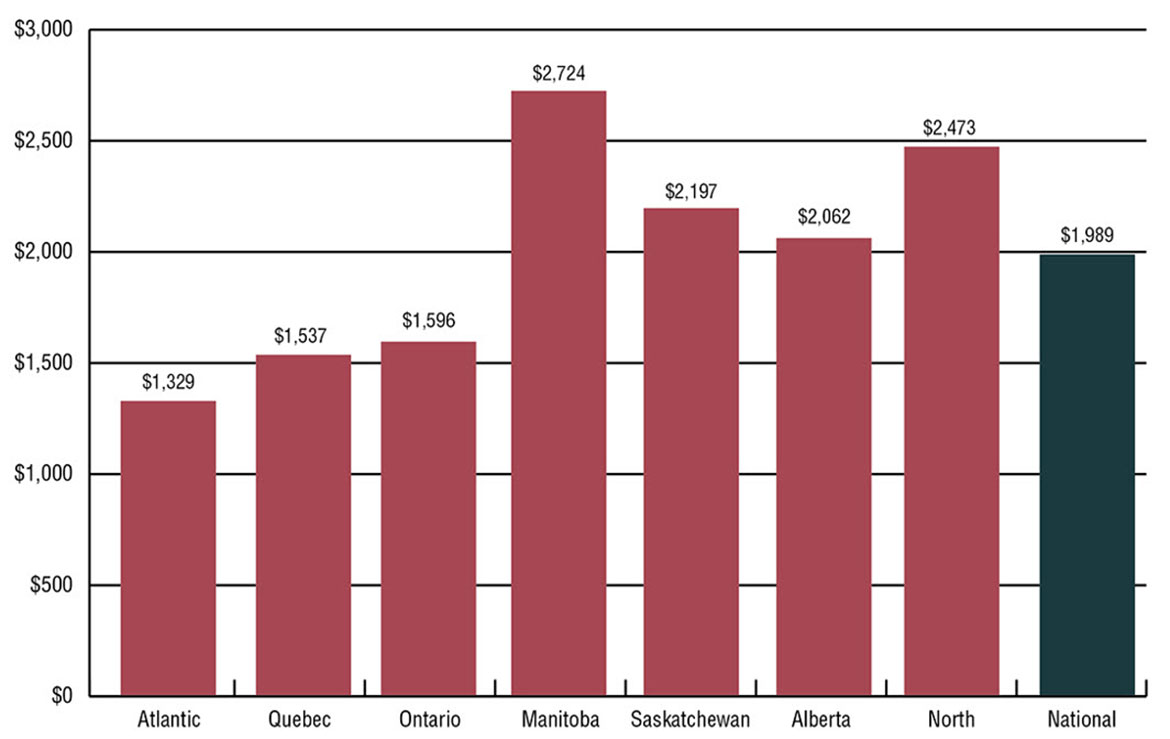
Per capita NIHB expenditures by region: 2022 to 2023
Expenditures per capita are total NIHB expenditures divided by the number of eligible clients, regardless of whether clients submitted a claim in the reporting period.
The national per capita expenditures for all benefits in 2022 to 2023 were $1,989. Manitoba had the highest per capita cost at $2,724. The Northern region followed with a per capita cost of $2,473. The higher than average per capita cost for these regions is partly attributable to high medical transportation costs due to the large number of First Nations and Inuit clients living in remote or fly-in only northern communities. By contrast, the Atlantic region had the lowest per capita cost of $1,329, due to the comparatively low medical transportation expenditures in the region.
Source: FST and SVS adapted by Program Analytics and Risk Mitigation
Text alternative for Figure 3.3: Per capita NIHB expenditures by region
This bar graph visually describes NIHB annual expenditures in millions by fiscal year and by region. Per capita expenditures:
- for Atlantic are $1,329
- for Quebec are $1,537
- for Ontario are $1,596
- for Manitoba are $2,724
- for Saskatchewan are $2,197
- for Alberta are $2,062 and
- for the North are $2,473
- national per capita expenditures are $1,989
Section 4: NIHB pharmacy expenditure and utilization data
The NIHB program covers a comprehensive range of prescription drugs and over-the-counter medications listed on the NIHB Drug Benefit List (DBL). Pharmacy benefits are evidence based and eligible prescription and over-the-counter medications are covered in accordance with program policies.
In 2022 to 2023, the NIHB program paid for pharmacy claims made by a total of 559,355 First Nations and Inuit clients. The total spent for these claims was $617.8 million or 32.7% of total NIHB expenditures. Of all the NIHB program benefits, the pharmacy benefit accounts for the second largest share of expenditures and is the benefit most utilized by clients.
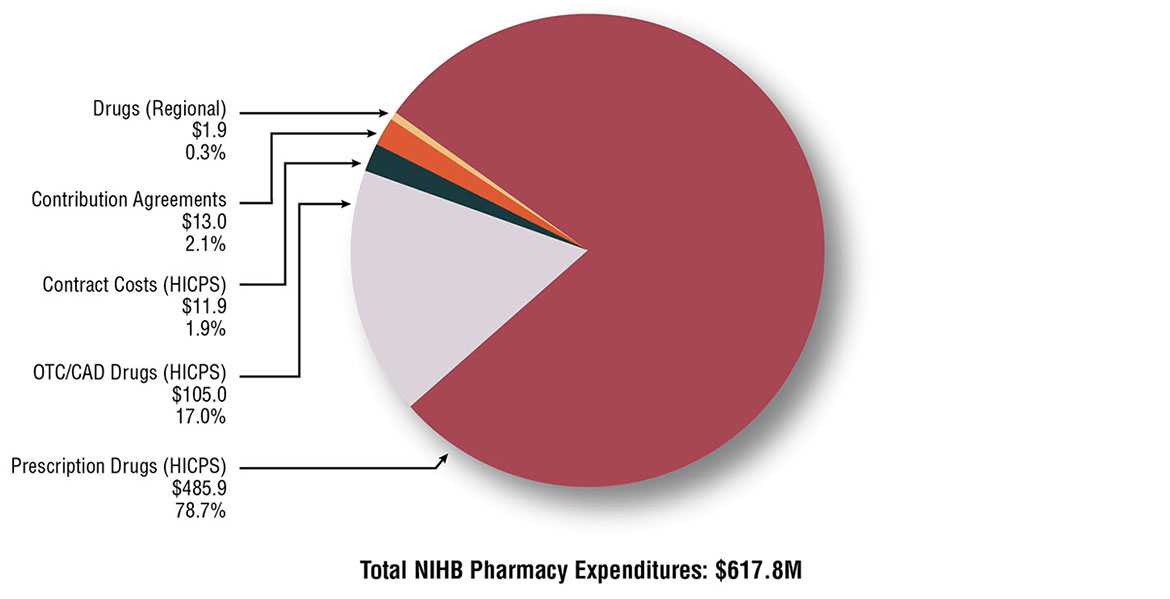
Distribution of NIHB pharmacy expenditures ($ Millions): 2022 to 2023
The NIHB pharmacy benefit is comprised of multiple components. Prescription drugs paid through the Health Information and Claims Processing Services (HICPS) system was the largest piece, accounting for $485.9 million or 78.7% of all NIHB pharmacy expenditures, followed by over-the-counter (OTC) and controlled access (CAD) drugs (HICPS) which totalled $105.0 million or 17.0%.
Regional Drugs, at $1.9 million or 0.3% of pharmacy benefit costs, refers to prescription drugs and OTC medications paid through Indigenous Services Canada regional offices.
Contribution agreements, which accounted for $13.0 million or 2.1% of total pharmacy benefit costs, are used to fund the provision of pharmacy benefits through agreements such as those with the Mohawk Council of Akwesasne in Ontario and the Bigstone Cree Nation in Alberta.
HICPS contract costs related to claims processing through the HICPS system totalled $11.9 million or 1.9% in 2022 to 2023.
Source: FST adapted by Program Analytics and Risk Mitigation
Text alternative for Figure 4.1: Distribution of NIHB pharmacy expenditures ($ Millions)
This image is a pie chart which visually describes NIHB pharmacy expenditures in millions and proportion of total expenditures by component type:
- prescription drugs (HICPS) are $485.98 and 78.7%
- OTC/CAD drugs (HICPS) are $105.0 and 17.0%
- HICPS contract costs are $11.9 and 1.9%
- contribution agreements are $13.0 and 2.1%
- regional drugs are $1.9 and 0.3%
- total expenditures $617.8
Total NIHB pharmacy expenditures by type and region (thousands of dollars): 2022 to 2023
Prescription drug costs paid through the HICPS system represented the largest component of total NIHB Pharmacy costs accounting for $485.9 million or 78.7%. The Saskatchewan region had the largest proportion of these costs at 21.0%, followed by Manitoba at 19.8% and Ontario at 18.9%.
The next highest component was over-the-counter (OTC) and controlled access drug (CAD) costs at $105.0 million or 17.0%. The regions of Manitoba (22.7%), Saskatchewan (21.9%) and Alberta (16.9%) had the largest proportions of these costs in 2022 to 2023.
| Region | Operating | Total Operating Costs | Total Contribution Costs | Total Costs | |||
|---|---|---|---|---|---|---|---|
| Prescription Drugs | OTC/CAD Drugs | Drugs Regional | HICPS Contract Costs | ||||
| Atlantic | $37,926 | $7,891 | $2 | $0 | $45,819 | $0 | $45,819 |
| Quebec | $53,937 | $10,856 | $7 | $0 | $64,799 | $0 | $64,799 |
| Ontario | $92,052 | $16,334 | $0 | $0 | $108,386 | $5,456 | $113,842 |
| Manitoba | $96,376 | $23,831 | $0 | $0 | $120,207 | $0 | $120,207 |
| Saskatchewan | $102,169 | $22,962 | $1,476 | $0 | $126,607 | $69 | $126,676 |
| Alberta | $71,290 | $17,718 | $0 | $0 | $89,008 | $7,503 | $96,511 |
| North | $28,125 | $4,873 | $459 | $0 | $33,457 | $0 | $33,457 |
| Headquarters | $0 | $0 | $0 | $11,929 | $11,929 | $0 | $11,929 |
| Total | $485,886 | $104,981 | $1,943 | $11,929 | $604,738 | $13,028 | $617,767 |
| Source: FST adapted by Program Analytics and Risk Mitigation | |||||||
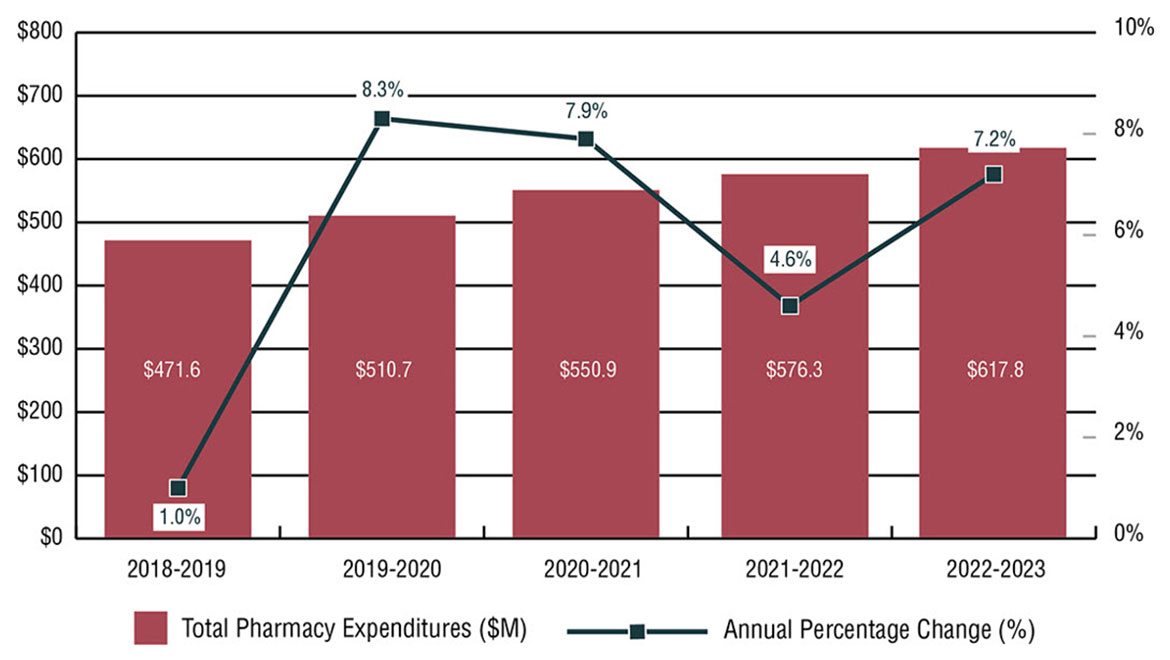
Annual NIHB pharmacy expenditures
NIHB pharmacy expenditures increased by 7.2% during fiscal year 2022 to 2023. Over the past five years, growth in pharmacy expenditures has ranged from a high of 8.3% in 2019 to 2020 to a low of 1.0% in 2018 to 2019.
The five year annualized growth rate for NIHB pharmacy expenditures is 5.5%. The introduction of lower cost generic drugs as they become available on the market have kept pharmacy benefit growth moderate. As well, NIHB has negotiated Product Listing Agreements (PLA) with drug manufacturers to allow for the coverage of certain medications at a reduced price through the use of rebates. On March 31, 2023, NIHB had over 300 PLA in effect.
Source: FST and FIRMS adapted by Program Analytics and Risk Mitigation
Text alternative for Figure 4.2: Annual NIHB pharmacy expenditures and percentage change
This image is a bar graph which visually describes NIHB annual pharmacy expenditures in millions and percentage change by fiscal year, as follows:
- 2018 to 2019 expenditures are $471.6 million and growth is 1.0%
- 2019 to 2020 expenditures are $510.7 million and growth is 8.3%
- 2020 to 2021 expenditures are $550.9 million and growth is 7.9%
- 2021 to 2022 expenditures are $576.3 million and growth is 4.6%
- 2022 to 2023 expenditures are $617.8 million and growth is 7.2%
| Region | 2018 to 2019 | 2019 to 2020 | 2020 to 2021 | 2021 to 2022 | 2022 to 2023 |
|---|---|---|---|---|---|
| Atlantic | $30,448 | $35,365 | $37,323 | $40,657 | $45,819 |
| Quebec | $46,623 | $50,747 | $53,282 | $58,827 | $64,799 |
| Ontario | $93,896 | $97,437 | $105,300 | $112,069 | $113,842 |
| Manitoba | $92,084 | $100,059 | $106,851 | $112,353 | $120,207 |
| Saskatchewan | $107,487 | $115,074 | $116,188 | $120,000 | $126,676 |
| Alberta | $73,976 | $83,526 | $84,920 | $86,680 | $96,511 |
| North | $27,042 | $28,337 | $29,479 | $31,499 | $33,457 |
| Headquarters | $16,963 | $21,354 | $14,220 | $10,169 | $11,929 |
| Total | $471,641 | $510,691 | $550,901 | $576,251 | $617,767 |
| Source: FST and FIRMS adapted by Program Analytics and Risk Mitigation | |||||
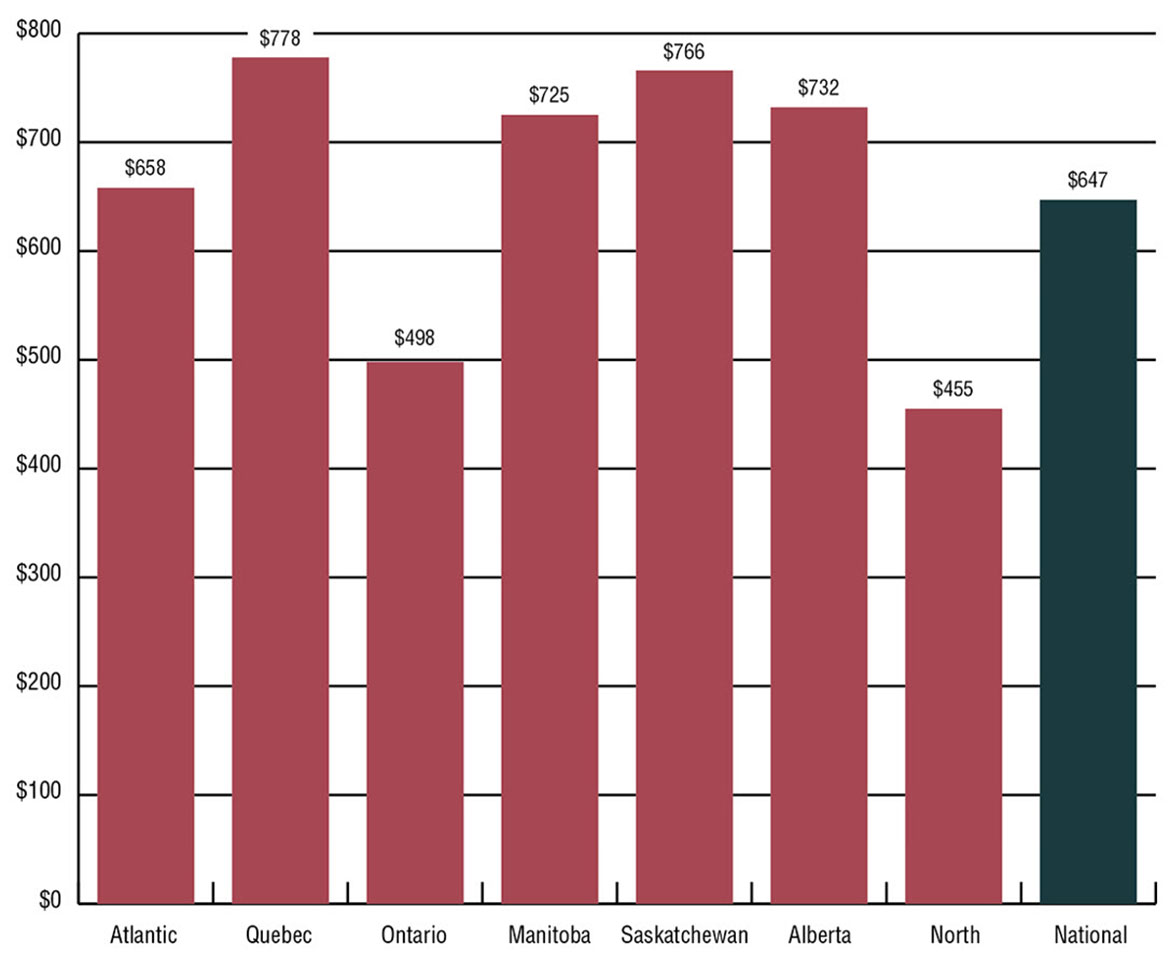
Per capita NIHB pharmacy expenditures by region: 2022 to 2023
Expenditures per capita are total NIHB pharmacy expenditures divided by the number of eligible clients, regardless of whether clients submitted a claim in the reporting period.
In 2022 to 2023, the national per capita expenditure for NIHB Pharmacy benefits was $647. This was an increase of 4.7% from the $618 recorded in 2021 to 2022.
Quebec had the highest per capita NIHB Pharmacy expenditures at $778, followed by Saskatchewan at $766.
The Northern region had the lowest per capita expenditures at $455 followed by Ontario at $498. Relatively low per capita expenditures in the North are attributed to lower than average utilization rates and also a younger population utilizing lower cost medications.
Source: FST and SVS adapted by Program Analytics and Risk Mitigation
Text alternative for Figure 4.3: Per capita NIHB pharmacy expenditure by region
This image is a bar graph which visually describes NIHB pharmacy expenditures per capita by region, as follows:
- Atlantic is $658
- Quebec is $778
- Ontario is $498
- Manitoba is $725
- Saskatchewan is $766
- Alberta is $732
- North is $455 and
- National is $647
NIHB pharmacy utilization rates by region
Utilization rates represent the number of clients who received at least one pharmacy benefit paid through the HICPS system in the fiscal year, as a proportion of the total number of eligible clients. In 2022 to 2023, the national utilization rate was 60% for NIHB Pharmacy benefits paid through the HICPS system.
The rates understate the actual level of utilization as the data do not include pharmacy services provided through contribution agreements and benefits provided through community health facilities. For example, the HICPS system does not capture any data on services used by the Bigstone Cree Nation client population in Alberta and the Akwesasne client population in Ontario. If these populations were removed, the utilization rate for pharmacy benefits in Alberta would have been 68.0% and for Ontario the utilization rate for pharmacy benefits would have been 53.1% in 2022 to 2023. If both the Bigstone and Akwesasne client populations were removed from the overall NIHB population, the national utilization rate for pharmacy benefits would have been 61.2%.
| Region | 2018 to 2019 | 2019 to 2020 | 2020 to 2021 | 2021 to 2022 | 2022 to 2023 |
|---|---|---|---|---|---|
| Atlantic | 67% | 63% | 60% | 61% | 63% |
| Quebec | 61% | 62% | 58% | 59% | 61% |
| Ontario | 49% | 52% | 48% | 49% | 50% |
| Manitoba | 67% | 68% | 62% | 65% | 67% |
| Saskatchewan | 69% | 70% | 63% | 65% | 68% |
| Alberta | 65% | 67% | 60% | 61% | 64% |
| Yukon | 60% | 60% | 58% | 57% | 59% |
| N.W.T. | 55% | 55% | 54% | 54% | 56% |
| Nunavut | 49% | 49% | 46% | 46% | 48% |
| National | 60% | 61% | 57% | 58% | 60% |
| Source: HICPS and SVS adapted by Program Analytics and Risk Mitigation | |||||
NIHB pharmacy claimants by age group, gender and region: 2022 to 2023
Of the 936,006 clients eligible to receive benefits under the NIHB program, a total of 559,355 claimants received at least one pharmacy item paid through the Health Information and Claims Processing Services (HICPS) system in 2022 to 2023. Of this total, 317,683 were female (57%) and 241,672 were male (43%). This compares to the total eligible population where 51% were female and 49% were male.
The average age of pharmacy claimants was 38 years. The average age for female and male claimants was 38 and 37 years of age, respectively.
Table 4.4: NIHB pharmacy claimants by age group, gender and region
Source: HICPS and SVS adapted by Program Analytics and Risk Mitigation
| Age group | Total | ||||||||||||||
|---|---|---|---|---|---|---|---|---|---|---|---|---|---|---|---|
| 0-4 | 5-9 | 10-14 | 15-19 | 20-24 | 25-29 | 30-34 | 35-39 | 40-44 | 45-49 | 50-54 | 55-59 | 60-64 | 65+ | ||
| Male | 679 | 1,119 | 1,175 | 1,195 | 1,221 | 1,279 | 1,396 | 1,284 | 1,231 | 1,268 | 1,544 | 1,504 | 1,346 | 2,962 | 19,203 |
| Female | 596 | 1,144 | 1,272 | 1,701 | 1,916 | 2,107 | 1,967 | 1,732 | 1,663 | 1,665 | 1,818 | 1,840 | 1,714 | 3,818 | 24,953 |
| Total | 1,275 | 2,263 | 2,447 | 2,896 | 3,137 | 3,386 | 3,363 | 3,016 | 2,894 | 2,933 | 3,362 | 3,344 | 3,060 | 6,780 | 44,156 |
| Average age: 41 (Male: 41, Female: 41) | |||||||||||||||
| Age group | Total | ||||||||||||||
|---|---|---|---|---|---|---|---|---|---|---|---|---|---|---|---|
| 0-4 | 5-9 | 10-14 | 15-19 | 20-24 | 25-29 | 30-34 | 35-39 | 40-44 | 45-49 | 50-54 | 55-59 | 60-64 | 65+ | ||
| Male | 672 | 1,372 | 1,439 | 1,410 | 1,285 | 1,497 | 1,520 | 1,414 | 1,390 | 1,385 | 1,530 | 1,608 | 1,627 | 3,356 | 21,505 |
| Female | 626 | 1,431 | 1,526 | 2,028 | 2,190 | 2,461 | 2,383 | 2,128 | 1,802 | 1,810 | 1,883 | 2,124 | 1,978 | 4,822 | 29,192 |
| Total | 1,298 | 2,803 | 2,965 | 3,438 | 3,475 | 3,958 | 3,903 | 3,542 | 3,192 | 3,195 | 3,413 | 3,732 | 3,605 | 8,178 | 50,697 |
| Average age: 41 (Male: 40, Female: 41) | |||||||||||||||
| Age group | Total | ||||||||||||||
|---|---|---|---|---|---|---|---|---|---|---|---|---|---|---|---|
| 0-4 | 5-9 | 10-14 | 15-19 | 20-24 | 25-29 | 30-34 | 35-39 | 40-44 | 45-49 | 50-54 | 55-59 | 60-64 | 65+ | ||
| Male | 914 | 2,121 | 2,355 | 2,944 | 2,866 | 3,813 | 4,097 | 3,740 | 3,449 | 3,534 | 3,851 | 4,049 | 3,794 | 6,975 | 48,502 |
| Female | 818 | 2,047 | 2,554 | 4,045 | 4,941 | 6,052 | 5,961 | 5,081 | 4,922 | 4,497 | 4,863 | 5,045 | 4,893 | 10,272 | 65,991 |
| Total | 1,732 | 4,168 | 4,909 | 6,989 | 7,807 | 9,865 | 10,058 | 8,821 | 8,371 | 8,031 | 8,714 | 9,094 | 8,687 | 17,247 | 114,493 |
| Average age: 42 (Male: 42, Female: 43) | |||||||||||||||
| Age group | Total | ||||||||||||||
|---|---|---|---|---|---|---|---|---|---|---|---|---|---|---|---|
| 0-4 | 5-9 | 10-14 | 15-19 | 20-24 | 25-29 | 30-34 | 35-39 | 40-44 | 45-49 | 50-54 | 55-59 | 60-64 | 65+ | ||
| Male | 1,936 | 4,452 | 4,422 | 4,196 | 3,715 | 4,086 | 4,077 | 3,488 | 3,078 | 3,059 | 3,129 | 3,048 | 2,505 | 3,762 | 48,953 |
| Female | 1,768 | 4,598 | 4,720 | 5,558 | 5,586 | 5,943 | 5,827 | 4,604 | 3,952 | 3,736 | 3,941 | 3,584 | 3,003 | 5,237 | 62,057 |
| Total | 3,704 | 9,050 | 9,142 | 9,754 | 9,301 | 10,029 | 9,904 | 8,092 | 7,030 | 6,795 | 7,070 | 6,632 | 5,508 | 8,999 | 111,010 |
| Average age: 35 (Male: 34, Female: 35) | |||||||||||||||
| Age group | Total | ||||||||||||||
|---|---|---|---|---|---|---|---|---|---|---|---|---|---|---|---|
| 0-4 | 5-9 | 10-14 | 15-19 | 20-24 | 25-29 | 30-34 | 35-39 | 40-44 | 45-49 | 50-54 | 55-59 | 60-64 | 65+ | ||
| Male | 2,243 | 4,280 | 4,492 | 4,260 | 3,779 | 3,931 | 4,340 | 3,685 | 3,230 | 2,978 | 3,055 | 2,724 | 2,210 | 3,430 | 48,637 |
| Female | 2,113 | 4,496 | 4,710 | 5,819 | 5,911 | 6,144 | 6,041 | 5,119 | 4,028 | 3,747 | 3,736 | 3,397 | 2,867 | 4,856 | 62,984 |
| Total | 4,356 | 8,776 | 9,202 | 10,079 | 9,690 | 10,075 | 10,381 | 8,804 | 7,258 | 6,725 | 6,791 | 6,121 | 5,077 | 8,286 | 111,621 |
| Average age: 34 (Male: 33, Female: 34) | |||||||||||||||
| Age group | Total | ||||||||||||||
|---|---|---|---|---|---|---|---|---|---|---|---|---|---|---|---|
| 0-4 | 5-9 | 10-14 | 15-19 | 20-24 | 25-29 | 30-34 | 35-39 | 40-44 | 45-49 | 50-54 | 55-59 | 60-64 | 65+ | ||
| Male | 1,697 | 3,368 | 3,544 | 3,257 | 3,027 | 3,207 | 3,186 | 2,799 | 2,411 | 2,236 | 2,144 | 1,974 | 1,674 | 2,637 | 37,161 |
| Female | 1,611 | 3,392 | 3,565 | 4,288 | 4,246 | 4,436 | 4,294 | 3,579 | 3,105 | 2,755 | 2,656 | 2,553 | 2,155 | 3,921 | 46,556 |
| Total | 3,308 | 6,760 | 7,109 | 7,545 | 7,273 | 7,643 | 7,480 | 6,378 | 5,516 | 4,991 | 4,800 | 4,527 | 3,829 | 6,558 | 83,717 |
| Average age: 34 (Male: 33, Female: 35) | |||||||||||||||
| Age group | Total | ||||||||||||||
|---|---|---|---|---|---|---|---|---|---|---|---|---|---|---|---|
| 0-4 | 5-9 | 10-14 | 15-19 | 20-24 | 25-29 | 30-34 | 35-39 | 40-44 | 45-49 | 50-54 | 55-59 | 60-64 | 65+ | ||
| Male | 885 | 1,172 | 1,047 | 1,032 | 1,033 | 1,150 | 1,208 | 1,107 | 985 | 944 | 1,169 | 1,182 | 948 | 1,825 | 15,687 |
| Female | 853 | 1,137 | 1,117 | 1,712 | 2,022 | 2,158 | 2,152 | 1,826 | 1,552 | 1,381 | 1,526 | 1,502 | 1,312 | 2,469 | 22,719 |
| Total | 1,738 | 2,309 | 2,164 | 2,744 | 3,055 | 3,308 | 3,360 | 2,933 | 2,537 | 2,325 | 2,695 | 2,684 | 2,260 | 4,294 | 38,406 |
| Average age: 38 (Male: 37, Female: 38) | |||||||||||||||
| Age group | Total | ||||||||||||||
|---|---|---|---|---|---|---|---|---|---|---|---|---|---|---|---|
| 0-4 | 5-9 | 10-14 | 15-19 | 20-24 | 25-29 | 30-34 | 35-39 | 40-44 | 45-49 | 50-54 | 55-59 | 60-64 | 65+ | ||
| Male | 9,072 | 17,978 | 18,574 | 18,423 | 17,057 | 19,133 | 20,028 | 17,703 | 15,944 | 15,550 | 16,594 | 16,267 | 14,220 | 25,129 | 241,672 |
| Female | 8,416 | 18,353 | 19,583 | 25,356 | 27,097 | 29,604 | 28,954 | 24,366 | 21,307 | 19,824 | 20,673 | 20,332 | 18,102 | 35,716 | 317,683 |
| Total | 17,488 | 36,331 | 38,157 | 43,779 | 44,154 | 48,737 | 48,982 | 42,069 | 37,251 | 35,374 | 37,267 | 36,599 | 32,322 | 60,845 | 559,355 |
| Average age: 37 (Male: 37, Female: 38) | |||||||||||||||
| Region | Total | |||||||
|---|---|---|---|---|---|---|---|---|
| Atlantic | Quebec | Ontario | Manitoba | Saskatchewan | Alberta | North | ||
| Male | 41 | 40 | 42 | 34 | 33 | 33 | 37 | 37 |
| Female | 41 | 41 | 43 | 35 | 34 | 35 | 38 | 38 |
| Total | 41 | 41 | 42 | 35 | 34 | 34 | 38 | 37 |
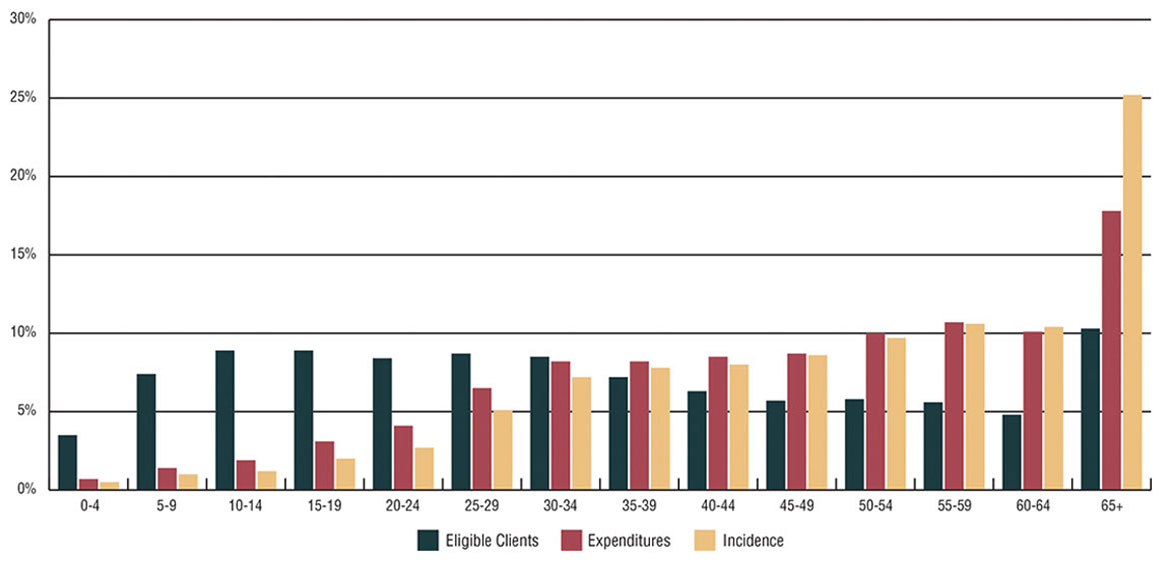
Distribution of eligible NIHB population, pharmacy expenditures and pharmacy incidence by age group: 2022 to 2023
In 2022 to 2023, 3.5% of all clients were in the 0 to 4 age group, but this group accounted for only 0.5% of all pharmacy claims made and only 0.7% of total pharmacy expenditures. In contrast, 10.3% of all eligible clients were in the 65+ age group, but accounted for 25.2% of all pharmacy claims submitted and 17.8% of total pharmacy expenditures.
During 2022 to 2023, the average claimant aged 65 or more submitted 91 claims compared to 71 claims for their counterpart in the 60 to 64 age group and 6 claims for the average claimant in the 0 to 4 age group.
Source: HICPS, FST and SVS adapted by Program Analytics and Risk Mitigation
Text alternative for Figure 4.4: Distribution of eligible NIHB population, pharmacy expenditures and pharmacy incidence by age group
This image is a bar graph which visually describes percentage of NIHB annual pharmacy expenditures and incidence by age group, as follows:
| Age | Eligible clients | Expenditures | Incidence |
|---|---|---|---|
| 0-4 | 3.5% | 0.7% | 0.5% |
| 5-9 | 7.4% | 1.4% | 1.0% |
| 10-14 | 8.9% | 1.9% | 1.2% |
| 15-19 | 8.9% | 3.1% | 2.0% |
| 20-24 | 8.4% | 4.1% | 2.7% |
| 25-29 | 8.7% | 6.5% | 5.1% |
| 30-34 | 8.5% | 8.2% | 7.2% |
| 35-39 | 7.2% | 8.2% | 7.8% |
| 40-44 | 6.3% | 8.5% | 8.0% |
| 45-49 | 5.7% | 8.7% | 8.6% |
| 50-54 | 5.8% | 10.0% | 9.7% |
| 55-59 | 5.6% | 10.7% | 10.6% |
| 60-64 | 4.8% | 10.1% | 10.4% |
| 65+ | 10.3% | 17.8% | 25.2% |
| Total | 100.0% | 100.0% | 100.0% |
An examination of pharmacy benefit cost per NIHB claimant indicates that these expenditures vary according to age. For example, in 2022 to 2023 the average cost per child aged 0 to 9 years was $234. The cost increased steadily for every age group, with claimants aged 35-39 having an average cost of $1,148, comparable to the total average claimant cost of $1,056. Claimants aged 60-64 years had the highest cost per claimant with an average of $1,854 for all pharmacy claims received throughout the fiscal year.
NIHB Top ten therapeutic classes by number of claimants: 2022 to 2023
Table 4.5 ranks the top ten therapeutic classes of prescription drugs according to number of claimants. In 2022 to 2023, Penicillins had the highest number of distinct claimants at 160,840. Antidepressants ranked second in number of claimants with 121,413 followed by Proton Pump Inhibitors with 111,091 claimants.
| Therapeutic Classification | Claimants | % Change from 2021-2022 | Examples of Product in the Therapeutic Class |
|---|---|---|---|
| Penicillins | 160,840 | 28.3% | Amoxil (Amoxicillin) |
| Antidepressants | 121,413 | 4.8% | Effexor (Venlafaxine) |
| Proton Pump Inhibitors | 111,091 | 2.4% | Losec (Omeprazole) |
| Non-Steroidal Anti-Inflammatory Drugs (NSAID) | 104,903 | 6.2% | Voltaren (Diclofenac) |
| Beta-Adrenergic Agonists | 95,164 | 25.2% | Ventolin (Salbutamol) |
| Opioid Agonists | 90,497 | 1.6% | Statex (Morphine Sulphate) |
| HMG-COA Reductase Inhibitors (Statins) | 82,370 | 5.2% | Lipitor (Atorvastatin) |
| Adrenals | 78,927 | 25.7% | Flovent (Fluticasone Propionate) |
| Angiotensin-Converting Enzyme Inhibitors | 71,467 | 2.1% | Altace (Ramipril) |
| Cephalosporins | 70,417 | 6.9% | Keflex (Cephalexin) |
| Source: HICPS adapted by Program Analytics and Risk Mitigation | |||
NIHB OTC (including CAD) drug claims incidence by therapeutic class: 2022 to 2023
Table 4.6 looks at the number of claims by therapeutic classification for over-the-counter (OTC) drugs.
Vitamins accounted for the largest number of OTC drug claims in 2022 to 2023 at 1.5 million paid claims, or 32.7% of all OTC claims. Central nervous systems agents had the next highest share of OTC claims at 1.0 million (22.1%) followed by gastrointestinal drugs at 365,751 claims (8.0%).
| Category | Claims | % Change from 2021-2022 | Examples |
|---|---|---|---|
| Vitamins | 1,501,990 | 7.6% | Vitamin D (Cholecalciferol) |
| Central Nervous System Agents | 1,014,832 | 5.7% | Tylenol (Acetaminophen) |
| Gastrointestinal Drugs | 365,751 | 7.3% | Senokot (Sennosides) |
| Blood Formation and Coagulation | 342,957 | 7.7% | Iron (Ferrous Gluconate) |
| Diabetic Devices | 282,985 | -1.6% | Lancets |
| Hormone & Synthetic Substitutes | 215,051 | -3.4% | Lantus (Insulin Glargine) |
| Skin & Mucous Membrane Agents | 189,623 | 11.5% | Nix (Permethrin) |
| Antihistamines | 132,694 | 6.7% | Reactine (Cetirizine) |
| Diagnostic Agents | 129,576 | -7.7% | Blood Glucose Test Strips |
| Autonomic Drugs | 91,370 | 6.7% | Nicoderm (Nicotine) |
| Source: HICPS adapted by Program Analytics and Risk Mitigation | |||
Section 5: NIHB Medical Supplies and Equipment (MS&E) expenditure and utilization data
A range of medical supplies and equipment (MS&E) items are covered by the NIHB program. Items covered through the MS&E benefit are intended to address NIHB clients' medical needs in relation to basic activities of daily living (ADL) such as eating, bathing, dressing, toileting and transferring, and include:
- Audiology supplies and equipment
- Limb and body orthotics supplies and equipment
- Footwear supplies and equipment
- Oxygen supplies and equipment
- Pressure devices supplies and equipment
- Prosthetics supplies and equipment
- Respiratory supplies and equipment
- Self-care supplies and equipment
- Low vision supplies and equipment
- Mobility supplies and equipment
- Communication supplies and equipment
- Medical surgical supplies and equipment
MS&E benefits are evidence-based and covered in accordance with program policies. Most items must be approved in advance by the NIHB regional office before they are distributed by an NIHB provider.
Prior to the 2020 to 2021 NIHB Annual Report, expenditure and utilization data for the MS&E benefit were combined with pharmacy benefits in reporting.
In 2022 to 2023, the NIHB program paid for MS&E claims made by a total of 77,818 First Nations and Inuit clients. The total spent for these claims was $65.7 million or 3.5% of total NIHB expenditures.
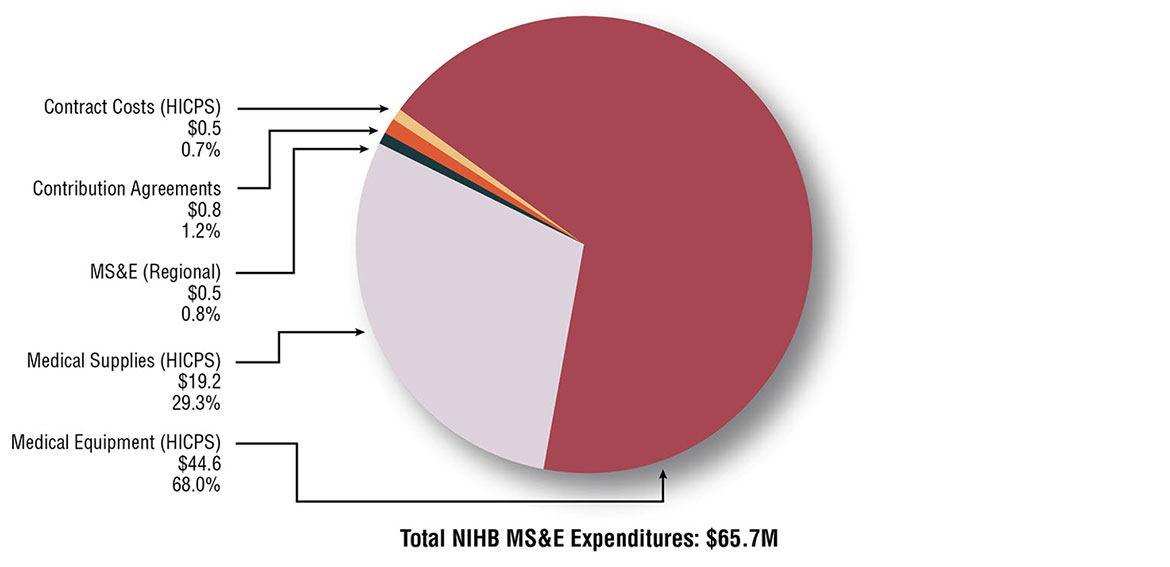
Distribution of NIHB MS&E expenditures ($ Millions): 2022 to 2023
The NIHB MS&E benefit is comprised of multiple components. The cost of medical equipment paid through the HICPS system was the largest component, accounting for $44.6 million or 68.5% of all NIHB MS&E expenditures, followed by medical supplies paid through HICPS which totalled $19.2 million or 29.5%.
Contribution agreements, which accounted for $0.3 million or 0.5% of total MS&E benefit costs, are used to fund the provision of benefits through agreements such as those with the Mohawk Council of Akwesasne in Ontario and the Bigstone Cree Nation in Alberta.
Regional MS&E, which refers to MS&E items paid through Indigenous Services Canada regional offices, accounted for $0.5 million or 0.8%.
HICPS contract costs related to claims processing through the HICPS system totalled $0.5 million or 0.7% of MS&E expenditures in 2022 to 2023.
Source: FST adapted by Program Analytics and Risk Mitigation
Text alternative for Figure 5.1: Distribution of NIHB MS&E expenditures ($ Millions)
This image is a pie chart which visually describes NIHB medical supplies and equipment expenditures in millions and proportion of total expenditures by component type:
- medical supplies (HICPS) are $19.2 and 29.5%
- medical equipment (HICPS) are $44.6 and 68.5%
- contract costs are $0.5 and 0.7%
- contribution agreements are $0.3 and 0.5%
- MS&E (regional) are $0.5 and 0.8%
- total expenditures $65.7
Total NIHB MS&E expenditures by type and region (thousands of dollars): 2022 to 2023
Medical equipment costs paid through the HICPS system represented the largest component of total NIHB MS&E costs accounting for $44.6 million or 68.5%. Saskatchewan had the largest proportion of these costs at 23.8%, followed by Manitoba at 22.2% and Alberta at 19.8%.
The next highest component was medical supplies costs at $19.2 million or 29.5%. Saskatchewan (24.4%), Alberta (19.0%) and Manitoba (18.3%) had the largest proportions of these costs in 2022 to 2023.
All other MS&E expenditures, including contribution agreement costs, account for only 2.0% of total MS&E expenditure.
| Region | Operating | Total Operating Costs | Total Contribution Costs | Total Costs | |||
|---|---|---|---|---|---|---|---|
| MS&E Regional | Medical Supplies | Medical Equipment | HICPS Contract Costs | ||||
| Atlantic | $17 | $1,254 | $3,515 | $0 | $4,785 | $0 | $4,785 |
| Quebec | $0 | $1,113 | $2,036 | $0 | $3,149 | $0 | $3,149 |
| Ontario | $19 | $3,216 | $6,248 | $0 | $9,483 | $562 | $10,045 |
| Manitoba | $413 | $3,523 | $9,933 | $0 | $13,870 | $0 | $13,870 |
| Saskatchewan | $24 | $4,679 | $10,606 | $0 | $15,310 | $0 | $15,310 |
| Alberta | $19 | $3,654 | $8,831 | $0 | $12,503 | $0 | $12,503 |
| North | $30 | $1,775 | $3,478 | $0 | $5,284 | $236 | $5,520 |
| Headquarters | $0 | $0 | $0 | $488 | $488 | $0 | $488 |
| Total | $522 | $19,215 | $44,647 | $488 | $64,872 | $798 | $65,669 |
| Source: FST adapted by Program Analytics and Risk Mitigation | |||||||
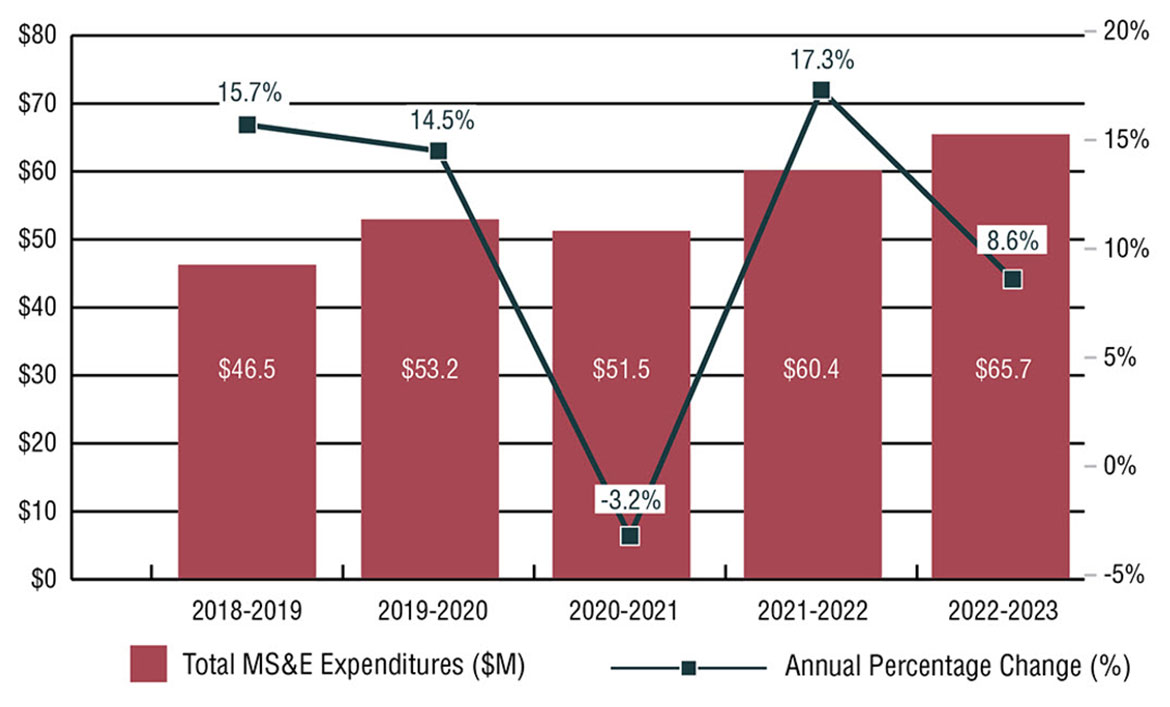
Annual NIHB MS&E expenditures
NIHB MS&E expenditures increased by 17.3% during fiscal year 2022 to 2023. The coronavirus (COVID-19) outbreak and provincial/territorial public health restrictions on the provision of in-person services in fiscal year 2020 to 2021, along with larger than typical utilization of the benefit in fiscal 2021 to 2022 once restrictions were ended, impacted growth in the past two years. Over the past five years, growth in MS&E expenditures has ranged from a high of 17.3% in 2021 to 2022 to a low of -3.2% in 2020 to 2021.
The five year annualized growth rate for NIHB MS&E expenditures is 8.5%.
Source: FST and FIRMS adapted by Program Analytics and Risk Mitigation
Text alternative for Figure 5.2: Annual NIHB MS&E expenditures
This is a bar graph which visually describes NIHB annual pharmacy expenditures in millions and percentage change by fiscal year, as follows:
- 2018 to 2019 are $46.5 and 15.7%
- 2019 to 2020 are $53.2 and 14.5%
- 2020 to 2021 are $51.5 and -3.2%
- 2021 to 2022 are $60.4 and 17.3%
- 2022 to 2023 are $65.7 and 8.6%
| Region | 2018 to 2019 | 2019 to 2020 | 2020 to 2021 | 2021 to 2022 | 2022 to 2023 |
|---|---|---|---|---|---|
| Atlantic | $3,900 | $4,359 | $4,177 | $4,508 | $4,785 |
| Quebec | $2,345 | $2,564 | $2,379 | $2,855 | $3,149 |
| Ontario | $6,662 | $7,322 | $7,297 | $8,701 | $10,045 |
| Manitoba | $9,166 | $11,966 | $11,146 | $13,330 | $13,870 |
| Saskatchewan | $10,762 | $11,889 | $11,908 | $13,352 | $15,310 |
| Alberta | $9,127 | $10,250 | $9,647 | $11,658 | $12,503 |
| North | $4,529 | $4,884 | $4,024 | $5,647 | $5,520 |
| Headquarters | -$10 | -$12 | $592 | $399 | $488 |
| Total | $46,481 | $53,222 | $51,525 | $60,449 | $65,669 |
| Source: FST adapted by Program Analytics and Risk Mitigation | |||||
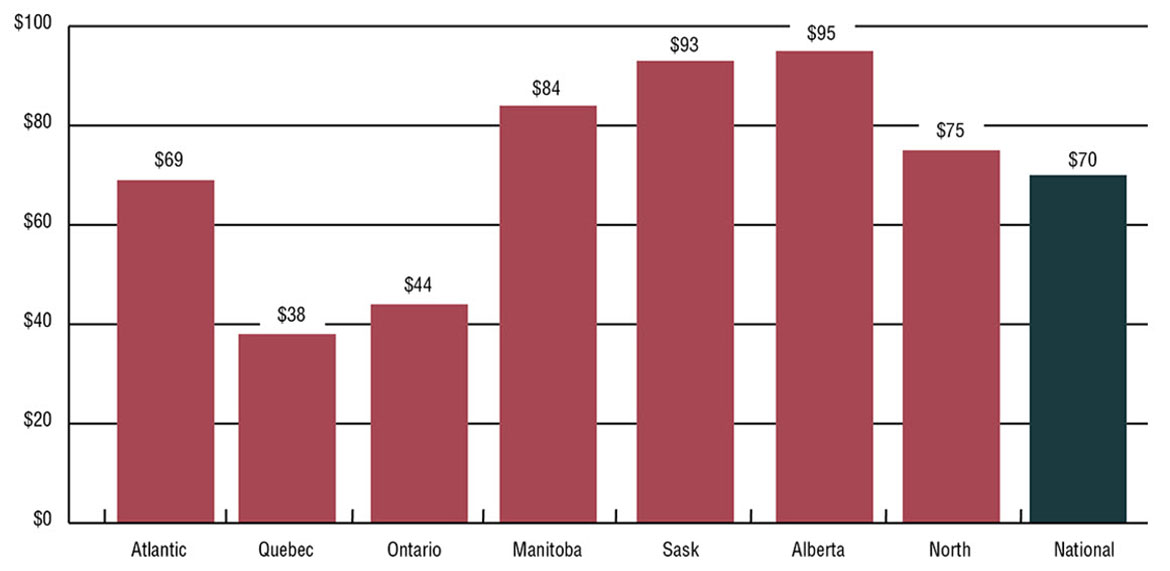
Per capita NIHB MS&E expenditures by region: 2022 to 2023
Expenditures per capita are total NIHB MS&E expenditures divided by the number of eligible clients, regardless of whether clients submitted a claim in the reporting period.
In 2022 to 2023, the national per capita expenditure for NIHB MS&E benefits was $70. This was an increase of 6.2% from the $66 recorded in 2021 to 2022.
Alberta had the highest per capita NIHB MS&E expenditures at $95, followed by Saskatchewan and Manitoba at $93 and $84.
Quebec had the lowest per capita MS&E expenditures at $38 followed by Ontario at $44. Relatively low per capita expenditures in Quebec and Ontario are attributed to provincial programs which provide financial assistance for the provision of certain medical equipment items to all residents.
Source: FST and SVS adapted by Program Analytics and Risk Mitigation
Text alternative for Figure 5.3: Per capita NIHB MS&E expenditures by region
This image is a bar graph which visually describes NIHB MS&E expenditures per capita by region, as follows:
- Atlantic has $69
- Quebec has $38
- Ontario has $44
- Manitoba has $84
- Saskatchewan has $93
- Alberta has $95
- North has $75 and
- National has $70
NIHB MS&E utilization rates by region
Utilization rates are the number of clients who received at least one MS&E benefit paid through the HICPS system in the fiscal year, as a proportion of the total number of eligible clients.
In 2022 to 2023, the national utilization rate was 8.3% for NIHB MS&E benefits paid through the HICPS system.
The rates understate the actual level of utilization as the data do not include MS&E services provided through contribution agreements and benefits provided through community health facilities.
| Region | 2018-2019 | 2019-2020 | 2020-2021 | 2021-2022 | 2022-2023 |
|---|---|---|---|---|---|
| Atlantic | 8% | 10% | 10% | 12% | 10% |
| Quebec | 6% | 7% | 7% | 9% | 7% |
| Ontario | 5% | 5% | 5% | 7% | 6% |
| Manitoba | 10% | 11% | 12% | 14% | 11% |
| Saskatchewan | 8% | 10% | 10% | 13% | 10% |
| Alberta | 7% | 8% | 8% | 10% | 8% |
| North | 6% | 7% | 7% | 11% | 8% |
| National | 6% | 7% | 6% | 9% | 8% |
| Source: HICPS and SVS adapted by Program Analytics and Risk Mitigation | |||||
NIHB MS&E claimants by age group, gender and region: 2022 to 2023
Of the 936,006 clients eligible to receive benefits under the NIHB program, a total of 77,818 claimants, representing 8.3% of the NIHB client population, received at least one MS&E item paid through the Health Information and Claims Processing Services (HICPS) system in 2022 to 2023. Of this total, 45,166 were female (58%) and 32,652 were male (42%). This compares to the total eligible population where 51% were female and 49% were male.
The average age of MS&E claimants was 50 years. The average age for female and male claimants was 51 and 49 years of age, respectively.
Table 5.4: NIHB MS&E claimants by age group, gender and region
Source: HICPS and SVS adapted by Program Analytics and Risk Mitigation
| Age group | Total | ||||||||||||||
|---|---|---|---|---|---|---|---|---|---|---|---|---|---|---|---|
| 0-4 | 5-9 | 10-14 | 15-19 | 20-24 | 25-29 | 30-34 | 35-39 | 40-44 | 45-49 | 50-54 | 55-59 | 60-64 | 65+ | ||
| Male | 47 | 92 | 92 | 62 | 67 | 95 | 132 | 150 | 145 | 195 | 266 | 286 | 314 | 951 | 2,894 |
| Female | 32 | 56 | 64 | 74 | 122 | 167 | 187 | 202 | 217 | 278 | 346 | 439 | 431 | 1,316 | 3,931 |
| Total | 79 | 148 | 156 | 136 | 189 | 262 | 319 | 352 | 362 | 473 | 612 | 725 | 745 | 2,267 | 6,825 |
| Average age: 53 (Male: 52, Female: 54) | |||||||||||||||
| Age group | Total | ||||||||||||||
|---|---|---|---|---|---|---|---|---|---|---|---|---|---|---|---|
| 0-4 | 5-9 | 10-14 | 15-19 | 20-24 | 25-29 | 30-34 | 35-39 | 40-44 | 45-49 | 50-54 | 55-59 | 60-64 | 65+ | ||
| Male | 18 | 56 | 98 | 73 | 57 | 76 | 99 | 130 | 147 | 162 | 194 | 260 | 293 | 836 | 2,499 |
| Female | 14 | 35 | 77 | 69 | 85 | 125 | 155 | 161 | 140 | 217 | 240 | 330 | 389 | 1,272 | 3,309 |
| Total | 32 | 91 | 175 | 142 | 142 | 201 | 254 | 291 | 287 | 379 | 434 | 590 | 682 | 2,108 | 5,808 |
| Average age: 55 (Male: 53, Female: 56) | |||||||||||||||
| Age group | Total | ||||||||||||||
|---|---|---|---|---|---|---|---|---|---|---|---|---|---|---|---|
| 0-4 | 5-9 | 10-14 | 15-19 | 20-24 | 25-29 | 30-34 | 35-39 | 40-44 | 45-49 | 50-54 | 55-59 | 60-64 | 65+ | ||
| Male | 36 | 97 | 134 | 136 | 127 | 161 | 206 | 272 | 310 | 357 | 525 | 580 | 666 | 1,924 | 5,531 |
| Female | 21 | 65 | 118 | 155 | 219 | 287 | 320 | 346 | 405 | 514 | 653 | 763 | 848 | 2,851 | 7,565 |
| Total | 57 | 162 | 252 | 291 | 346 | 448 | 526 | 618 | 715 | 871 | 1,178 | 1,343 | 1,514 | 4,775 | 13,096 |
| Average age: 55 (Male: 54, Female: 56) | |||||||||||||||
| Age group | Total | ||||||||||||||
|---|---|---|---|---|---|---|---|---|---|---|---|---|---|---|---|
| 0-4 | 5-9 | 10-14 | 15-19 | 20-24 | 25-29 | 30-34 | 35-39 | 40-44 | 45-49 | 50-54 | 55-59 | 60-64 | 65+ | ||
| Male | 132 | 334 | 349 | 391 | 304 | 395 | 456 | 451 | 499 | 626 | 700 | 815 | 809 | 1,677 | 7,938 |
| Female | 72 | 276 | 317 | 438 | 581 | 696 | 718 | 673 | 634 | 779 | 978 | 1,009 | 996 | 2,382 | 10,549 |
| Total | 204 | 610 | 666 | 829 | 885 | 1,091 | 1,174 | 1,124 | 1,133 | 1,405 | 1,678 | 1,824 | 1,805 | 4,059 | 18,487 |
| Average age: 47 (Male: 47, Female: 48) | |||||||||||||||
| Age group | Total | ||||||||||||||
|---|---|---|---|---|---|---|---|---|---|---|---|---|---|---|---|
| 0-4 | 5-9 | 10-14 | 15-19 | 20-24 | 25-29 | 30-34 | 35-39 | 40-44 | 45-49 | 50-54 | 55-59 | 60-64 | 65+ | ||
| Male | 157 | 278 | 333 | 356 | 294 | 395 | 478 | 416 | 465 | 518 | 660 | 627 | 644 | 1,398 | 7,019 |
| Female | 109 | 203 | 292 | 451 | 663 | 820 | 851 | 716 | 586 | 690 | 828 | 880 | 905 | 2,194 | 10,188 |
| Total | 266 | 481 | 625 | 807 | 957 | 1,215 | 1,329 | 1,132 | 1,051 | 1,208 | 1,488 | 1,507 | 1,549 | 3,592 | 17,207 |
| Average age: 46 (Male: 45, Female: 47) | |||||||||||||||
| Age group | Total | ||||||||||||||
|---|---|---|---|---|---|---|---|---|---|---|---|---|---|---|---|
| 0-4 | 5-9 | 10-14 | 15-19 | 20-24 | 25-29 | 30-34 | 35-39 | 40-44 | 45-49 | 50-54 | 55-59 | 60-64 | 65+ | ||
| Male | 66 | 129 | 162 | 150 | 143 | 190 | 246 | 288 | 272 | 338 | 380 | 417 | 425 | 1,034 | 4,240 |
| Female | 68 | 123 | 124 | 203 | 268 | 338 | 367 | 371 | 353 | 407 | 508 | 581 | 579 | 1,655 | 5,945 |
| Total | 134 | 252 | 286 | 353 | 411 | 528 | 613 | 659 | 625 | 745 | 888 | 998 | 1,004 | 2,689 | 10,185 |
| Average age: 50 (Male: 49, Female: 50) | |||||||||||||||
| Age group | Total | ||||||||||||||
|---|---|---|---|---|---|---|---|---|---|---|---|---|---|---|---|
| 0-4 | 5-9 | 10-14 | 15-19 | 20-24 | 25-29 | 30-34 | 35-39 | 40-44 | 45-49 | 50-54 | 55-59 | 60-64 | 65+ | ||
| Male | 59 | 120 | 104 | 96 | 59 | 63 | 104 | 107 | 131 | 124 | 213 | 270 | 228 | 682 | 2,360 |
| Female | 62 | 109 | 101 | 101 | 137 | 186 | 201 | 179 | 196 | 232 | 308 | 346 | 322 | 931 | 3,411 |
| Total | 121 | 229 | 205 | 197 | 196 | 249 | 305 | 286 | 327 | 356 | 521 | 616 | 550 | 1,613 | 5,771 |
| Average age: 49 (Male: 49, Female: 50) | |||||||||||||||
| Age group | Total | ||||||||||||||
|---|---|---|---|---|---|---|---|---|---|---|---|---|---|---|---|
| 0-4 | 5-9 | 10-14 | 15-19 | 20-24 | 25-29 | 30-34 | 35-39 | 40-44 | 45-49 | 50-54 | 55-59 | 60-64 | 65+ | ||
| Male | 519 | 1,109 | 1,278 | 1,270 | 1,054 | 1,378 | 1,731 | 1,830 | 1,985 | 2,327 | 2,962 | 3,280 | 3,392 | 8,537 | 32,652 |
| Female | 379 | 870 | 1,098 | 1,498 | 2,085 | 2,625 | 2,813 | 2,657 | 2,550 | 3,139 | 3,889 | 4,387 | 4,491 | 12,685 | 45,166 |
| Total | 898 | 1,979 | 2,376 | 2,768 | 3,139 | 4,003 | 4,544 | 4,487 | 4,535 | 5,466 | 6,851 | 7,667 | 7,883 | 21,222 | 77,818 |
| Average age: 50 (Male: 49, Female: 51) | |||||||||||||||
| Region | Total | |||||||
|---|---|---|---|---|---|---|---|---|
| Atlantic | Quebec | Ontario | Manitoba | Saskatchewan | Alberta | North | ||
| Male | 52 | 53 | 54 | 47 | 45 | 49 | 49 | 49 |
| Female | 54 | 56 | 56 | 48 | 47 | 50 | 50 | 51 |
| Total | 53 | 55 | 55 | 47 | 46 | 50 | 49 | 50 |
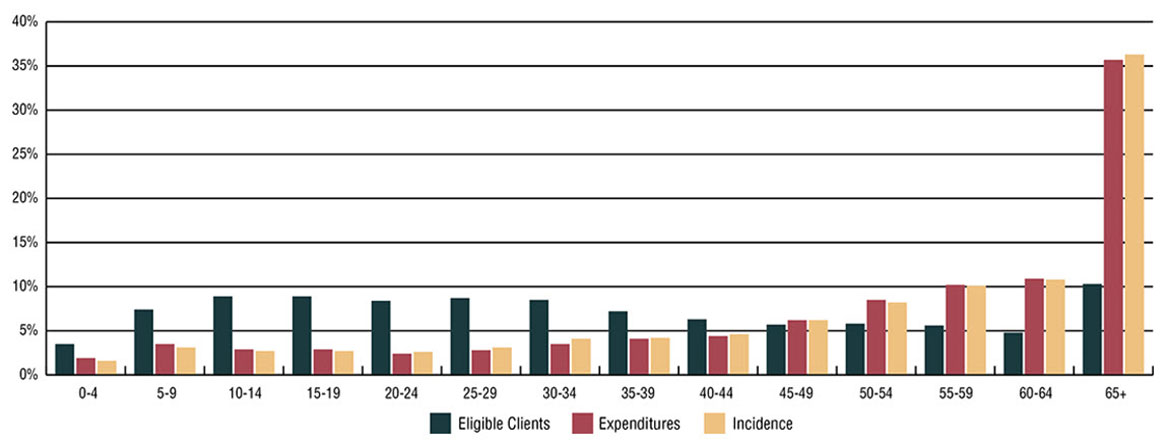
Distribution of eligible NIHB population, MS&E expenditures and MS&E incidence by age group: 2022 to 2023
In 2022 to 2023, 3.5% of all clients were in the 0 to 4 age group, but this group accounted for only 1.6% of all MS&E claims made and only 1.9% of total MS&E expenditures. In contrast, 10.3% of all eligible clients were in the 65+ age group, but they accounted for 36.3 % of all MS&E claims submitted and 35.7% of total MS&E expenditures.
The average MS&E claimant submitted 5 claims in 2022 to 2023, a rate that is relatively consistent over all age groups.
Source: HICPS, FST and SVS adapted by Program Analytics and Risk Mitigation
Text alternative for Figure 5.4: Distribution of eligible NIHB population, MS&E expenditures and MS&E incidence by age group
This image visually describes NIHB annual MS&E expenditures and incidence by age group, as follows:
| Age | Eligible Clients | Expenditures | Incidence |
|---|---|---|---|
| 0-4 | 3.5% | 1.9% | 1.6% |
| 5-9 | 7.4% | 3.5% | 3.1% |
| 10-14 | 8.9% | 2.9% | 2.7% |
| 15-19 | 8.9% | 2.9% | 2.7% |
| 20-24 | 8.4% | 2.4% | 2.6% |
| 25-29 | 8.7% | 2.8% | 3.1% |
| 30-34 | 8.5% | 3.5% | 4.1% |
| 35-39 | 7.2% | 4.1% | 4.2% |
| 40-44 | 6.3% | 4.4% | 4.6% |
| 45-49 | 5.7% | 6.2% | 6.2% |
| 50-54 | 5.8% | 8.5% | 8.2% |
| 55-59 | 5.6% | 10.2% | 10.1% |
| 60-64 | 4.8% | 10.9% | 10.8% |
| 65+ | 10.3% | 35.7% | 36.3% |
| Total | 100.0% | 100.0% | 100.0% |
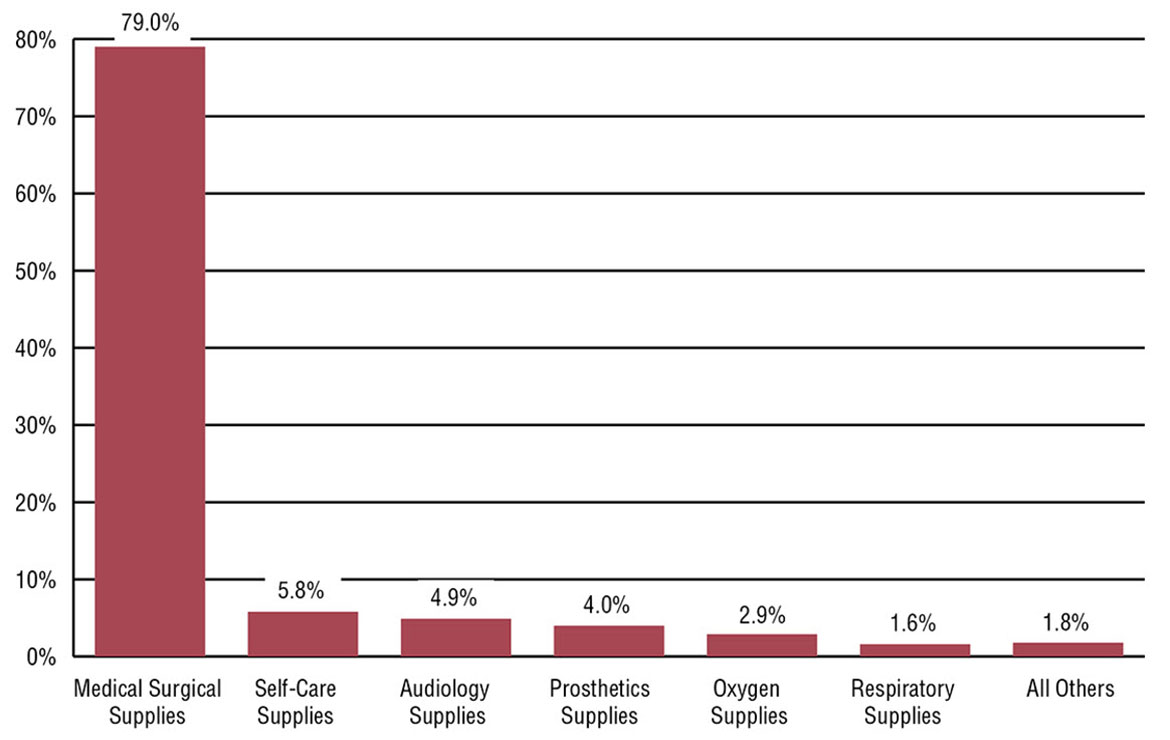
NIHB medical supplies expenditures by category: 2022 to 2023
In 2022 to 2023, medical surgical supplies such as incontinence items accounted for 79.0% of all medical supply expenditures, an increase from the 74.3% recorded in 2021 to 2022. Self-care supplies, such as enteral feeding bags, represented 5.8% of all medical supply expenditures, followed by audiology supplies, such as hearing aid batteries at 4.9%.
Source: HICPS adapted by Program Analytics and Risk Mitigation
Text alternative for Figure 5.5: NIHB medical supplies expenditures by category
This bar graph visually describes percentage of NIHB medical equipment expenditures by category, as follows:
- medical surgical supplies is 79.0%
- self-care supplies is 5.8%
- audiology supplies is 4.9%
- prosthetic supplies is 4.0%
- oxygen supplies is 2.9%
- respiratory supplies is 1.6%
- all others is 1.8%
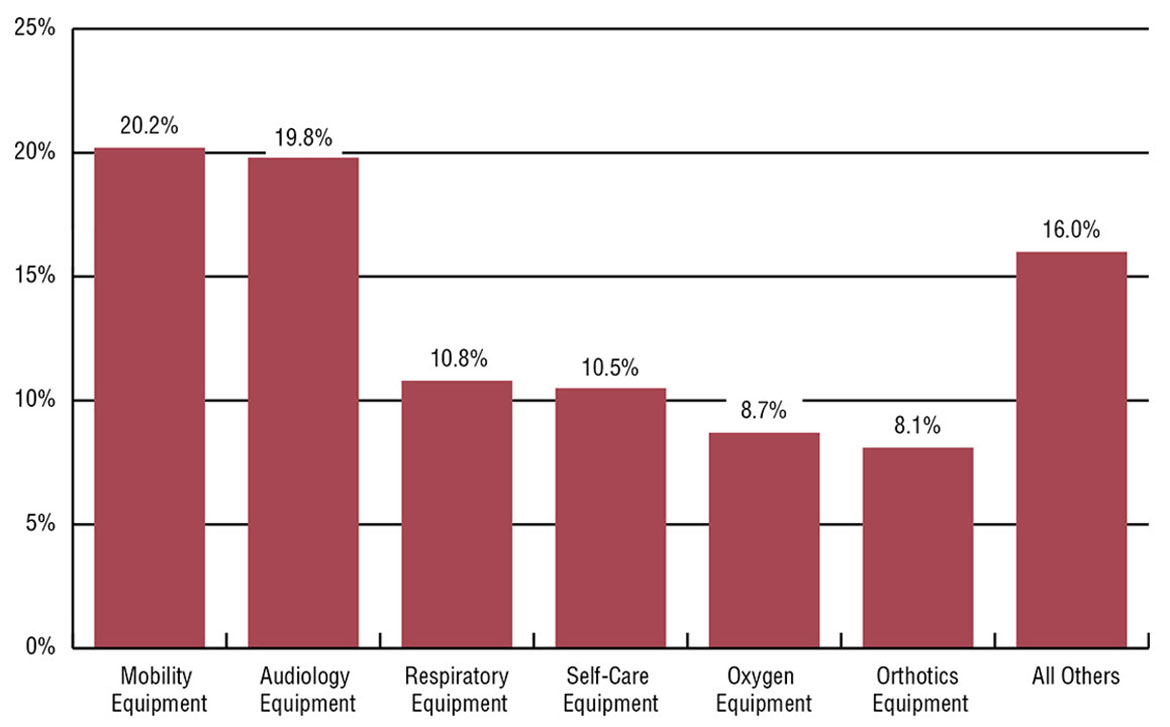
NIHB medical equipment expenditures by category: 2022 to 2023
In 2022 to 2023, mobility equipment such as wheelchairs accounted for 20.2% of all medical equipment expenditures, a decrease from the 21.7% recorded in 2021 to 2022. Audiology equipment, such as hearing aids, represented 19.8% of all medical equipment expenditures, followed by respiratory equipment such as CPAP machines at 10.8%.
Source: HICPS adapted by Program Analytics and Risk Mitigation
Text alternative for Figure 5.6: NIHB medical supplies expenditures by category
This bar graph visually describes percentage of NIHB medical equipment expenditures by category, as follows:
- mobility equipment is 20.2%
- audiology equipment is 19.8%
- self-care equipment is 10.8%
- respiratory equipment is 10.5%
- oxygen equipment is 8.7%
- orthotics equipment is 8.1%
- all others is 16.0%
Section 6: NIHB dental expenditure and utilization data
The NIHB program covers a broad range of dental services including:
- diagnostic services such as examinations and radiographs
- preventive services such as scaling, polishing, fluorides and sealants
- restorative services such as fillings and crowns
- endodontic services such as root canal treatments
- periodontal services such as deep scaling
- removable prosthodontic services such as partial or complete dentures
- oral surgery services such as extractions
- orthodontic services such as braces
- adjunctive services such as general anesthesia and sedation.
In 2022 to 2023, a total of 330,494 First Nations and Inuit clients accessed dental benefits through the NIHB program, based on claims paid through the HICPS system. The total expenditure for dental benefits was $332.8 million or 17.6% of total NIHB expenditures. The dental benefit accounts for the third largest program expenditure.
Some dental services require predetermination prior to the initiation of treatment. Predetermination is a review that determines if the proposed dental service is covered under the program's guidelines and criteria, as described in the NIHB Dental Benefits Guide. This review is undertaken by the Dental Predetermination Centre (DPC).
Distribution of NIHB dental expenditures ($ millions): 2022 to 2023
NIHB dental expenditures are comprised of multiple distinct components. Fee-for-service dental costs paid through the HICPS system represented the largest expenditure portion, accounting for $304.9 million or 91.6% of all NIHB dental costs.
The next highest component was contribution agreements, which accounted for $15.5 million or 4.7% of total dental expenditures. Contribution agreements are used to fund the provision of dental benefits through agreements such as those with the Mohawk Council of Akwesasne in Ontario and the Bigstone Cree Nation in Alberta.
Expenditures for contract dentists providing services to clients in remote communities totalled $8.7 million or 2.6% of total costs.
HICPS contract costs related to claims processing through the HICPS system totalled $3.7 million or 1.1% in 2022 to 2023.
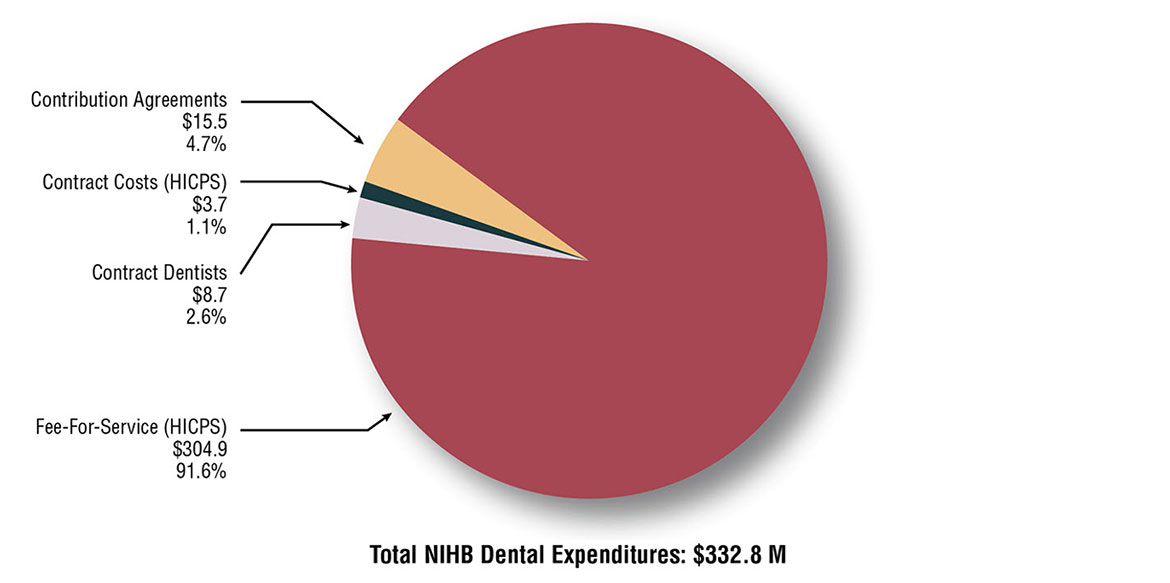
Source: FST adapted by Program Analytics and Risk Mitigation
Text alternative for Figure 6.1: Distribution of NIHB dental expenditures ($ millions)
This image is a pie chart which visually describes NIHB dental expenditures in millions by component type.
- expenditures for fee-for-service (HICPS) are $304.9 and 91.6%
- contract dentists is $8.7 and 2.6%
- HICPS contract costs is $3.7 and 1.1%
- contribution agreements is $15.5 and 4.7%
- total dental expenditures are $332.8
Total NIHB dental expenditures by type and region (thousands of dollars): 2022 to 2023
Of the $332.8 million in NIHB dental expenditures in 2022 to 2023, Saskatchewan (21.2%), Ontario (20.2%) and Alberta (19.6%) had the largest overall proportion. Saskatchewan had the highest total dental expenditures at $70.5 million and the Atlantic region had the lowest total dental expenditures at $12.6 million.
| Region | Operating | Total operating costs | Total contribution costs | Total costs | ||
|---|---|---|---|---|---|---|
| Fee-for-service | Contract dentists | HICPS contract costs | ||||
| Atlantic | $12,638 | $0 | $0 | $12,638 | $0 | $12,638 |
| Quebec | $20,427 | $0 | $0 | $20,427 | $0 | $20,427 |
| Ontario | $57,407 | $2,586 | $0 | $59,993 | $7,135 | $67,128 |
| Manitoba | $53,659 | $5,726 | $0 | $59,385 | $862 | $60,247 |
| Saskatchewan | $66,205 | $0 | $0 | $66,205 | $4,275 | $70,480 |
| Alberta | $62,185 | $67 | $0 | $62,252 | $2,988 | $65,240 |
| North | $29,761 | $320 | $0 | $30,082 | $251 | $30,332 |
| Headquarters | $0 | $0 | $3,693 | $3,693 | $0 | $3,693 |
| Total | $304,913 | $8,699 | $3,693 | $317,305 | $15,511 | $332,816 |
| Source: FST adapted by Program Analytics and Risk Mitigation | ||||||
Annual NIHB dental expenditures
NIHB dental expenditures increased by 10.1% during fiscal year 2022 to 2023. The coronavirus (COVID-19) outbreak and provincial/territorial public health restrictions on the provision of in-person services in fiscal year 2020 to 2021, along with larger than typical utilization of the benefit in fiscal 2021 to 2022 once restrictions were ended, significantly impacted growth in those two years.
Over the last five years, annual growth rates for NIHB dental expenditures have ranged from a high of 27.9% in 2021 to 2022 to a low of negative 16.5% in 2020 to 2021.
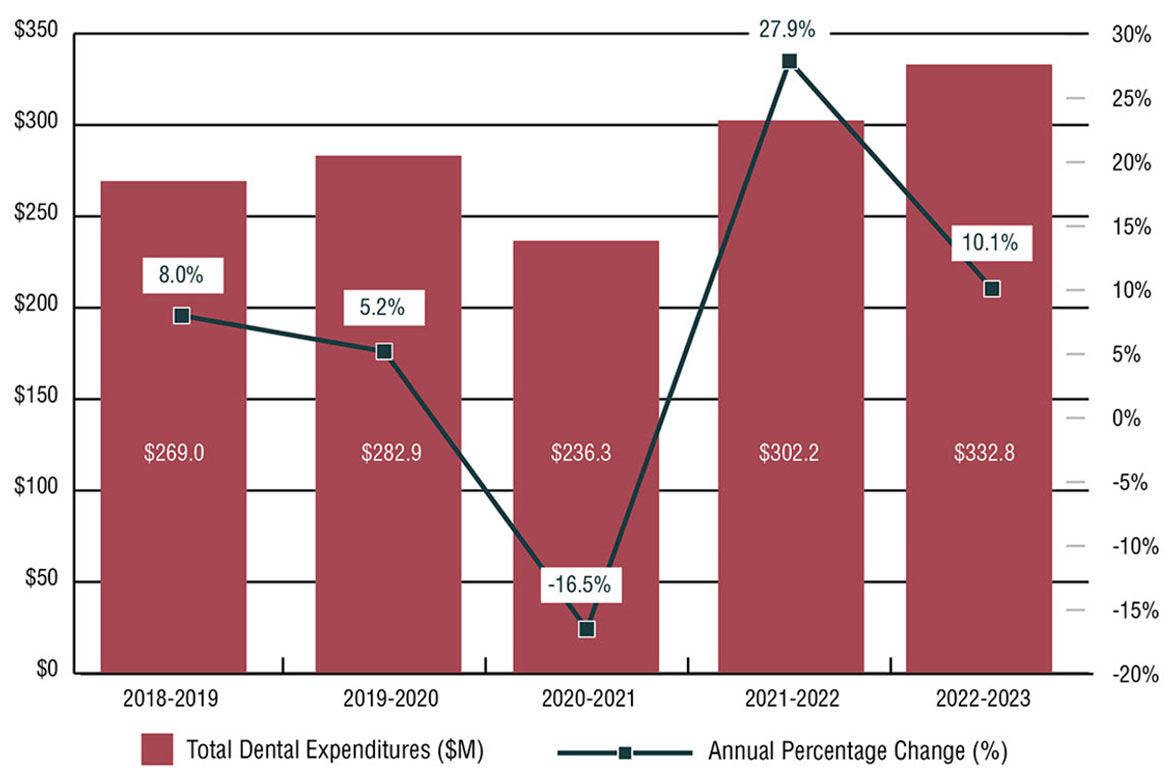
Source: FST adapted by Program Analytics and Risk Mitigation
Text alternative for Figure 6.2: NIHB Dental expenditures and annual percentage change
This image is a bar graph which visually describes NIHB dental expenditures in millions and annual percentage change by fiscal year, as follows:
- 2018 to 2019 is $269.0 and 8.0%
- 2019 to 2020 is $282.9 and 5.2%
- 2020 to 2021 is $236.3 and -16.5%
- 2021 to 2022 is $302.2 and 27.9%
- 2022 to 2023 is $332.8 and 10.1%
NIHB dental expenditures by region
| Region | 2018 to 2019 | 2019 to 2020 | 2020 to 2021 | 2021 to 2022 | 2022 to 2023 |
|---|---|---|---|---|---|
| Atlantic | $10,841 | $11,545 | $9,455 | $11,801 | $12,638 |
| Quebec | $17,882 | $18,733 | $14,934 | $19,092 | $20,427 |
| Ontario | $53,667 | $55,386 | $49,251 | $59,326 | $67,128 |
| Manitoba | $48,099 | $52,622 | $49,414 | $57,381 | $60,247 |
| Saskatchewan | $55,603 | $57,639 | $47,507 | $63,408 | $70,480 |
| Alberta | $51,617 | $54,993 | $47,799 | $58,790 | $65,240 |
| North | $26,211 | $26,546 | $20,703 | $26,830 | $30,332 |
| Headquarters | $3,423 | $5,361 | $3,070 | $3,108 | $3,693 |
| Total | $269,008 | $282,908 | $236,293 | $302,183 | $332,816 |
| Source: FST and FIRMS adapted by Program Analytics and Risk Mitigation | |||||
Per capita NIHB dental expenditures by region: 2022 to 2023
Expenditures per capita are total NIHB dental expenditures divided by the number of eligible clients, regardless of whether clients submitted a claim in the reporting period.
In 2022 to 2023, national per capita NIHB dental expenditures were $352, an increase of 7.7% from $327 in 2021 to 2022.
Alberta had the highest per capita dental expenditures at $495, followed by Saskatchewan at $426 and the Northern region at $413. The Atlantic region had the lowest per capita dental expenditures at $182 per eligible client.
Per capita values reflect NIHB dental expenditures only, and do not include additional dental services that may be provided to First Nations and Inuit populations through other Indigenous Services Canada programs or through transfers and other arrangements.
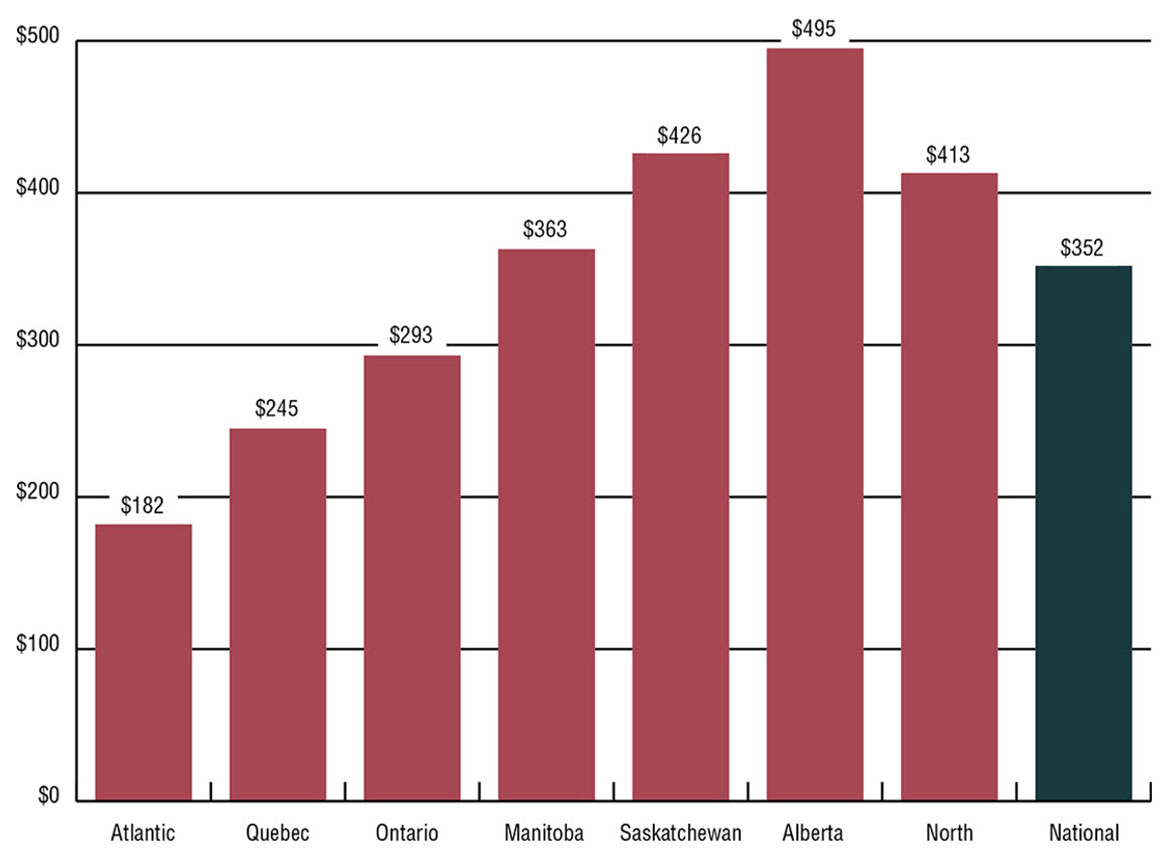
Source: FST and SVS adapted by Program Analytics and Risk Mitigation
Text alternative for Figure 6.3: Per capita NIHB dental expenditures by region
This image is a bar graph which visually describes NIHB dental expenditures per capita by region, as follows:
- Atlantic is $182
- Quebec is $245
- Ontario is $293
- Manitoba is $363
- Saskatchewan is $426
- Alberta is $495
- North is $413
- National is $352
NIHB dental utilization rates by region
Utilization rates reflect the number of clients who, during the fiscal year, received at least one dental service paid through the HICPS system as a proportion of the total number of eligible clients.
In 2022 to 2023, the national utilization rate for dental benefits paid through the HICPS system was 35%. National NIHB dental utilization rates in 2020 to 2021 were impacted by provincial/territorial public health restrictions on the provision of in-person services due to the coronavirus (COVID-19) outbreak.
Dental utilization rates vary across the regions with the highest dental utilization rates found in Alberta and Quebec at 41% and 39% respectively. The lowest dental utilization rate was in Yukon (31%). Please note that the dental utilization rates understate the actual level of access, as these data do not include contract dental services provided in some regions or dental services provided through contribution agreements. For example, HICPS data does not capture any services utilized by the Bigstone Cree Nation. If this client population was removed from the Alberta Region's population, the utilization rate for dental benefits for Alberta would have been 44% in 2022 to 2023. The same scenario would apply for the Ontario Region. If the Akwesasne client population in Ontario were to be removed, the utilization rate for dental benefits in Ontario would have been 34%. The utilization rate also does not reflect services received through Indigenous Services Canada programs such as Community Oral Health Services which include dental therapy services and the Children's Oral Health Initiative (COHI).
Over the two year period between 2021 to 2022 and 2022 to 2023, 442,128 distinct clients received NIHB dental services through HICPS, resulting in an overall 47% utilization rate over this period.
| Region | Dental utilization | NIHB dental utilization last two years 2021 to 2023 |
||||
|---|---|---|---|---|---|---|
| 2018 to 2019 | 2019 to 2020 | 2020 to 2021 | 2021 to 2022 | 2022 to 2023 | ||
| Atlantic | 37% | 36% | 30% | 35% | 35% | 46% |
| Quebec | 43% | 42% | 34% | 38% | 39% | 50% |
| Ontario | 32% | 32% | 26% | 30% | 32% | 41% |
| Manitoba | 39% | 37% | 27% | 32% | 33% | 46% |
| Saskatchewan | 39% | 38% | 32% | 37% | 38% | 53% |
| Alberta | 42% | 42% | 36% | 40% | 41% | 55% |
| Yukon | 37% | 35% | 29% | 32% | 31% | 45% |
| N.W.T. | 41% | 39% | 32% | 36% | 38% | 64% |
| Nunavut | 40% | 38% | 27% | 32% | 33% | 39% |
| National | 37% | 37% | 30% | 34% | 35% | 47% |
| Source: HICPS and SVS adapted by Program Analytics and Risk Mitigation | ||||||
NIHB dental claimants by age group, gender and region: 2022 to 2023
Of the 936,006 clients eligible to receive dental benefits through the NIHB program, 330,494 claimants (35%) received at least one dental procedure paid through the HICPS system in 2022 to 2023.
Of this total, 186,231 were female (56%) and 144,263 were male (44%), compared to the total eligible NIHB population where 51% were female and 49% were male.
The average age of dental claimants was 33 years, indicating clients tend to access dental services at a slightly younger age compared to pharmacy services (37 years of age). The average age for female and male claimants was 34 and 32 years of age respectively.
Approximately 33% of all dental claimants were under 20 years of age. 36% of male claimants were in this age group compared to 30% of female claimants. Approximately 8% of all claimants were seniors aged 65 and over in 2022 to 2023.
Table 6.4: NIHB dental claimants by age group, gender and region
Source: HICPS adapted by Program Analytics and Risk Mitigation
| Age group | Total | ||||||||||||||
|---|---|---|---|---|---|---|---|---|---|---|---|---|---|---|---|
| 0-4 | 5-9 | 10-14 | 15-19 | 20-24 | 25-29 | 30-34 | 35-39 | 40-44 | 45-49 | 50-54 | 55-59 | 60-64 | 65+ | ||
| Male | 108 | 498 | 804 | 1,104 | 873 | 869 | 880 | 722 | 689 | 702 | 781 | 765 | 684 | 1,294 | 10,773 |
| Female | 97 | 560 | 826 | 1,153 | 1,066 | 1,255 | 1,157 | 997 | 963 | 907 | 1,056 | 1,069 | 986 | 1,812 | 13,904 |
| Total | 205 | 1,058 | 1,630 | 2,257 | 1,939 | 2,124 | 2,037 | 1,719 | 1,652 | 1,609 | 1,837 | 1,834 | 1,670 | 3,106 | 24,677 |
| Average age: 40 (Male: 39, Female: 41) | |||||||||||||||
| Age group | Total | ||||||||||||||
|---|---|---|---|---|---|---|---|---|---|---|---|---|---|---|---|
| 0-4 | 5-9 | 10-14 | 15-19 | 20-24 | 25-29 | 30-34 | 35-39 | 40-44 | 45-49 | 50-54 | 55-59 | 60-64 | 65+ | ||
| Male | 195 | 1,201 | 1,515 | 1,282 | 936 | 1,098 | 1,061 | 873 | 915 | 829 | 900 | 950 | 865 | 1,557 | 14,177 |
| Female | 207 | 1,151 | 1,534 | 1,378 | 1,267 | 1,554 | 1,429 | 1,302 | 1,144 | 1,150 | 1,169 | 1,282 | 1,164 | 2,246 | 17,977 |
| Total | 402 | 2,352 | 3,049 | 2,660 | 2,203 | 2,652 | 2,490 | 2,175 | 2,059 | 1,979 | 2,069 | 2,232 | 2,029 | 3,803 | 32,154 |
| Average age: 38 (Male: 36, Female: 39) | |||||||||||||||
| Age group | Total | ||||||||||||||
|---|---|---|---|---|---|---|---|---|---|---|---|---|---|---|---|
| 0-4 | 5-9 | 10-14 | 15-19 | 20-24 | 25-29 | 30-34 | 35-39 | 40-44 | 45-49 | 50-54 | 55-59 | 60-64 | 65+ | ||
| Male | 702 | 2,770 | 3,281 | 3,178 | 2,439 | 2,588 | 2,379 | 1,951 | 1,747 | 1,725 | 1,813 | 1,868 | 1,785 | 3,154 | 31,380 |
| Female | 682 | 2,762 | 3,492 | 3,290 | 3,127 | 3,500 | 3,278 | 2,716 | 2,630 | 2,350 | 2,578 | 2,687 | 2,683 | 5,196 | 40,971 |
| Total | 1,384 | 5,532 | 6,773 | 6,468 | 5,566 | 6,088 | 5,657 | 4,667 | 4,377 | 4,075 | 4,391 | 4,555 | 4,468 | 8,350 | 72,351 |
| Average age: 37 (Male: 35, Female: 38) | |||||||||||||||
| Age group | Total | ||||||||||||||
|---|---|---|---|---|---|---|---|---|---|---|---|---|---|---|---|
| 0-4 | 5-9 | 10-14 | 15-19 | 20-24 | 25-29 | 30-34 | 35-39 | 40-44 | 45-49 | 50-54 | 55-59 | 60-64 | 65+ | ||
| Male | 774 | 2,747 | 2,995 | 2,887 | 1,999 | 2,121 | 1,938 | 1,520 | 1,364 | 1,306 | 1,251 | 1,157 | 901 | 1,221 | 24,181 |
| Female | 721 | 2,787 | 3,318 | 3,390 | 2,736 | 2,820 | 2,796 | 2,190 | 1,786 | 1,728 | 1,751 | 1,544 | 1,282 | 1,842 | 30,691 |
| Total | 1,495 | 5,534 | 6,313 | 6,277 | 4,735 | 4,941 | 4,734 | 3,710 | 3,150 | 3,034 | 3,002 | 2,701 | 2,183 | 3,063 | 54,872 |
| Average age: 31 (Male: 30, Female: 32) | |||||||||||||||
| Age group | Total | ||||||||||||||
|---|---|---|---|---|---|---|---|---|---|---|---|---|---|---|---|
| 0-4 | 5-9 | 10-14 | 15-19 | 20-24 | 25-29 | 30-34 | 35-39 | 40-44 | 45-49 | 50-54 | 55-59 | 60-64 | 65+ | ||
| Male | 1,118 | 3,136 | 3,752 | 3,200 | 2,316 | 2,207 | 2,317 | 1,869 | 1,583 | 1,395 | 1,427 | 1,221 | 941 | 1,155 | 27,637 |
| Female | 1,154 | 3,379 | 3,945 | 3,918 | 3,209 | 3,461 | 3,271 | 2,636 | 2,105 | 1,937 | 1,956 | 1,760 | 1,305 | 1,793 | 35,829 |
| Total | 2,272 | 6,515 | 7,697 | 7,118 | 5,525 | 5,668 | 5,588 | 4,505 | 3,688 | 3,332 | 3,383 | 2,981 | 2,246 | 2,948 | 63,466 |
| Average age: 30 (Male: 29, Female: 31) | |||||||||||||||
| Age group | Total | ||||||||||||||
|---|---|---|---|---|---|---|---|---|---|---|---|---|---|---|---|
| 0-4 | 5-9 | 10-14 | 15-19 | 20-24 | 25-29 | 30-34 | 35-39 | 40-44 | 45-49 | 50-54 | 55-59 | 60-64 | 65+ | ||
| Male | 972 | 3,065 | 3,623 | 2,934 | 1,979 | 1,868 | 1,731 | 1,524 | 1,267 | 1,124 | 1,061 | 1,001 | 751 | 953 | 23,853 |
| Female | 1,016 | 3,154 | 3,767 | 3,421 | 2,499 | 2,600 | 2,499 | 2,109 | 1,839 | 1,596 | 1,468 | 1,406 | 1,142 | 1,695 | 30,211 |
| Total | 1,988 | 6,219 | 7,390 | 6,355 | 4,478 | 4,468 | 4,230 | 3,633 | 3,106 | 2,720 | 2,529 | 2,407 | 1,893 | 2,648 | 54,064 |
| Average age: 30 (Male: 28, Female: 31) | |||||||||||||||
| Age group | Total | ||||||||||||||
|---|---|---|---|---|---|---|---|---|---|---|---|---|---|---|---|
| 0-4 | 5-9 | 10-14 | 15-19 | 20-24 | 25-29 | 30-34 | 35-39 | 40-44 | 45-49 | 50-54 | 55-59 | 60-64 | 65+ | ||
| Male | 663 | 1,109 | 1,206 | 1,100 | 962 | 939 | 882 | 731 | 596 | 546 | 576 | 521 | 385 | 601 | 10,817 |
| Female | 609 | 1,213 | 1,403 | 1,493 | 1,359 | 1,401 | 1,359 | 1,132 | 870 | 740 | 792 | 702 | 600 | 938 | 14,611 |
| Total | 1,272 | 2,322 | 2,609 | 2,593 | 2,321 | 2,340 | 2,241 | 1,863 | 1,466 | 1,286 | 1,368 | 1,223 | 985 | 1,539 | 25,428 |
| Average age: 31 (Male: 30, Female: 32) | |||||||||||||||
| Age group | Total | ||||||||||||||
|---|---|---|---|---|---|---|---|---|---|---|---|---|---|---|---|
| 0-4 | 5-9 | 10-14 | 15-19 | 20-24 | 25-29 | 30-34 | 35-39 | 40-44 | 45-49 | 50-54 | 55-59 | 60-64 | 65+ | ||
| Male | 4,553 | 14,637 | 17,324 | 15,814 | 11,622 | 11,822 | 11,312 | 9,313 | 8,265 | 7,723 | 7,907 | 7,578 | 6,378 | 10,015 | 144,263 |
| Female | 4,505 | 15,143 | 18,442 | 18,211 | 15,442 | 16,767 | 15,975 | 13,245 | 11,504 | 10,532 | 10,930 | 10,597 | 9,257 | 15,681 | 186,231 |
| Total | 9,058 | 29,780 | 35,766 | 34,025 | 27,064 | 28,589 | 27,287 | 22,558 | 19,769 | 18,255 | 18,837 | 18,175 | 15,635 | 25,696 | 330,494 |
| Average age: 33 (Male: 32, Female: 34) | |||||||||||||||
| Region | Total | |||||||
|---|---|---|---|---|---|---|---|---|
| Atlantic | Quebec | Ontario | Manitoba | Saskatchewan | Alberta | North | ||
| Male | 39 | 36 | 35 | 30 | 29 | 28 | 30 | 32 |
| Female | 41 | 39 | 38 | 32 | 31 | 31 | 32 | 34 |
| Total | 40 | 38 | 37 | 31 | 30 | 30 | 31 | 33 |
NIHB fee-for-service dental expenditures by service category: 2022 to 2023
In 2022 to 2023, expenditures for restorative services (crowns, fillings, etc.) were the highest of all dental service categories at $131.1 million. Diagnostic services (examinations, radiographs, etc.) at $35.8 million and preventive services (scaling, sealants, etc.) at $33.0 million were the next highest service categories. Rounding out the top 5 were oral surgery (extractions, etc.) at $32.0 million and endodontic services (root canal treatments, etc.) at $21.6 million.
| Dental Sub-Benefit | 2021 to 2022 | 2022 to 2023 | % Change from 2021 to 2022 |
|---|---|---|---|
| Restorative Services | $124.4 | $131.1 | 5.4% |
| Diagnostic Services | $32.8 | $35.8 | 9.2% |
| Preventive Services | $30.5 | $33.0 | 8.4% |
| Oral Surgery Services | $28.5 | $32.0 | 12.1% |
| Endodontic Services | $20.4 | $21.6 | 6.0% |
| Source: HICPS adapted by Program Analytics and Risk Mitigation | |||
In 2022 to 2023, the three highest dental procedures by expenditure were composite restorations ($111.2 million), scaling ($24.9 million) and extractions ($22.6 million).
| Dental Procedure | 2021 to 2022 | 2022 to 2023 | % Change from 2021 to 2022 |
|---|---|---|---|
| Composite Restorations | $106.3 | $111.2 | 4.6% |
| Scaling | $22.8 | $24.9 | 9.4% |
| Extractions | $20.2 | $22.6 | 12.1% |
| Root Canal Therapy | $18.5 | $19.7 | 6.4% |
| Intraoral Radiographs | $12.3 | $13.4 | 9.2% |
| Source: HICPS adapted by Program Analytics and Risk Mitigation | |||
Distribution of eligible NIHB population, dental expenditures and incidence by age group: 2022 to 2023
The ratio of incidence to expenditures is relatively consistent across most age groupings; however, there are notable exceptions. For children aged 5 to 14, a larger number of low-cost procedures, such as fillings, are provided, so this group accounts for 21.7% of claims, but only 16.5% of expenditures.
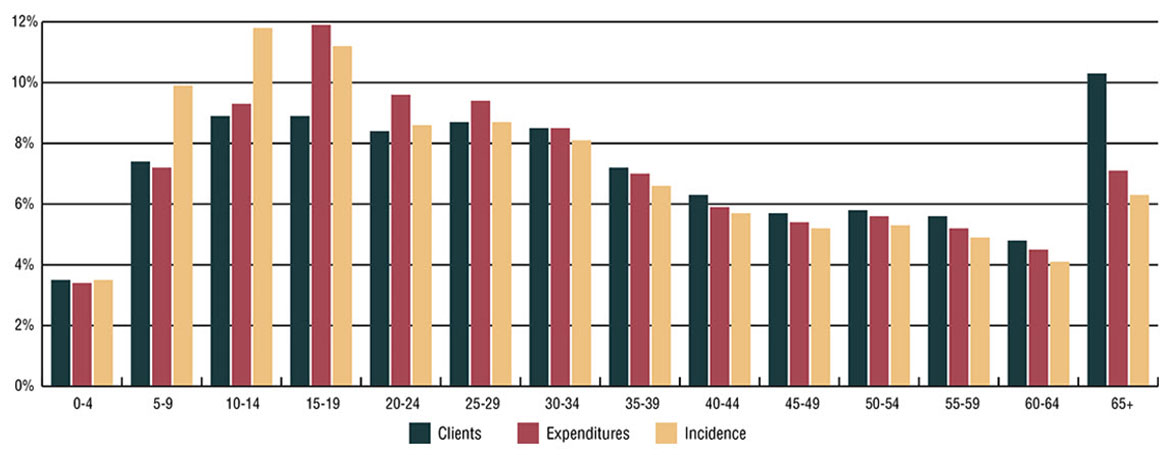
Source: HICPS and SVS adapted by Program Analytics and Risk Mitigation
Text alternative for Figure 6.4: Distribution of eligible NIHB population, dental expenditures and incidence by age group
This image visually describes distribution percentage of NIHB dental clients, incidence and expenditures by age group, as follows:
| Age | Eligible Clients | Expenditures | Incidence |
|---|---|---|---|
| 0-4 | 3.5% | 3.4% | 3.5% |
| 5-9 | 7.4% | 7.2% | 9.9% |
| 10-14 | 8.9% | 9.3% | 11.8% |
| 15-19 | 8.9% | 11.9% | 11.2% |
| 20-24 | 8.4% | 9.6% | 8.6% |
| 25-29 | 8.7% | 9.4% | 8.7% |
| 30-34 | 8.5% | 8.5% | 8.1% |
| 35-39 | 7.2% | 7.0% | 6.6% |
| 40-44 | 6.3% | 5.9% | 5.7% |
| 45-49 | 5.7% | 5.4% | 5.2% |
| 50-54 | 5.8% | 5.6% | 5.3% |
| 55-59 | 5.6% | 5.2% | 4.9% |
| 60-64 | 4.8% | 4.5% | 4.1% |
| 65+ | 10.3% | 7.1% | 6.3% |
| Total | 100.0% | 100.0% | 100.0% |
Section 7: NIHB Medical transportation expenditure and utilization data
In 2022 to 2023, Non-Insured Health Benefits Medical Transportation expenditures were $710.6 million or 37.6% of total NIHB expenditures. The medical transportation benefit is the largest program expenditure.
NIHB medical transportation benefits are intended to assist eligible clients to access medically necessary health services that are not available on reserve or in their community of residence.
Medical transportation benefits are managed by Indigenous Services Canada regional offices, or by First Nations or Inuit Health Authorities, organizations or territorial governments who manage the benefit through contribution agreements.
Medical transportation benefits include:
- ground travel (private vehicle, commercial taxi, fee-for-service driver and vehicle, band vehicle, bus, train, snowmobile taxi, and ground ambulance)
- air travel (scheduled flights; chartered flights; helicopter; and air ambulance)
- water travel (motorized boat; boat taxi; and ferry)
- living expenses (meals and accommodations)
- transportation costs for health professionals to provide services to isolated communities
Medical transportation benefits may be provided for clients to access the following types of medically required health services:
- medical services insured by provincial/territorial health plans (e.g., appointments with physician, diagnostic tests, hospital care)
- publicly funded alcohol, solvent, drug abuse and detox treatments
- traditional healers
- eligible benefits and services covered by the NIHB program
Medical transportation benefits may also be provided for a medical escort, such as a nurse, or a non-medical escort, such as family member or caregiver, to travel with a client who needs assistance. As of 2017, NIHB provides coverage for a non-medical escort for all pregnant clients who require transportation outside their community to deliver their babies.
In addition to client travel, medical transportation expenditures also include costs associated with transporting health care professionals to under-serviced and/or remote and isolated communities to facilitate access to medically necessary services.
Distribution of NIHB medical transportation expenditures ($ Millions): 2022 to 2023
In 2022 to 2023, NIHB medical transportation expenditures totalled $710.6 million.
Contribution agreements for the management of medical transportation benefits by First Nations communities, territorial governments and other organizations represented the largest component, accounting for $316.5 million, or 44.5% of total benefit expenditures.
Of benefit expenditures managed by the NIHB program, living expenses at $98.2 million (13.8%), scheduled flights at $97.4 million (13.7%) and air ambulance at $92.8 million (13.1%) were the largest expenditures, accounting for a combined total of over 40%.
Rounding out medical transportation expenditures are costs for land ambulance at $61.4 million (8.6%), land and water transportation at $33.6 million (4.7%) and chartered flights at $10.7 million (1.5%).
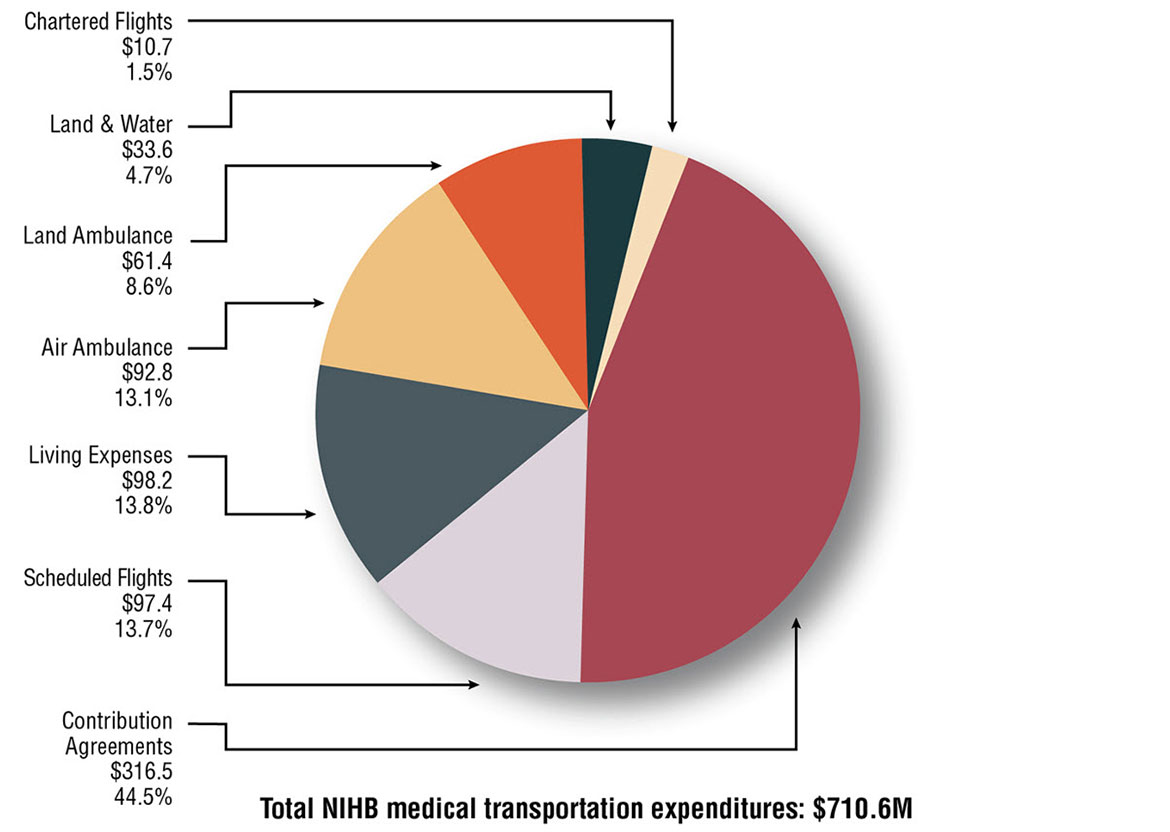
Source: FST adapted by Program Analytics and Risk Mitigation
Text alternative for Figure 7.1: Distribution of NIHB medical transportation expenditures ($ Millions)
This image is a pie chart which visually describes NIHB medical transportation expenditures and percentage by type, as follows: Expenditures for scheduled flights are $97.4 million and 13.7%, living expenses are $98.2 million and 13.8%, air ambulances are $92.8 million and 13.1%, land ambulances are $61.4 million and 8.6%, land and water transportation are $33.6 million and 4.7%, chartered flights are $10.7 million and 1.5% and contribution agreements are $316.5 million and 44.5% for a total of $710.6 million.
Annual NIHB medical transportation expenditures
NIHB medical transportation expenditures increased by 18.0% in 2022 to 2023 compared to the previous year. The coronavirus (COVID-19) outbreak and provincial/territorial public health restrictions on the provision of in-person services in fiscal year 2020 to 2021, along with larger than typical utilization of the medical transportation benefit in fiscal 2021 to 2022 once restrictions were ended, impacted growth in those two years. Over the past five years, overall medical transportation costs have grown by 43.5% from $495.0 million in 2018 to 2019 to $710.6 million in 2022 to 2023.
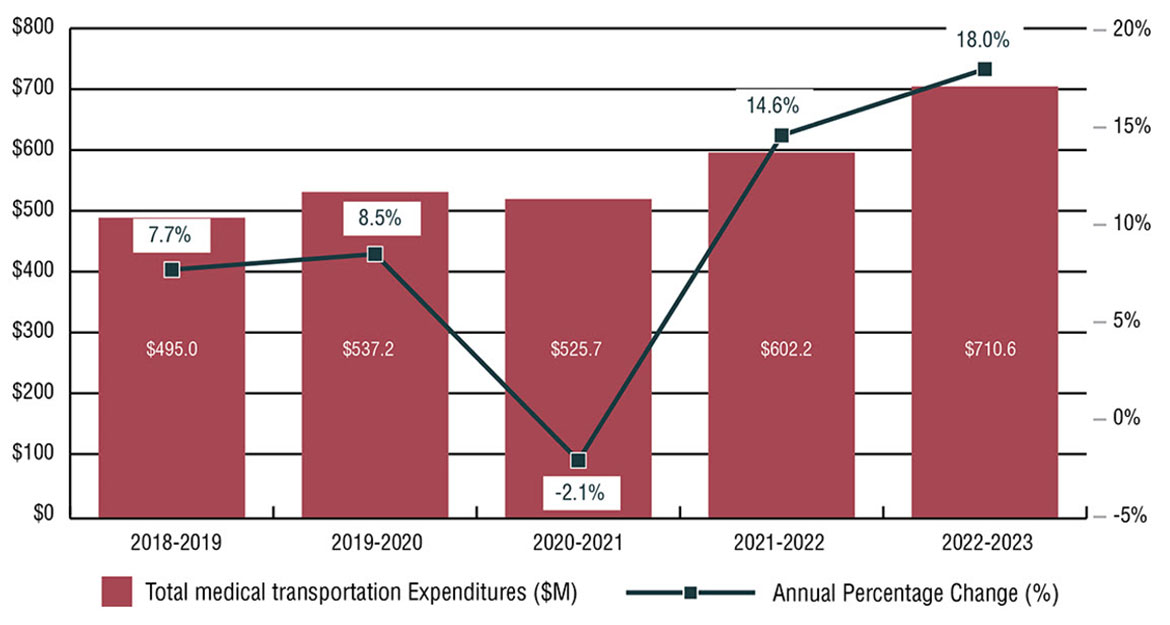
Source: FST adapted by Program Analytics and Risk Mitigation
Text alternative for Figure 7.2: Annual NIHB medical transportation expenditures
This image is a bar graph which visually describes NIHB medical transportation expenditures and percentage growth by year, as follows:
- 2018 to 2019 expenditures are $495.0 and percentage change 7.7%
- 2019 to 2020 are $537.2 and 8.5%
- 2020 to 2021 are $525.7 and -2.1%
- 2021 to 2022 are $602.2 and 14.6%
- 2021 to 2022 are $710.6 and 18.0%
On a regional basis, the highest 5 year growth rate was in Saskatchewan where expenditures grew by 52.5% from $75.3 million in 2018 to 2019 to $114.9 million in 2022 to 2023. This was followed by Manitoba with an increase of 48.5% from $157.0 million in 2018 to 2019 to $233.1 million in 2022 to 2023.
Manitoba had the highest total medical transportation expenditures at $233.1 million in 2022 to 2023, followed by Ontario at $140.3 million and Saskatchewan at $114.9 million.
| Region | 2018 to 2019 | 2019 to 2020 | 2020 to 2021 | 2021 to 2022 | 2022 to 2023 |
|---|---|---|---|---|---|
| Atlantic | $11,820 | $13,910 | $13,263 | $15,776 | $17,512 |
| Quebec | $24,642 | $25,729 | $25,379 | $26,775 | $28,921 |
| Ontario | $98,605 | $106,638 | $90,646 | $114,814 | $140,343 |
| Manitoba | $156,961 | $168,686 | $155,790 | $184,200 | $233,140 |
| Saskatchewan | $75,330 | $83,947 | $84,951 | $103,152 | $114,863 |
| Alberta | $56,870 | $61,669 | $59,492 | $67,206 | $71,908 |
| North | $70,806 | $76,601 | $96,194 | $90,286 | $103,926 |
| Total | $495,034 | $537,179 | $525,715 | $602,208 | $710,614 |
| Source: FST and FIRMS adapted by Program Analytics and Risk Mitigation | |||||
NIHB medical transportation expenditures by type and region (thousands of dollars): 2022 to 2023
In 2022 to 2023 Manitoba had the highest overall NIHB medical transportation expenditures at $233.1 million, primarily as a result of air transportation, which totalled $131.5 million. High medical transportation costs in the region reflect in part the large number of First Nations clients living in remote or fly-in only northern communities.
Ontario had the second highest medical transportation expenditures total in 2022 to 2023 at $140.3 million. Saskatchewan and the Northern region followed at $114.8 million and $103.9 million, respectively.
| Type | Atlantic | Quebec | Ontario | Manitoba | Saskatchewan | Alberta | North | Total |
|---|---|---|---|---|---|---|---|---|
| Scheduled Flights | $3,383 | $194 | $35,466 | $47,640 | $7,760 | $1,125 | $1,829 | $97,396 |
| Air Ambulance | $56 | $25 | $31 | $78,020 | $9,157 | $3,310 | $2,201 | $92,799 |
| Chartered Flights | $3 | $1 | $511 | $5,825 | $1,543 | $2,814 | $0 | $10,698 |
| Land Ambulance | $439 | $223 | $1,156 | $11,527 | $34,469 | $13,572 | $4 | $61,390 |
| Land & Water | $1,168 | $145 | $5,282 | $3,955 | $19,347 | $2,712 | $1,004 | $33,614 |
| Living Expenses | $2,111 | $63 | $37,675 | $36,855 | $11,542 | $7,290 | $2,703 | $98,237 |
| Total Operating | $7,161 | $651 | $80,121 | $183,822 | $83,818 | $30,824 | $7,740 | $394,135 |
| Total Contributions | $10,352 | $28,271 | $60,223 | $49,318 | $31,046 | $41,085 | $96,185 | $316,479 |
| Total | $17,512 | $28,921 | $140,343 | $233,140 | $114,863 | $71,908 | $103,926 | $710,614 |
| % Change from 2021-2022 | 11.0% | 8.0% | 22.2% | 26.6% | 11.4% | 7.0% | 15.1% | 18.0% |
| Source: FST and FIRMS adapted by Program Analytics and Risk Mitigation | ||||||||
Per capita NIHB medical transportation expenditures by region: 2022 to 2023
Expenditures per capita are total NIHB medical transportation expenditures divided by the number of eligible clients, regardless of whether clients submitted a claim in the reporting period.
In 2022 to 2023, the national per capita expenditure for NIHB medical transportation benefits was $759, an increase of 15.5% from the $658 recorded in 2021 to 2022.
The Northern region had the highest per capita expenditure in medical transportation at $1,414, followed by Manitoba at $1,406. These expenditures reflect the large number of First Nations and Inuit clients living in remote or fly-in communities that need to urban centres to access health services.
In contrast, the Atlantic region had the lowest per capita expenditure at $252. Compared to other regions, this lower per capita cost is reflective of the geography of the region, which allows easier access to health services with less need for air travel.
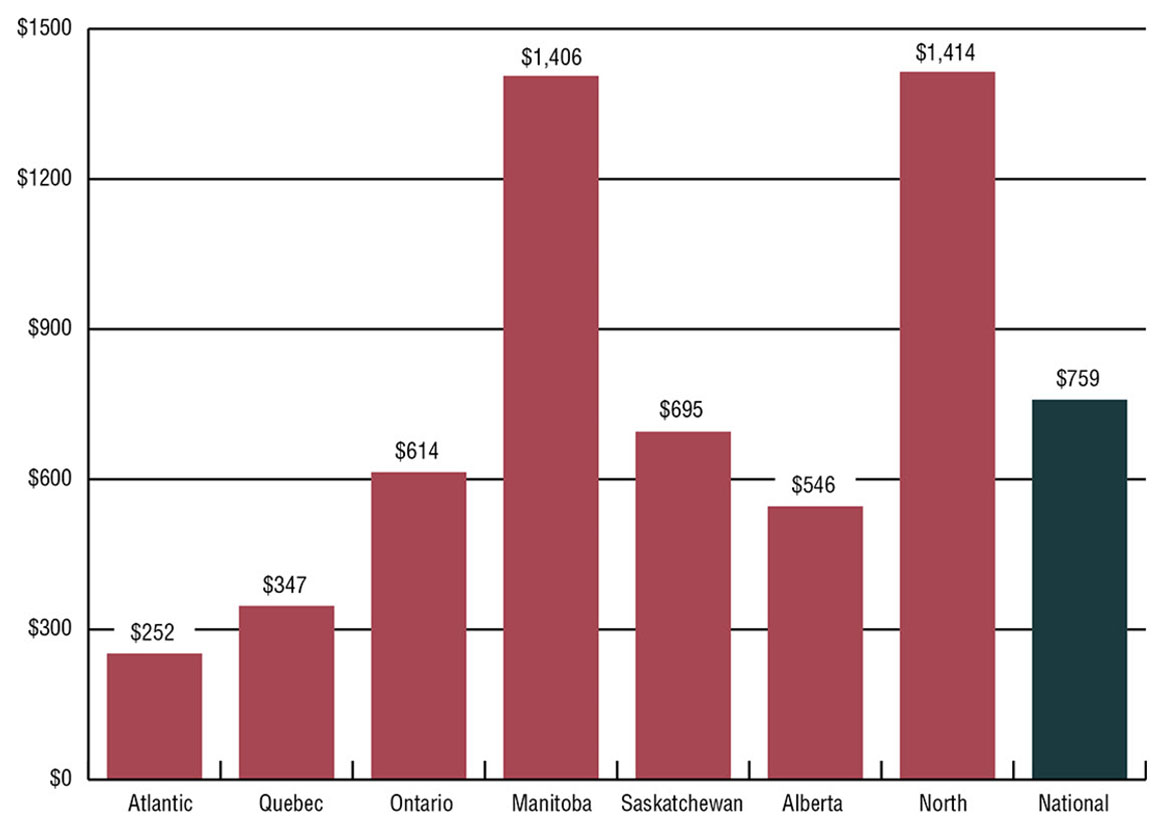
Source: SVS and FST adapted by Program Analytics and Risk Mitigation
Text alternative for Figure 7.3: Per capita NIHB medical transportation expenditures by region
This bar graph visually describes NIHB per capita medical transportation expenditures by region, as follows:
- Atlantic at $252
- Quebec at $347
- Ontario at $614
- Manitoba at $1,406
- Saskatchewan at $695
- Alberta at $546
- North at $1,414
- National at $759
Section 8: NIHB vision care benefits and utilization data
The NIHB program provides coverage for vision care benefits as set out in the NIHB Guide to Vision Care Benefits, including:
- eye examinations when they are not insured by the province or territory
- corrective eyewear (glasses, contact lenses) when prescribed by a vision care professional
- eyeglass repairs
Some items such as ocular prosthesis and low vision aids are covered by NIHB as medical supplies and equipment benefits.
In 2022 to 2023, a total of 160,904 First Nations and Inuit clients accessed vision care benefits through the NIHB program, based on claims paid through the HICPS system. The total expenditure for vision care benefits was $49.5 million or 2.6% of total NIHB expenditures.
Distribution of NIHB vision care expenditures ($ millions): 2022 to 2023
NIHB vision care expenditures are comprised of several distinct components. Fee-for-service vision care costs paid through HICPS system represented the largest expenditure portion, accounting for $44.9 million or 90.7% of all NIHB vision care costs.
The next highest component was contribution agreements, which accounted for $4.3 million or 8.8% of total vision care costs. Contribution agreements are used to fund First Nations or Inuit communities and organizations and/or Territorial Governments directly for the provision of vision care benefits.
HICPS contract costs related to claims processing through the HICPS system totalled $238 thousand or 0.5% in 2022 to 2023.
Regional vision care, at $49,600 or 0.1% of vision care benefit costs, refers to vision care claims paid through Indigenous Services Canada regional offices.
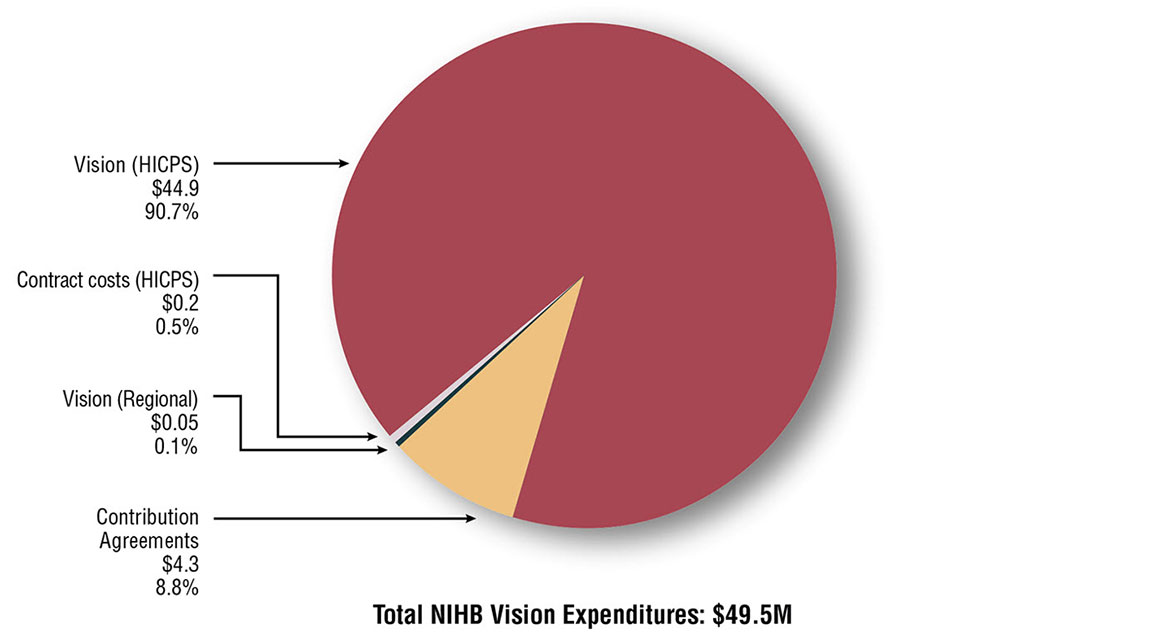
Source: FST adapted by Program Analytics and Risk Mitigation
Text alternative for Figure 8.1: Distribution of NIHB vision care expenditures ($ Millions)
This image is a pie chart which visually describes NIHB vision care expenditures and proportion of total expenditure by component type as follows: vision care (HICPS) at $44.9 million and 90.7%, vision care (regional) at $50 thousand and 0.1%, HICPS contract costs at $238 thousand and 0.5%, and contribution agreements at $4.3 million and 8.8%
NIHB vision care expenditures and growth by region (thousands of dollars): 2022 to 2023
NIHB vision care expenditures totalled $49.5 million in 2022 to 2023, an increase of 3.5% from the previous year.
Saskatchewan had the highest vision care costs at $10.6 million, or 22.1% of total vision care expenditure, followed by Alberta at $9.4 million (19.7%) and Ontario at $8.1 million (17.0%). Headquarters expenditures are costs related to claims processing through the HICPS system.
| Region | Operating | Total Operating Costs | Total Contribution Costs | Total Costs | ||
|---|---|---|---|---|---|---|
| Fee for Service | Regional | HICPS Contract Costs | ||||
| Atlantic | $4,140 | $8.7 | $0.0 | $4,149 | $0 | $4,149 |
| Quebec | $4,081 | $0.0 | $0.0 | $4,081 | $0 | $4,081 |
| Ontario | $8,009 | $0.0 | $0.0 | $8,009 | $624 | $8,633 |
| Manitoba | $7,151 | $0.0 | $0.0 | $7,151 | $518 | $7,669 |
| Saskatchewan | $10,585 | $0.0 | $0.0 | $10,585 | $0 | $10,585 |
| Alberta | $8,000 | $0.0 | $0.0 | $8,000 | $1,446 | $9,446 |
| North | $2,897 | $40.9 | $0.0 | $2,938 | $1,744 | $4,683 |
| Headquarters | $0 | $0.0 | $238.2 | $238 | $0 | $238 |
| Total | $44,864 | $49.6 | $238.2 | $45,152 | $4,332 | $49,484 |
| Source: FST adapted by Program Analytics and Risk Mitigation | ||||||
Annual NIHB vision care expenditures and percentage change
NIHB vision care expenditures increased by 3.5% during fiscal year 2022 to 2023. Over the past five years, growth in vision care expenditures has ranged from a high of 26.1% in 2019 to 2020 to a low of -13.9% in 2020 to 2021.
The five year annualized growth rate for NIHB vision care expenditures is 6.3%.
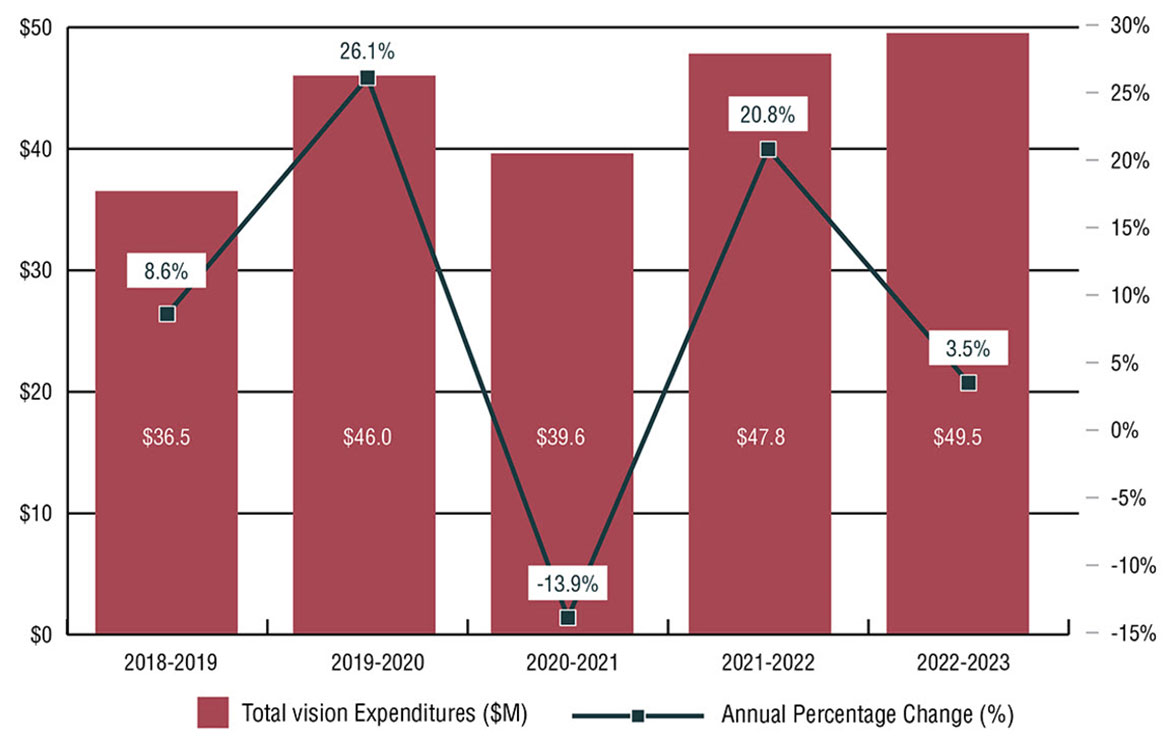
Source: FST adapted by Program Analytics and Risk Mitigation
Text alternative for Figure 8.2: Annual NIHB vision care expenditures
This image is a bar graph which visually describes NIHB vision care expenditures by year in millions and percentage change, as follows:
- 2018 to 2019 is $36.5 million and 8.6%
- 2019 to 2020 is $46.0 million and 26.1%
- 2020 to 2021 is $39.6 million and -13.9%
- 2021 to 2022 is $47.8 million and 20.8%
- 2022 to 2023 is $49.5 million and 3.5%
On a regional basis, the highest growth rate over this five year period was in Quebec where expenditures grew by 113.9% from $1.9 million in 2018 to 2019 to $4.1 million in 2022 to 2023. Manitoba had largest net increase in expenditures over this period, where costs grew by $3.0 million.
| Region | 2018 to 2019 | 2019 to 2020 | 2020 to 2021 | 2021 to 2022 | 2021 to 2022 |
|---|---|---|---|---|---|
| Atlantic | $3,885 | $4,150 | $3,436 | $4,158 | $4,149 |
| Quebec | $1,908 | $2,736 | $2,814 | $3,938 | $4,081 |
| Ontario | $6,744 | $7,860 | $7,346 | $8,113 | $8,633 |
| Manitoba | $4,699 | $6,935 | $6,042 | $7,334 | $7,669 |
| Saskatchewan | $7,822 | $9,844 | $8,493 | $10,581 | $10,585 |
| Alberta | $7,696 | $10,514 | $8,030 | $9,405 | $9,446 |
| North | $3,713 | $3,929 | $3,206 | $4,081 | $4,683 |
| Total | $36,467 | $45,968 | $39,594 | $47,819 | $49,484 |
| Source: FST adapted by Program Analytics and Risk Mitigation | |||||
Per capita NIHB vision care expenditures by region: 2022 to 2023
Expenditures per capita are total NIHB vision care expenditures divided by the number of eligible clients, regardless of whether clients submitted a claim in the reporting period.
In 2022 to 2023, the national per capita expenditure in NIHB vision care benefits was $53, an increase of 1.3% from the $52 recorded in 2021 to 2022.
Alberta had the highest per capita expenditure at $72, followed by Saskatchewan and the North at $64. The lowest per capita NIHB vision care benefit expenditure was in Ontario at $38.
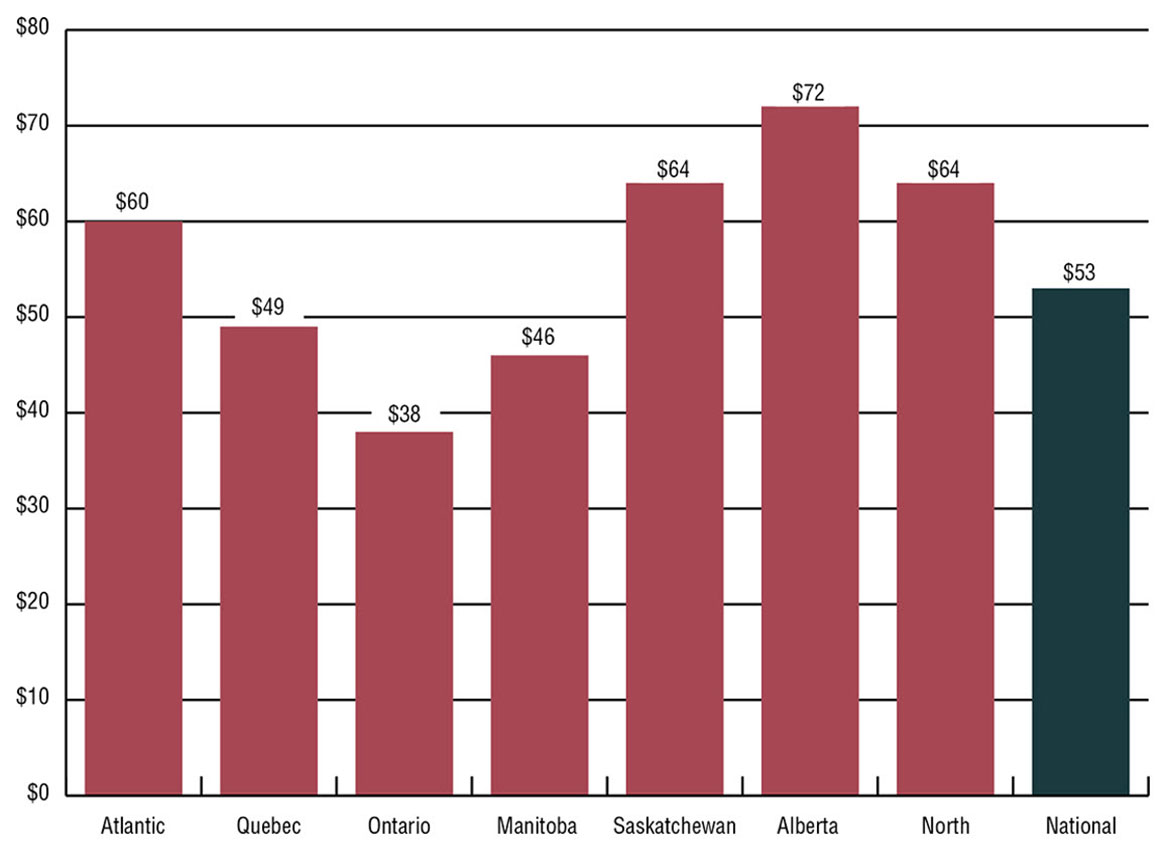
Source: SVS and FST adapted by Program Analytics and Risk Mitigation
Text alternative for Figure 8.3: Per capita NIHB vision care expenditures by region
This image visually describes NIHB per capita vision care expenditures by region, as follows:
- Atlantic $60
- Quebec $49
- Ontario $38
- Manitoba $46
- Saskatchewan $64
- Alberta $72
- North $64
- National $53
NIHB vision care claimants by age group, gender and region: 2022 to 2023
Of the 936,006 clients eligible to receive benefits under the NIHB program, a total of 160,904 claimants, representing 17.2% of the NIHB client population, had at least one vision care claim paid through the Health Information and Claims Processing Services (HICPS) system in 2022 to 2023. Of this total, 97,247 were female (60.4%) and 63,657 were male (39.6%). This compares to the total eligible population where 51% were female and 49% were male.
The average age of vision care claimants was 36 years. The average age for female and male claimants was 37 and 36 years of age, respectively.
Table 8.3: NIHB vision care claimants by age group, gender and region
Source: HICPS and SVS adapted by Program Analytics and Risk Mitigation
| Age group | Total | ||||||||||||||
|---|---|---|---|---|---|---|---|---|---|---|---|---|---|---|---|
| 0-4 | 5-9 | 10-14 | 15-19 | 20-24 | 25-29 | 30-34 | 35-39 | 40-44 | 45-49 | 50-54 | 55-59 | 60-64 | 65+ | ||
| Male | 88 | 451 | 662 | 557 | 392 | 379 | 404 | 314 | 302 | 413 | 481 | 466 | 431 | 903 | 6,243 |
| Female | 98 | 479 | 800 | 787 | 646 | 651 | 625 | 553 | 571 | 625 | 668 | 683 | 669 | 1,345 | 9,200 |
| Total | 186 | 930 | 1,462 | 1,344 | 1,038 | 1,030 | 1,029 | 867 | 873 | 1,038 | 1,149 | 1,149 | 1,100 | 2,248 | 15,443 |
| Average age: 40 (Male: 39, Female: 40) | |||||||||||||||
| Age group | Total | ||||||||||||||
|---|---|---|---|---|---|---|---|---|---|---|---|---|---|---|---|
| 0-4 | 5-9 | 10-14 | 15-19 | 20-24 | 25-29 | 30-34 | 35-39 | 40-44 | 45-49 | 50-54 | 55-59 | 60-64 | 65+ | ||
| Male | 24 | 295 | 455 | 423 | 345 | 364 | 328 | 313 | 336 | 376 | 389 | 412 | 370 | 663 | 5,093 |
| Female | 17 | 342 | 600 | 661 | 574 | 643 | 629 | 562 | 555 | 558 | 620 | 612 | 609 | 994 | 7,976 |
| Total | 41 | 637 | 1,055 | 1,084 | 919 | 1,007 | 957 | 875 | 891 | 934 | 1,009 | 1,024 | 979 | 1,657 | 13,069 |
| Average age: 40 (Male: 40, Female: 40) | |||||||||||||||
| Age group | Total | ||||||||||||||
|---|---|---|---|---|---|---|---|---|---|---|---|---|---|---|---|
| 0-4 | 5-9 | 10-14 | 15-19 | 20-24 | 25-29 | 30-34 | 35-39 | 40-44 | 45-49 | 50-54 | 55-59 | 60-64 | 65+ | ||
| Male | 46 | 640 | 1,122 | 1,188 | 919 | 859 | 869 | 653 | 656 | 851 | 907 | 920 | 845 | 1,567 | 12,042 |
| Female | 34 | 740 | 1,519 | 1,450 | 1,375 | 1,417 | 1,394 | 1,194 | 1,289 | 1,311 | 1,394 | 1,337 | 1,382 | 2,461 | 18,297 |
| Total | 80 | 1,380 | 2,641 | 2,638 | 2,294 | 2,276 | 2,263 | 1,847 | 1,945 | 2,162 | 2,301 | 2,257 | 2,227 | 4,028 | 30,339 |
| Average age: 40 (Male: 39, Female: 41) | |||||||||||||||
| Age group | Total | ||||||||||||||
|---|---|---|---|---|---|---|---|---|---|---|---|---|---|---|---|
| 0-4 | 5-9 | 10-14 | 15-19 | 20-24 | 25-29 | 30-34 | 35-39 | 40-44 | 45-49 | 50-54 | 55-59 | 60-64 | 65+ | ||
| Male | 35 | 699 | 1,413 | 1,226 | 784 | 748 | 733 | 602 | 515 | 606 | 577 | 577 | 516 | 757 | 9,788 |
| Female | 61 | 908 | 1,811 | 1,895 | 1,343 | 1,395 | 1,361 | 1,083 | 918 | 919 | 991 | 874 | 792 | 1,134 | 15,485 |
| Total | 96 | 1,607 | 3,224 | 3,121 | 2,127 | 2,143 | 2,094 | 1,685 | 1,433 | 1,525 | 1,568 | 1,451 | 1,308 | 1,891 | 25,273 |
| Average age: 34 (Male: 34, Female: 34) | |||||||||||||||
| Age group | Total | ||||||||||||||
|---|---|---|---|---|---|---|---|---|---|---|---|---|---|---|---|
| 0-4 | 5-9 | 10-14 | 15-19 | 20-24 | 25-29 | 30-34 | 35-39 | 40-44 | 45-49 | 50-54 | 55-59 | 60-64 | 65+ | ||
| Male | 120 | 1,294 | 2,055 | 2,046 | 1,348 | 1,294 | 1,318 | 1,015 | 909 | 959 | 945 | 830 | 690 | 1,045 | 15,868 |
| Female | 124 | 1,551 | 2,583 | 2,753 | 2,150 | 2,333 | 2,198 | 1,792 | 1,498 | 1,497 | 1,441 | 1,329 | 1,038 | 1,725 | 24,012 |
| Total | 244 | 2,845 | 4,638 | 4,799 | 3,498 | 3,627 | 3,516 | 2,807 | 2,407 | 2,456 | 2,386 | 2,159 | 1,728 | 2,770 | 39,880 |
| Average age: 34 (Male: 33, Female: 34) | |||||||||||||||
| Age group | Total | ||||||||||||||
|---|---|---|---|---|---|---|---|---|---|---|---|---|---|---|---|
| 0-4 | 5-9 | 10-14 | 15-19 | 20-24 | 25-29 | 30-34 | 35-39 | 40-44 | 45-49 | 50-54 | 55-59 | 60-64 | 65+ | ||
| Male | 57 | 792 | 1,360 | 1,237 | 964 | 894 | 893 | 749 | 674 | 615 | 579 | 545 | 452 | 603 | 10,414 |
| Female | 86 | 965 | 1,687 | 1,719 | 1,380 | 1,439 | 1,424 | 1,196 | 1,050 | 913 | 870 | 842 | 718 | 959 | 15,248 |
| Total | 143 | 1,757 | 3,047 | 2,956 | 2,344 | 2,333 | 2,317 | 1,945 | 1,724 | 1,528 | 1,449 | 1,387 | 1,170 | 1,562 | 25,662 |
| Average age: 33 (Male: 33, Female: 34) | |||||||||||||||
| Age group | Total | ||||||||||||||
|---|---|---|---|---|---|---|---|---|---|---|---|---|---|---|---|
| 0-4 | 5-9 | 10-14 | 15-19 | 20-24 | 25-29 | 30-34 | 35-39 | 40-44 | 45-49 | 50-54 | 55-59 | 60-64 | 65+ | ||
| Male | 14 | 159 | 310 | 348 | 260 | 284 | 243 | 199 | 225 | 223 | 327 | 313 | 312 | 475 | 3,692 |
| Female | 18 | 193 | 433 | 508 | 479 | 536 | 512 | 455 | 394 | 428 | 478 | 487 | 429 | 741 | 6,091 |
| Total | 32 | 352 | 743 | 856 | 739 | 820 | 755 | 654 | 619 | 651 | 805 | 800 | 741 | 1,216 | 9,783 |
| Average age: 40 (Male: 41, Female: 40) | |||||||||||||||
| Age group | Total | ||||||||||||||
|---|---|---|---|---|---|---|---|---|---|---|---|---|---|---|---|
| 0-4 | 5-9 | 10-14 | 15-19 | 20-24 | 25-29 | 30-34 | 35-39 | 40-44 | 45-49 | 50-54 | 55-59 | 60-64 | 65+ | ||
| Male | 386 | 4,353 | 7,407 | 7,069 | 5,049 | 4,861 | 4,837 | 3,887 | 3,668 | 4,080 | 4,241 | 4,110 | 3,645 | 6,064 | 63,657 |
| Female | 439 | 5,202 | 9,483 | 9,838 | 8,038 | 8,488 | 8,239 | 6,910 | 6,357 | 6,328 | 6,540 | 6,250 | 5,700 | 9,435 | 97,247 |
| Total | 825 | 9,555 | 16,890 | 16,907 | 13,087 | 13,349 | 13,076 | 10,797 | 10,025 | 10,408 | 10,781 | 10,360 | 9,345 | 15,499 | 160,904 |
| Average age: 36 (Male: 36, Female: 37) | |||||||||||||||
| Region | Total | |||||||
|---|---|---|---|---|---|---|---|---|
| Atlantic | Quebec | Ontario | Manitoba | Saskatchewan | Alberta | North | ||
| Male | 39 | 40 | 39 | 34 | 33 | 33 | 41 | 36 |
| Female | 40 | 40 | 41 | 34 | 34 | 34 | 40 | 37 |
| Total | 40 | 40 | 40 | 34 | 34 | 33 | 40 | 36 |
NIHB vision care expenditures by category: 2022 to 2023
In 2022 to 2023, new eyewear, such as eyeglasses, accounted for $38.1 million or 86.3% of all HICPS vision care expenditures. Eye exams were $5.4 million or 12.2%, followed by repairs at $321 thousand or 0.7%.
| Category | Claimants | Expenditures | % Change from previous year |
|---|---|---|---|
| New Eyewear | 139,021 | $38,071,603 | 2.7% |
| Eye Exams | 78,357 | $5,396,941 | -2.5% |
| Repairs | 3,780 | $320,533 | -11.4% |
| Early Replacement | 1,243 | $201,635 | 31.1% |
| Add ons | 6,856 | $87,045 | 6.8% |
| Other | 109 | $19,236 | -43.2% |
| Source: HICPS adapted by Program Analytics and Risk Mitigation | |||
Section 9: NIHB mental health counselling expenditure and utilization data
The NIHB program provides coverage for mental health benefits as set out in the NIHB Guide to Mental Health Counselling Services. The NIHB program's mental health counselling benefit is intended to provide coverage for professional mental health counselling to complement other mental wellness services that may be available to clients or in communities. Mental health counselling is eligible for coverage when it is provided by an NIHB recognized mental health professional such as a registered psychologist. The mental health counselling benefit is offered in a way that:
- recognizes NIHB mental health counselling benefit as a component of a mental wellness continuum that includes other Indigenous Services Canada, community-based and provincial or territorial mental health programming and services
- supports culturally competent mental health counselling
In 2022 to 2023, a total of 31,836 First Nations and Inuit clients accessed mental health counselling benefits through the NIHB program, based on claims paid through the HICPS system. The total expenditure for mental health counselling benefits was $98.9 million or 5.2% of total NIHB expenditures.
Distribution of NIHB mental health counselling expenditures ($ millions): 2022 to 2023
NIHB mental health counselling expenditures are comprised of several distinct components. Fee-for-service mental health counselling costs paid through HICPS system represented the largest expenditure portion, accounting for $55.2 million or 55.8% of all NIHB mental health counselling costs.
The next highest component was contribution agreements, which accounted for $27.6 million or 27.9% of total mental health counselling costs. Contribution agreements are used to fund First Nations or Inuit communities and organizations and/or Territorial Governments directly for the provision of mental health counselling benefits.
Regional mental health counselling, at $15.8 million or 15.9% of mental health counselling benefit costs, refers to mental health counselling claims paid through Indigenous Services Canada regional offices.
HICPS contract costs related to claims processing through the HICPS system totalled $270 thousand or 0.3% of mental health counselling benefit costs in 2022 to 2023.
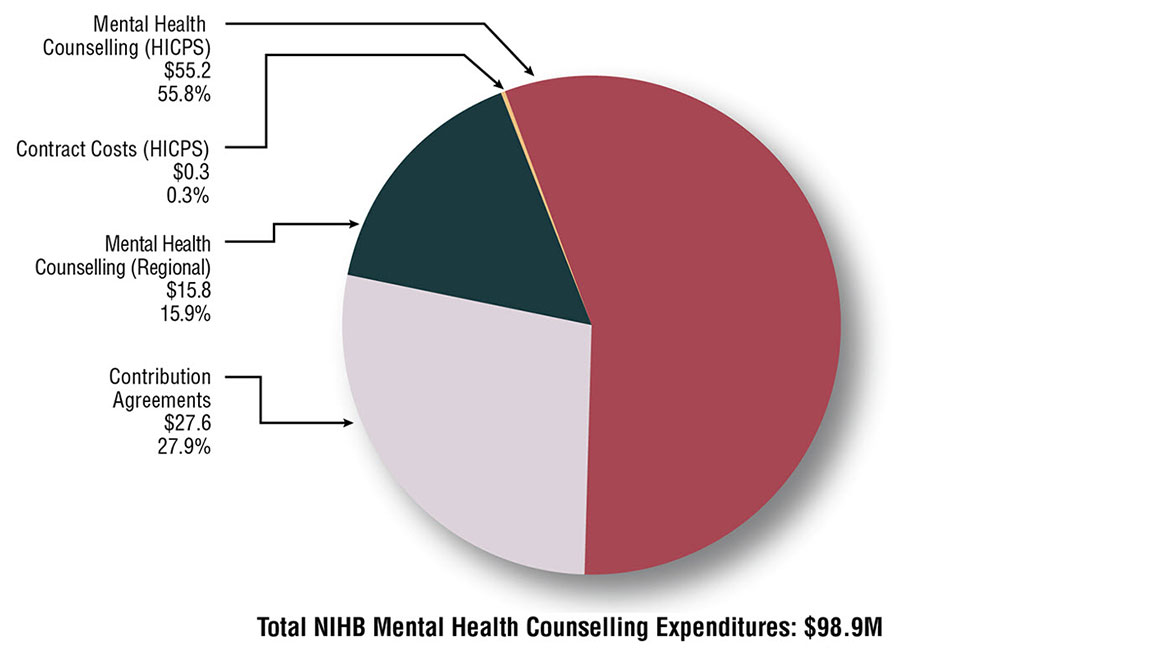
Source: FST adapted by Program Analytics and Risk Mitigation
Text alternative for Figure 9.1: Distribution of NIHB mental health counselling expenditures ($ Millions)
This image is a pie chart which visually describes NIHB mental health counselling expenditures in millions and proportion of total expenditures by component type as follows: mental health counselling (HICPS) at $55.2 and 55.8%, mental health counselling (regional) at $15.8 and 15.9%, contribution agreements at $27.6 and 27.9% and HICPS contract costs at $270 thousand and 0.3%.
NIHB mental health counselling expenditures by region (thousands of dollars): 2022 to 2023
NIHB mental health counselling expenditures totalled $98.6 million in 2022 to 2023, an increase of 5.2% from the previous year.
Saskatchewan had the highest mental health counselling costs at $25.2 million, or 25.5% of total mental health counselling expenditures, followed by Ontario at $24.5 million (24.8%) and Manitoba at $16.4 million (16.6%). Headquarters expenditures are costs related to claims processing through the HICPS system.
| Region | Operating | Total Operating Costs | Total Contribution Costs | Total Costs | ||
|---|---|---|---|---|---|---|
| Fee For Service | (Regional) | HICPS Contract Costs | ||||
| Atlantic | $3,729 | $24 | $0 | $3,753 | $3,165 | $6,918 |
| Quebec | $3,391 | $1,493 | $0 | $4,885 | $1,497 | $6,381 |
| Ontario | $22,960 | $0 | $0 | $22,960 | $1,531 | $24,491 |
| Manitoba | $5,108 | $6,149 | $0 | $11,256 | $5,136 | $16,393 |
| Saskatchewan | $11,444 | $4,177 | $0 | $15,621 | $9,573 | $25,194 |
| Alberta | $7,186 | $3,910 | $0 | $11,096 | $4,718 | $15,815 |
| North | $1,390 | $0 | $0 | $1,390 | $2,004 | $3,394 |
| Headquarters | $0 | $0 | $270 | $0 | $0 | $0 |
| Total | $55,208 | $15,753 | $270 | $71,231 | $27,624 | $98,855 |
| Source: FST adapted by Program Analytics and Risk Mitigation | ||||||
NIHB mental health counselling expenditures and annual percentage change
NIHB mental health counselling expenditures increased by 5.3% during fiscal year 2022 to 2023. Over the past five years, mental health counselling costs have grown by 131.8% from $42.7 million in 2018 to 2019 to $98.9 million in 2022 to 2023. Budget 2017 provided funding to expand the benefit by removing the requirement that counselling be provided in response to a crisis. Over the past five years, growth in mental health counselling expenditures has ranged from a high of 33.6% in 2020 to 2021 to a low of 5.3% in 2022 to 2023.
The five year annualized growth rate for NIHB mental health counselling expenditures is 18.3%.
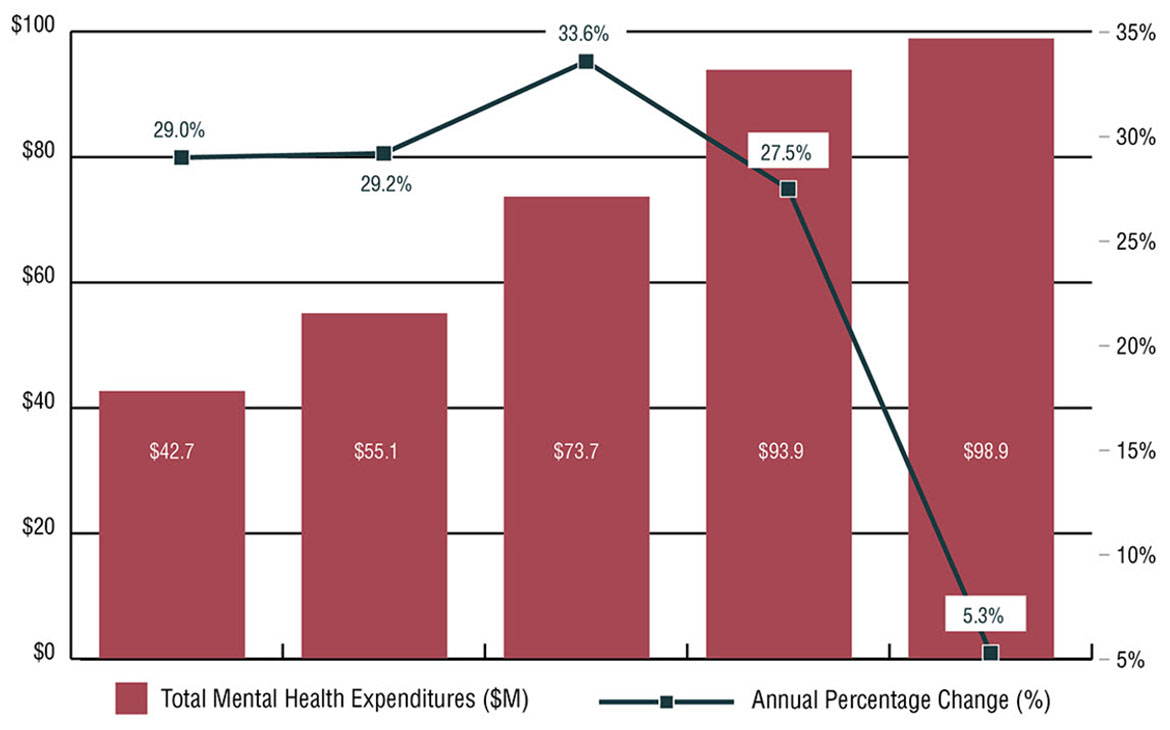
Source: FST adapted by Program Analytics and Risk Mitigation
Text alternative for Figure 9.2: NIHB mental health counselling expenditures and annual percentage change
This image visually describes NIHB mental health counselling expenditures and annual percentage change by year, as follows:
- 2018 to 2019 is $42.7 million and 29.0%
- 2019 to 2020 is $55.1 million and 29.2%
- 2020 to 2021 is $73.7 million and 33.6%
- 2021 to 2022 is $93.9 million and 27.5%
- 2022 to 2023 is $98.9 million and 5.3%
On a regional basis, the highest growth rates over this period were in the Atlantic region where expenditures grew by 258.1% from $1.9 million in 2018 to 2019 to $6.9 million in 2022 to 2023. This was followed by Saskatchewan with an increase of 220.2% from $7.9 million in 2018 to 2019 to $25.2 million in 2022 to 2023.
| Region | 2018 to 2019 | 2019 to 2020 | 2020 to 2021 | 2021 to 2022 | 2022 to 2023 |
|---|---|---|---|---|---|
| Atlantic | $1,932 | $3,428 | $6,037 | $7,001 | $6,918 |
| Quebec | $2,382 | $3,138 | $4,493 | $5,604 | $6,381 |
| Ontario | $9,053 | $12,116 | $15,491 | $21,762 | $24,491 |
| Manitoba | $9,705 | $11,475 | $13,803 | $16,333 | $16,393 |
| Saskatchewan | $7,867 | $11,783 | $16,770 | $24,881 | $25,194 |
| Alberta | $9,545 | $11,020 | $12,843 | $14,771 | $15,815 |
| North | $2,172 | $2,167 | $3,895 | $3,333 | $3,394 |
| Total | $42,656 | $55,126 | $73,652 | $93,890 | $98,855 |
| Source: FST and FIRMS adapted by Program Analytics and Risk Mitigation | |||||
Per capita NIHB mental health counselling expenditures by region (thousands of dollars): 2022 to 2023
Expenditures per capita are total NIHB mental health counselling expenditures divided by the number of eligible clients, regardless of whether clients submitted a claim in the reporting period.
In 2022 to 2023, the national per capita expenditure for the NIHB mental health counselling benefit was $106 per NIHB-eligible client.
Saskatchewan had the highest per capita expenditure at $152, followed by Alberta at $120. Per capita expenditure was lowest in the North, at $46. Note that mental health counselling per capita expenditures in the North are underrepresented as mental health counselling services for clients in Nunavut and the Northwest Territories are funded via contribution agreements.
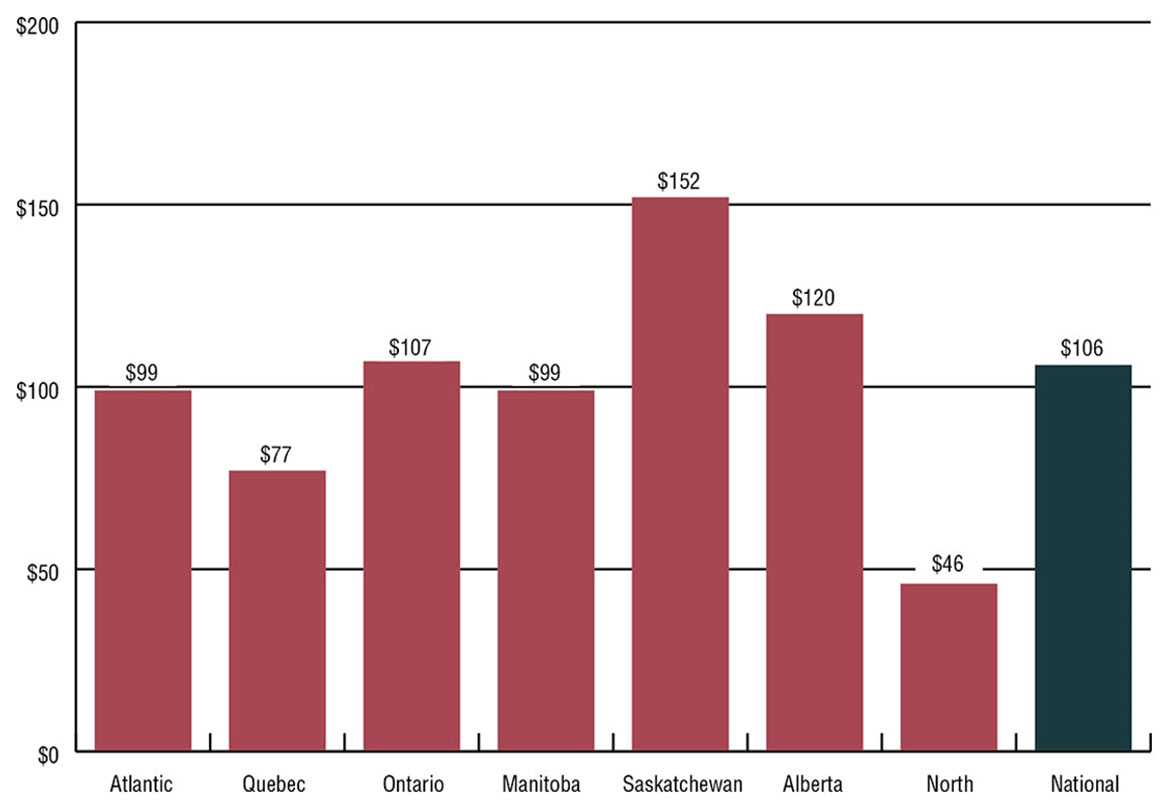
Source: SVS and FST adapted by Program Analytics and Risk Mitigation
Text alternative for Figure 9.3: Per capita NIHB mental health counselling expenditures by region ($ 000's)
This image visually describes NIHB mental health counselling per capita expenditures, as follows:
- Atlantic is $99
- Quebec is $77
- Ontario is $107
- Manitoba is $99
- Saskatchewan is $152
- Alberta is $120
- North is $46
- National $106
NIHB mental health counselling claimants by age group, gender and region: 2022 to 2023
Of the 936,006 clients eligible to receive benefits under the NIHB program, a total of 31,836 claimants, representing 3.4% of the NIHB client population, had at least one mental health counselling claim paid through the Health Information and Claims Processing Services (HICPS) system in 2022 to 2023. Of this total, 22,050 were female (69.3%) and 9,786 were male (30.7%). This compares to the total eligible population where 51% were female and 49% were male.
Note that these figures underrepresent mental health counselling utilization, because they do not include clients accessing mental health counselling benefits delivered through contribution agreements or through travelling provider arrangements. This includes clients in Nunavut and the Northwest Territories, where mental health counselling services are funded via contribution agreements. As such, these claims are not captured in the HICPS system.
The average age of mental health counselling claimants was 32 years. The average age for female and male claimants was 33 and 31 years of age, respectively.
Table 9.3: NIHB mental health counselling claimants by age group, gender and region
Source: HICPS and SVS adapted by Program Analytics and Risk Mitigation
| Age group | Total | |||||||||||||
|---|---|---|---|---|---|---|---|---|---|---|---|---|---|---|
| 0-9 | 10-14 | 15-19 | 20-24 | 25-29 | 30-34 | 35-39 | 40-44 | 45-49 | 50-54 | 55-59 | 60-64 | 65+ | ||
| Male | 27 | 88 | 78 | 75 | 82 | 78 | 71 | 34 | 26 | 32 | 22 | 13 | 10 | 636 |
| Female | 28 | 124 | 190 | 201 | 261 | 201 | 146 | 116 | 101 | 66 | 57 | 30 | 41 | 1,562 |
| Total | 55 | 212 | 268 | 276 | 343 | 279 | 217 | 150 | 127 | 98 | 79 | 43 | 51 | 2,198 |
| Average age: 31 (Male: 30, Female: 32) | ||||||||||||||
| Age group | Total | |||||||||||||
|---|---|---|---|---|---|---|---|---|---|---|---|---|---|---|
| 0-9 | 10-14 | 15-19 | 20-24 | 25-29 | 30-34 | 35-39 | 40-44 | 45-49 | 50-54 | 55-59 | 60-64 | 65+ | ||
| Male | 24 | 44 | 64 | 51 | 78 | 68 | 60 | 57 | 48 | 31 | 20 | 19 | 19 | 583 |
| Female | 19 | 107 | 120 | 160 | 199 | 178 | 150 | 112 | 97 | 75 | 69 | 49 | 43 | 1,378 |
| Total | 43 | 151 | 184 | 211 | 277 | 246 | 210 | 169 | 145 | 106 | 89 | 68 | 62 | 1,961 |
| Average age: 34 (Male: 34, Female: 34) | ||||||||||||||
| Age group | Total | |||||||||||||
|---|---|---|---|---|---|---|---|---|---|---|---|---|---|---|
| 0-9 | 10-14 | 15-19 | 20-24 | 25-29 | 30-34 | 35-39 | 40-44 | 45-49 | 50-54 | 55-59 | 60-64 | 65+ | ||
| Male | 244 | 362 | 385 | 327 | 379 | 335 | 310 | 269 | 233 | 168 | 135 | 89 | 84 | 3,320 |
| Female | 260 | 602 | 819 | 751 | 961 | 843 | 748 | 606 | 509 | 433 | 340 | 263 | 272 | 7,407 |
| Total | 504 | 964 | 1,204 | 1,078 | 1,340 | 1,178 | 1,058 | 875 | 742 | 601 | 475 | 352 | 356 | 10,727 |
| Average age: 33 (Male: 31, Female: 34) | ||||||||||||||
| Age group | Total | |||||||||||||
|---|---|---|---|---|---|---|---|---|---|---|---|---|---|---|
| 0-9 | 10-14 | 15-19 | 20-24 | 25-29 | 30-34 | 35-39 | 40-44 | 45-49 | 50-54 | 55-59 | 60-64 | 65+ | ||
| Male | 23 | 110 | 152 | 138 | 144 | 134 | 90 | 67 | 56 | 49 | 25 | 17 | 18 | 1,023 |
| Female | 52 | 208 | 333 | 358 | 368 | 317 | 225 | 172 | 123 | 98 | 76 | 44 | 53 | 2,427 |
| Total | 75 | 318 | 485 | 496 | 512 | 451 | 315 | 239 | 179 | 147 | 101 | 61 | 71 | 3,450 |
| Average age: 31 (Male: 30, Female: 31) | ||||||||||||||
| Age group | Total | |||||||||||||
|---|---|---|---|---|---|---|---|---|---|---|---|---|---|---|
| 0-9 | 10-14 | 15-19 | 20-24 | 25-29 | 30-34 | 35-39 | 40-44 | 45-49 | 50-54 | 55-59 | 60-64 | 65+ | ||
| Male | 102 | 248 | 283 | 243 | 269 | 290 | 241 | 207 | 157 | 127 | 105 | 64 | 63 | 2,399 |
| Female | 119 | 447 | 689 | 579 | 741 | 709 | 585 | 410 | 334 | 297 | 212 | 146 | 160 | 5,428 |
| Total | 221 | 695 | 972 | 822 | 1,010 | 999 | 826 | 617 | 491 | 424 | 317 | 210 | 223 | 7,827 |
| Average age: 33 (Male: 32, Female: 33) | ||||||||||||||
| Age group | Total | |||||||||||||
|---|---|---|---|---|---|---|---|---|---|---|---|---|---|---|
| 0-9 | 10-14 | 15-19 | 20-24 | 25-29 | 30-34 | 35-39 | 40-44 | 45-49 | 50-54 | 55-59 | 60-64 | 65+ | ||
| Male | 86 | 232 | 208 | 146 | 152 | 174 | 124 | 111 | 74 | 50 | 40 | 21 | 22 | 1,440 |
| Female | 83 | 305 | 367 | 331 | 393 | 434 | 327 | 248 | 160 | 140 | 117 | 66 | 67 | 3,038 |
| Total | 169 | 537 | 575 | 477 | 545 | 608 | 451 | 359 | 234 | 190 | 157 | 87 | 89 | 4,478 |
| Average age: 31 (Male: 28, Female: 32) | ||||||||||||||
| Age group | Total | |||||||||||||
|---|---|---|---|---|---|---|---|---|---|---|---|---|---|---|
| 0-9 | 10-14 | 15-19 | 20-24 | 25-29 | 30-34 | 35-39 | 40-44 | 45-49 | 50-54 | 55-59 | 60-64 | 65+ | ||
| Male | 8 | 32 | 22 | 27 | 31 | 19 | 21 | 20 | 16 | 24 | 17 | 19 | 19 | 275 |
| Female | 6 | 23 | 47 | 59 | 72 | 78 | 62 | 59 | 27 | 34 | 47 | 15 | 34 | 563 |
| Total | 13 | 56 | 69 | 86 | 103 | 97 | 83 | 79 | 43 | 58 | 64 | 34 | 53 | 838 |
| Average age: 37 (Male: 37, Female: 37) | ||||||||||||||
| Age group | Total | |||||||||||||
|---|---|---|---|---|---|---|---|---|---|---|---|---|---|---|
| 0-9 | 10-14 | 15-19 | 20-24 | 25-29 | 30-34 | 35-39 | 40-44 | 45-49 | 50-54 | 55-59 | 60-64 | 65+ | ||
| Male | 521 | 1,120 | 1,204 | 1,013 | 1,153 | 1,117 | 931 | 772 | 616 | 487 | 371 | 244 | 237 | 9,786 |
| Female | 573 | 1,831 | 2,586 | 2,469 | 3,029 | 2,799 | 2,271 | 1,743 | 1,371 | 1,156 | 928 | 622 | 672 | 22,050 |
| Total | 1,094 | 2,951 | 3,790 | 3,482 | 4,182 | 3,916 | 3,202 | 2,515 | 1,987 | 1,643 | 1,299 | 866 | 909 | 31,836 |
| Average age: 32 (Male: 31, Female: 33) | ||||||||||||||
| Region | Total | |||||||
|---|---|---|---|---|---|---|---|---|
| Atlantic | Quebec | Ontario | Manitoba | Saskatchewan | Alberta | North | ||
| Male | 30 | 34 | 31 | 30 | 32 | 28 | 37 | 31 |
| Female | 32 | 34 | 34 | 31 | 33 | 32 | 37 | 33 |
| Total | 31 | 34 | 33 | 31 | 33 | 31 | 37 | 32 |
NIHB mental health counselling expenditures by category: 2022 to 2023
In 2022 to 2023, individual counselling sessions accounted for $38.1 million or 68.4% of all HICPS mental health counselling expenditures. Telehealth counselling sessions were $16.0 million or 28.8%, followed by other at $702 thousand or 1.3%.
| Category | Claimants | Expenditures | % Change from previous |
|---|---|---|---|
| Individual Counselling Session | 21,793 | $38,170,679 | 33.4% |
| Telehealth Counselling Session | 8,400 | $16,049,967 | 3.3% |
| Other | 2,493 | $701,991 | 40.8% |
| Family Counselling Session | 368 | $406,445 | 13.2% |
| Group Counselling Session | 470 | $485,032 | 28.3% |
| Source: HICPS adapted by Program Analytics and Risk Mitigation | |||
Section 10: 10 year regional expenditure trends
Atlantic region
Annual expenditures in the Atlantic Region for 2022 to 2023 totalled $92.5 million, an increase of 9.8% over the $84.2 million spent in 2021 to 2022. Pharmacy expenditures in 2022 to 2023 increased by 12.7% to $45.8 million, medical transportation costs increased by 11.0% to $17.5 million and dental expenditures increased by 7.1% to $12.6 million. Mental health expenditures decreased by 1.2%, MS&E expenditures increased by 6.2% and vision care expenditures decreased by 0.2%.
Pharmacy expenditures accounted for almost half of NIHB expenditures in the Atlantic Region 49.5%. Medical transportation expenditures ranked second at 18.9%, followed by dental at 13.7%. MS&E, vision care and mental health counselling expenditures accounted for 5.2%, 7.5% and 4.5% of total expenditures respectively.
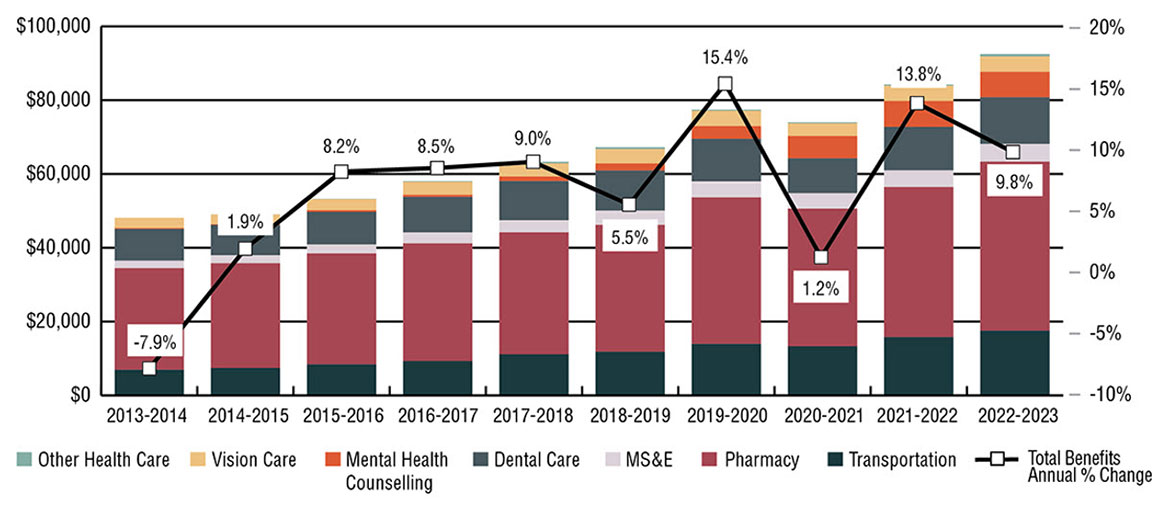
Source: FST and FIRMS adapted by Program Analytics and Risk Mitigation
Text alternative for Figure 10.1: Percentage change in Atlantic region NIHB expenditures ($ 000's)
This image is a stacked bar graph which visually describes NIHB expenditures and annual percentage change in the Atlantic region, as follows:
| Atlantic region | 2013 to 2014 | 2014 to 2015 | 2015 to 2016 | 2016 to 2017 | 2017 to 2018 | 2018 to 2019 | 2019 to 2020 | 2020 to 2021 | 2021 to 2022 | 2022 to 2023 |
|---|---|---|---|---|---|---|---|---|---|---|
| Total expenditures ($M) | $46,033 | $46,912 | $50,773 | $55,079 | $60,040 | $63,342 | $73,071 | $73,984 | $84,227 | $92,488 |
| Total benefits annual % change | -7.9% | 1.9% | 8.2% | 8.5% | 9.0% | 5.5% | 15.4% | 1.2% | 13.8% | 9.8% |
| Atlantic region | 2013 to 2014 | 2014 to 2015 | 2015 to 2016 | 2016 to 2017 | 2017 to 2018 | 2018 to 2019 | 2019 to 2020 | 2020 to 2021 | 2021 to 2022 | 2022 to 2023 |
|---|---|---|---|---|---|---|---|---|---|---|
| Transportation | $6,916 | $7,419 | $8,380 | $9,277 | $11,147 | $11,820 | $13,910 | $13,263 | $15,776 | $17,512 |
| Pharmacy | $27,517 | $28,398 | $30,064 | $31,899 | $33,021 | $34,348 | $39,724 | $37,323 | $40,657 | $45,819 |
| MS&E | $2,064 | $2,120 | $2,449 | $2,990 | $3,279 | $3,900 | $4,359 | $4,177 | $4,508 | $4,785 |
| Dental | $8,609 | $8,238 | $8,846 | $9,593 | $10,610 | $10,841 | $11,545 | $9,455 | $11,801 | $12,638 |
| Mental health | $235 | $169 | $419 | $601 | $1,204 | $1,932 | $3,428 | $6,037 | $7,001 | $6,918 |
| Vision care | $2,757 | $2,666 | $3,021 | $3,502 | $3,632 | $3,885 | $4,150 | $3,436 | $4,158 | $4,149 |
| Other | $0 | $21 | $44 | $207 | $427 | $516 | $314 | $293 | $326 | $666 |
| Total | $46,033 | $46,912 | $50,773 | $55,079 | $60,040 | $63,342 | $73,071 | $73,984 | $84,227 | $92,488 |
| Source: FST and FIRMS adapted by Program Analytics and Risk Mitigation | ||||||||||
Quebec
Annual expenditures in Quebec for 2022 to 2023 totalled $128.0 million, an increase of 9.1% from the $117.4 million spent in 2021 to 2022.
Medical transportation expenditures increased by 8.0% to $28.9 million in 2022 to 2023, pharmacy expenditures increased by 10.2% to $64.8 million and dental expenditures increased by 7.0% to $20.4 million. MS&E costs increased by 10.3%, mental health expenditures increased by 13.9% and vision care expenditures increased by 3.6%.
Pharmacy expenditures accounted for half of total NIHB expenditures in Quebec in 2022 to 2023 at 50.6%. Medical transportation expenditures ranked second at 22.6%, followed by dental at 16.0%. Mental health counselling, MS&E and vision care expenditures accounted for 5.0%, 2.5% and 3.2% of total expenditures respectively.
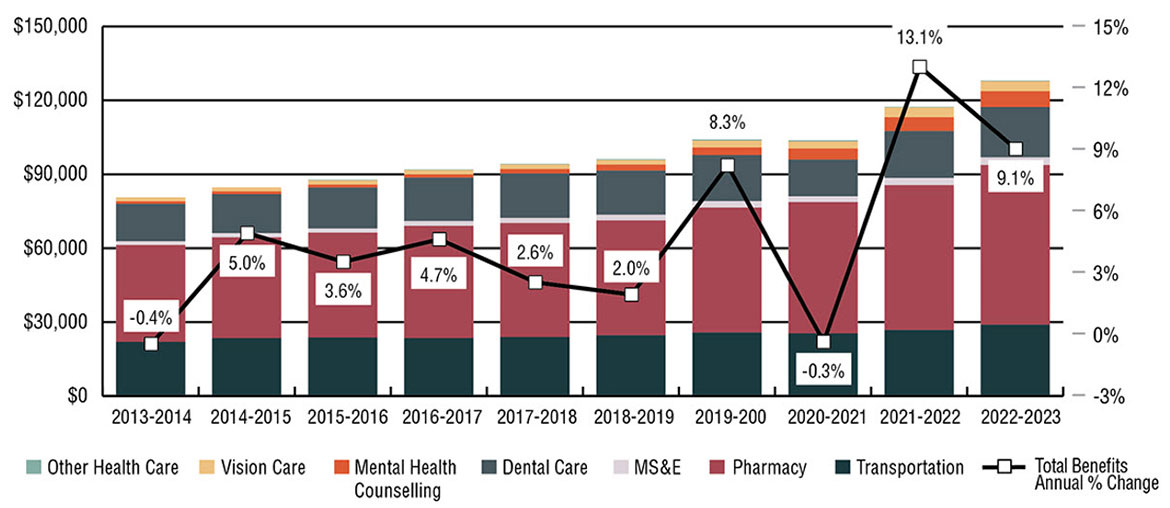
Source: FST and FIRMS adapted by Program Analytics and Risk Mitigation
Text alternative for Figure 10.2: Percentage change in Quebec NIHB expenditures ($ 000's)
This image visually describes NIHB expenditures and annual percentage change in Quebec, as follows:
| Quebec | 2013 to 2014 | 2014 to 2015 | 2015 to 2016 | 2016 to 2017 | 2017 to 2018 | 2018 to 2019 | 2019 to 2020 | 2020 to 2021 | 2021 to 2022 | 2022 to 2023 |
|---|---|---|---|---|---|---|---|---|---|---|
| Total expenditures ($M) | $80,608 | $84,666 | $87,690 | $91,831 | $94,210 | $96,120 | $104,136 | $103,773 | $117,373 | $128,017 |
| Total benefits annual % change | -0.4% | 5.0% | 3.6% | 4.7% | 2.6% | 2.0% | 8.3% | -0.3% | 13.1% | 9.1% |
| Quebec | 2013 to 2014 | 2014 to 2015 | 2015 to 2016 | 2016 to 2017 | 2017 to 2018 | 2018 to 2019 | 2019 to 2020 | 2020 to 2021 | 2021 to 2022 | 2022 to 2023 |
|---|---|---|---|---|---|---|---|---|---|---|
| Transportation | $21,945 | $23,506 | $23,687 | $23,501 | $23,918 | $24,642 | $25,729 | $25,379 | $26,775 | $28,921 |
| Pharmacy | $39,324 | $40,897 | $42,554 | $45,554 | $46,227 | $46,623 | $50,747 | $53,282 | $58,827 | $64,799 |
| MS&E | $1,501 | $1,684 | $1,752 | $1,994 | $2,163 | $2,345 | $2,564 | $2,379 | $2,855 | $3,149 |
| Dental | $15,216 | $15,799 | $16,641 | $17,569 | $17,961 | $17,882 | $18,733 | $14,934 | $19,092 | $20,427 |
| Mental health | $1,003 | $1,148 | $1,148 | $1,292 | $1,861 | $2,382 | $3,138 | $4,493 | $5,604 | $6,381 |
| Vision care | $1,619 | $1,622 | $1,749 | $1,762 | $1,819 | $1,908 | $2,736 | $2,814 | $3,938 | $4,081 |
| Other | $0 | $10 | $258 | $263 | $260 | $339 | $490 | $493 | $282 | $258 |
| Total | $80,608 | $84,666 | $87,690 | $91,831 | $94,210 | $96,120 | $104,136 | $103,773 | $117,373 | $128,017 |
| Source: FST and FIRMS adapted by Program Analytics and Risk Mitigation | ||||||||||
Ontario
Annual expenditures in Ontario for 2022 to 2023 totalled $365.1 million, an increase of 12.2% from the $325.5 million spent in 2021 to 2022.
In 2022 to 2023, pharmacy expenditures in Ontario increased by 1.6% to $113.8 million, while medical transportation costs increased by 22.2% to $140.3 million. Dental expenditures increased by 13.2% to $67.1 million. Mental health counselling expenditures increased by 12.5%, while MS&E increased by 15.5% and vision care expenditures increased by 6.4%.
Medical transportation expenditures accounted for 38.4% of total expenditures for Ontario. Pharmacy costs ranked second at 31.2%, followed by dental at 18.4%. Mental health, MS&E and vision care expenditures accounted for 6.7%, 2.8% and 2.4% of total expenditures respectively.
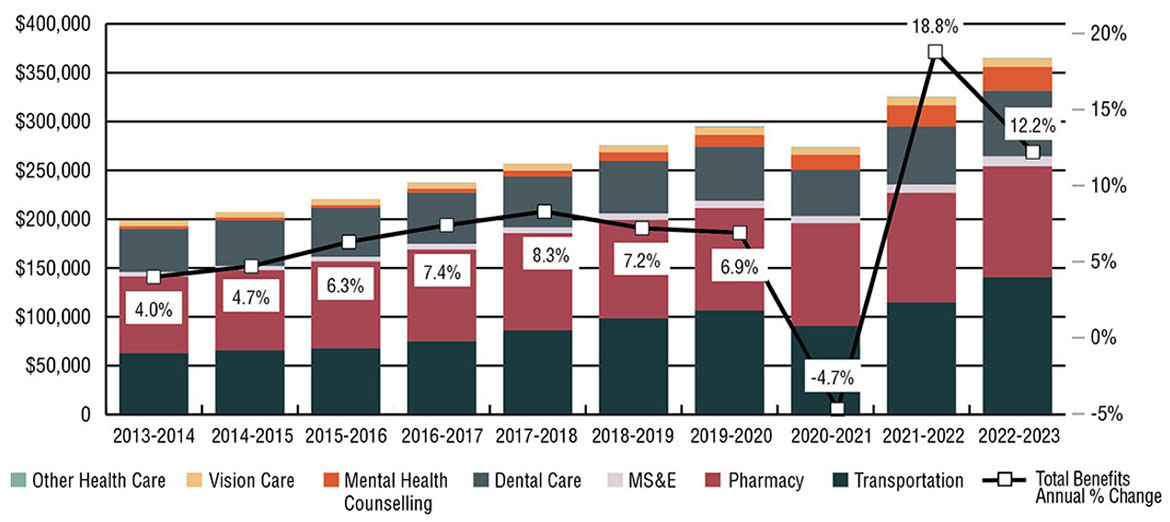
Source: FST and FIRMS adapted by Program Analytics and Risk Mitigation
Text alternative for Figure 10.3: Percentage change in Ontario NIHB expenditures ($ 000's)
This image is a stacked bar graph which visually describes NIHB expenditures and annual percentage change in Ontario, as follows:
| Ontario | 2013 to 2014 | 2014 to 2015 | 2015 to 2016 | 2016 to 2017 | 2017 to 2018 | 2018 to 2019 | 2019 to 2020 | 2020 to 2021 | 2021 to 2022 | 2022 to 2023 |
|---|---|---|---|---|---|---|---|---|---|---|
| Total expenditures ($M) | $193,929 | $203,043 | $215,738 | $231,663 | $250,947 | $269,127 | $287,643 | $273,987 | $325,494 | $365,069 |
| Total benefits annual % change | 4.0% | 4.7% | 6.3% | 7.4% | 8.3% | 7.2% | 6.9% | -4.7% | 18.8% | 12.2% |
| Ontario | 2013 to 2014 | 2014 to 2015 | 2015 to 2016 | 2016 to 2017 | 2017 to 2018 | 2018 to 2019 | 2019 to 2020 | 2020 to 2021 | 2021 to 2022 | 2022 to 2023 |
|---|---|---|---|---|---|---|---|---|---|---|
| Transportation | $62,865 | $65,781 | $67,772 | $74,890 | $86,091 | $98,605 | $106,638 | $90,646 | $114,814 | $140,343 |
| Pharmacy | $78,510 | $81,982 | $88,872 | $94,101 | $99,550 | $100,558 | $104,760 | $105,300 | $112,069 | $113,842 |
| MS&E | $4,505 | $4,255 | $4,811 | $5,825 | $5,915 | $6,662 | $7,322 | $7,297 | $8,700 | $10,045 |
| Dental | $43,972 | $46,759 | $49,903 | $52,105 | $52,055 | $53,667 | $55,386 | $47,218 | $59,326 | $67,128 |
| Mental health | $2,862 | $2,803 | $3,021 | $4,091 | $6,028 | $9,053 | $12,116 | $15,491 | $21,762 | $24,491 |
| Vision care | $5,721 | $5,717 | $6,160 | $6,223 | $6,848 | $6,744 | $7,860 | $7,346 | $8,113 | $8,633 |
| Other | $0 | $2 | $11 | $254 | $375 | $500 | $883 | $688 | $710 | $587 |
| Total | $193,929 | $203,043 | $215,738 | $231,663 | $250,947 | $269,127 | $287,643 | $273,987 | $325,494 | $365,069 |
| Source: FST and FIRMS, adapted by Program Analytics and Risk Mitigation | ||||||||||
Manitoba
Annual expenditures in Manitoba for 2022 to 2023 totalled $451.8 million, an increase of 15.5% from the $391.2 million spent in 2021 to 2022. Medical transportation expenditures in 2022 to 2023 increased by 26.6% to $233.1 million, while pharmacy costs increased by 7.0% to $120.2 million. Dental expenditures increased by 5.0% to $60.2 million. Mental health counselling, MS&E and vision care expenditures increased by 0.4%, 4.0% and 4.6% respectively.
Due to the higher proportion of clients living in northern or remote communities in Manitoba, medical transportation expenditures comprised more than half of total expenditures in Manitoba at 51.6%. Pharmacy costs ranked second at 26.6%, followed by dental at 13.3%. Mental health couselling, MS&E and vision care expenditures accounted for 3.6%, 3.1% and 1.7% of total expenditures respectively.
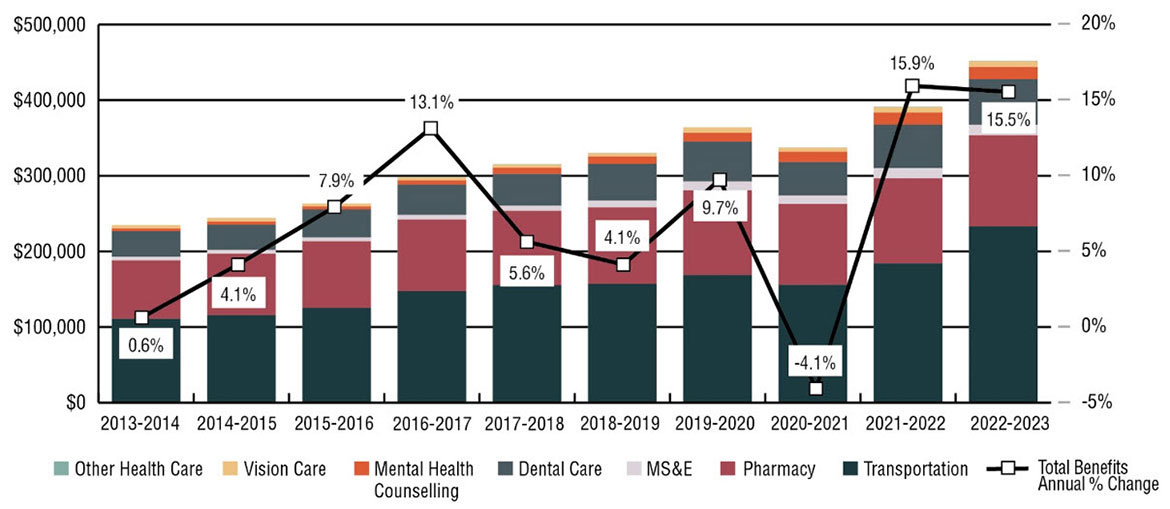
Source: FST and FIRMS, adapted by Program Analytics and Risk Mitigation
Text alternative for Figure 10.4: Percentage change in Manitoba NIHB expenditures ($ 000's)
This image is a stacked bar graph which visually describes NIHB expenditures and annual percentage change in Manitoba, as follows:
| Manitoba | 2013 to 2014 | 2014 to 2015 | 2015 to 2016 | 2016 to 2017 | 2017 to 2018 | 2018 to 2019 | 2019 to 2020 | 2020 to 2021 | 2021 to 2022 | 2022 to 2023 |
|---|---|---|---|---|---|---|---|---|---|---|
| Total expenditures ($M) | $229,670 | $239,190 | $258,077 | $291,989 | $308,208 | $320,953 | $351,983 | $337,517 | $391,177 | $451,799 |
| Total benefits annual % change | 0.6% | 4.1% | 7.9% | 13.1% | 5.6% | 4.1% | 9.7% | -4.1% | 15.9% | 15.5% |
| Manitoba | 2013 to 2014 | 2014 to 2015 | 2015 to 2016 | 2016 to 2017 | 2017 to 2018 | 2018 to 2019 | 2019 to 2020 | 2020 to 2021 | 2021 to 2022 | 2022 to 2023 |
|---|---|---|---|---|---|---|---|---|---|---|
| Transportation | $111,016 | $115,705 | $125,308 | $147,167 | $155,370 | $156,961 | $168,686 | $155,794 | $184,200 | $233,140 |
| Pharmacy | $77,034 | $81,059 | $87,997 | $94,757 | $98,046 | $101,250 | $112,025 | $106,851 | $112,353 | $120,207 |
| MS&E | $4,908 | $5,045 | $5,300 | $6,341 | $6,985 | $9,166 | $11,966 | $11,145 | $13,330 | $13,870 |
| Dental | $33,649 | $33,527 | $36,764 | $39,986 | $41,949 | $48,099 | $52,622 | $44,149 | $57,381 | $60,247 |
| Mental health | $3,622 | $4,099 | $3,780 | $5,635 | $8,124 | $9,705 | $11,475 | $13,803 | $16,333 | $16,393 |
| Vision care | $4,348 | $4,800 | $4,212 | $4,204 | $4,479 | $4,699 | $6,935 | $5,529 | $7,334 | $7,669 |
| Other | $0 | $0 | $17 | $240 | $240 | $240 | $240 | $245 | $247 | $273 |
| Total | $229,670 | $239,190 | $258,077 | $291,989 | $308,208 | $320,953 | $351,983 | $337,517 | $391,177 | $451,799 |
| Source: FST and FIRMS, adapted by Program Analytics and Risk Mitigation | ||||||||||
Saskatchewan
Annual expenditures in Saskatchewan for 2022 to 2023 totalled $363.3 million, an increase of 8.3% from the $335.6 million spent in 2021 to 2022.
NIHB pharmacy expenditures increased in Saskatchewan by 5.6% to $126.7 million, while medical transportation costs increased by 11.4% to $114.9 million. Dental cost increased by 11.2% to $70.5 million. Mental health counselling, MS&E and vision care costs increased by 1.3%, 14.7% and 0.04% respectively.
Pharmacy expenditures comprised the largest portion of total NIHB expenditures in Saskatchewan at 34.9%, medical transportation costs ranked second at 31.6%, followed by dental at 19.4%. Mental health, MS&E and vision care expenditures accounted for 6.9%, 4.2% and 2.9% of total expenditures respectively.
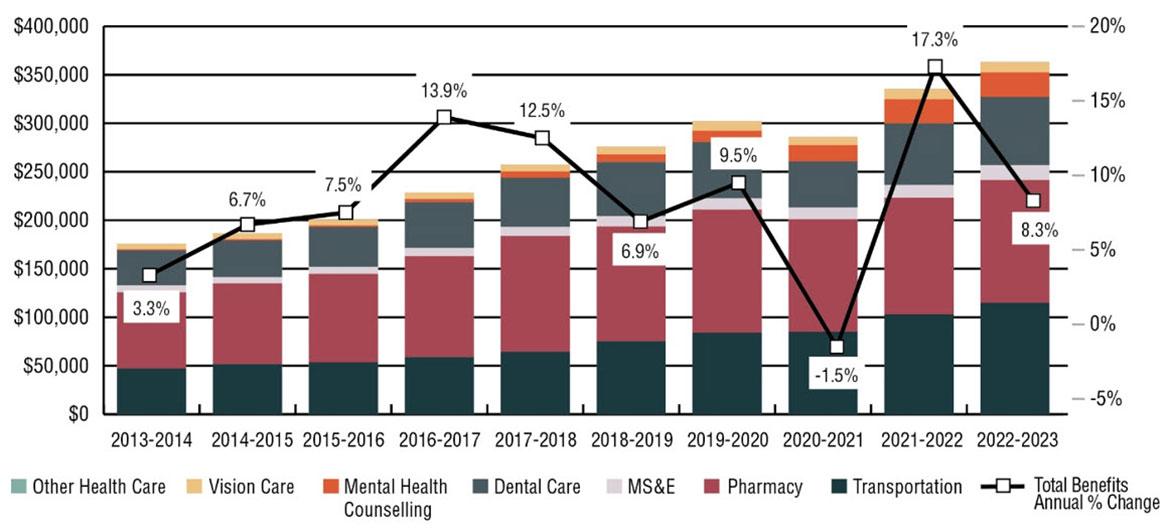
Source: FST and FIRMS, adapted by Program Analytics and Risk Mitigation
Text alternative for Figure 10.5: Percentage change in Saskatchewan NIHB expenditures ($ 000's)
This image is a stacked bar graph which visually describes NIHB expenditures and annual percentage change in Saskatchewan, as follows:
| Saskatchewan | 2013 to 2014 | 2014 to 2015 | 2015 to 2016 | 2016 to 2017 | 2017 to 2018 | 2018 to 2019 | 2019 to 2020 | 2020 to 2021 | 2021 to 2022 | 2022 to 2023 |
|---|---|---|---|---|---|---|---|---|---|---|
| Total expenditures ($M) | $168,752 | $180,000 | $193,502 | $220,352 | $247,997 | $265,082 | $290,386 | $286,028 | $335,584 | $363,319 |
| Total benefits annual % change | 3.3% | 6.7% | 7.5% | 13.9% | 12.5% | 6.9% | 9.5% | -1.5% | 17.3% | 8.3% |
| Saskatchewan | 2013 to 2014 | 2014 to 2015 | 2015 to 2016 | 2016 to 2017 | 2017 to 2018 | 2018 to 2019 | 2019 to 2020 | 2020 to 2021 | 2021 to 2022 | 2022 to 2023 |
|---|---|---|---|---|---|---|---|---|---|---|
| Transportation | $47,180 | $51,543 | $53,566 | $58,902 | $64,363 | $75,330 | $83,947 | $84,951 | $103,152 | $114,863 |
| Pharmacy | $78,546 | $83,361 | $91,170 | $104,082 | $119,326 | $118,250 | $126,963 | $116,188 | $120,000 | $126,676 |
| MS&E | $6,911 | $6,542 | $7,260 | $8,382 | $9,426 | $10,762 | $11,889 | $11,908 | $13,352 | $15,310 |
| Dental | $36,399 | $37,679 | $41,028 | $47,321 | $50,635 | $55,603 | $57,639 | $47,507 | $63,408 | $70,480 |
| Mental health | $1,017 | $1,351 | $1,631 | $3,304 | $6,559 | $7,867 | $11,783 | $16,770 | $24,881 | $25,194 |
| Vision care | $5,611 | $6,066 | $6,104 | $6,533 | $6,905 | $7,822 | $9,844 | $8,493 | $10,581 | $10,585 |
| Other | $0 | $0 | $4 | $210 | $210 | $210 | $210 | $211 | $211 | $211 |
| Total | $168,752 | $180,000 | $193,502 | $220,352 | $247,997 | $265,082 | $290,386 | $286,028 | $335,584 | $363,319 |
| Source: FST and FIRMS, adapted by Program Analytics and Risk Mitigation | ||||||||||
Alberta
Annual expenditures in Alberta for 2022 to 2023 totalled $271.8 million, an increase of 9.2% from the $248.9 million spent in 2021 to 2022. Medical transportation expenditures increased by 7.0% to $71.9 million, while pharmacy costs increased by 11.3% to $96.5 million. Dental expenditures increased by 11.0% to $65.2 million. Mental health counselling, MS&E and vision care expenditures increased by 7.1%, 7.3% and 0.4% respectively
Pharmacy expenditures accounted for 35.5% of total NIHB expenditures in Alberta. Medical transportation costs ranked second at 26.5%, followed by dental at 24.0%. Mental health counselling, MS&E and vision care expenditures accounted for 5.8%, 4.6% and 3.5% of total expenditures respectively.
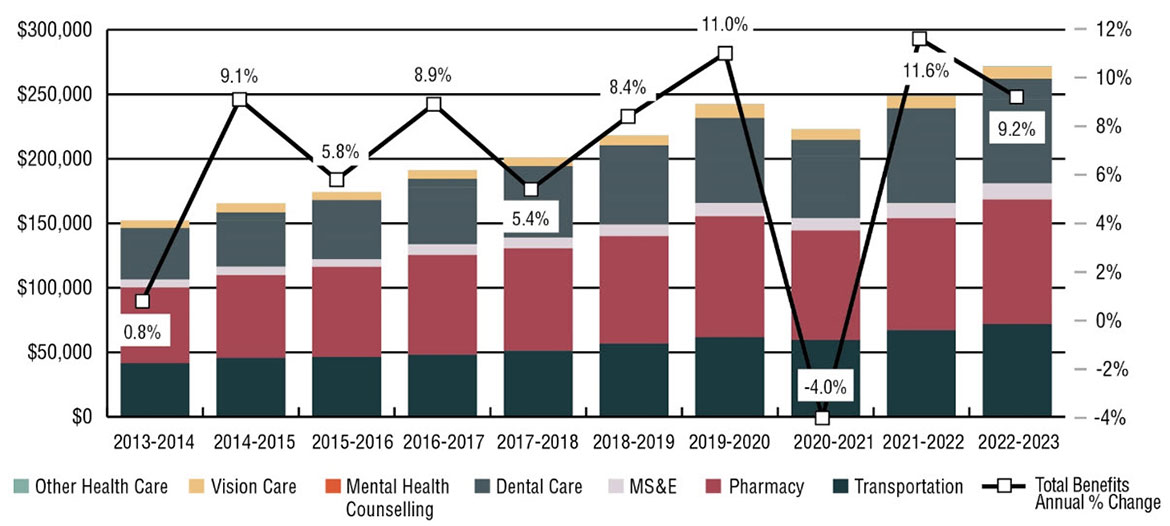
Source: FST and FIRMS, adapted by Program Analytics and Risk Mitigation
Text alternative for Figure 10.6: Percentage change in Alberta NIHB expenditures ($ 000's)
This image is a stacked bar graph which visually describes NIHB expenditures and annual percentage change in the Alberta region, as follows:
| Alberta | 2013 to 2014 | 2014 to 2015 | 2015 to 2016 | 2016 to 2017 | 2017 to 2018 | 2018 to 2019 | 2019 to 2020 | 2020 to 2021 | 2021 to 2022 | 2022 to 2023 |
|---|---|---|---|---|---|---|---|---|---|---|
| Total expenditures ($M) | $146,051 | $158,911 | $168,211 | $183,108 | $192,983 | $209,122 | $232,177 | $222,953 | $248,869 | $271,783 |
| Total benefits annual % change | 0.8% | 9.1% | 5.8% | 8.9% | 5.4% | 8.4% | 11.0% | -4.0% | 11.6% | 9.2% |
| Alberta | 2013 to 2014 | 2014 to 2015 | 2015 to 2016 | 2016 to 2017 | 2017 to 2018 | 2018 to 2019 | 2019 to 2020 | 2020 to 2021 | 2021 to 2022 | 2022 to 2023 |
|---|---|---|---|---|---|---|---|---|---|---|
| Transportation | $41,451 | $45,756 | $46,252 | $48,157 | $51,187 | $56,870 | $61,669 | $59,492 | $67,206 | $71,908 |
| Pharmacy | $58,777 | $64,087 | $69,992 | $77,265 | $79,343 | $83,103 | $93,776 | $84,920 | $86,680 | $96,511 |
| MS&E | $6,136 | $6,487 | $5,938 | $8,236 | $8,260 | $9,127 | $10,250 | $9,647 | $11,658 | $12,503 |
| Dental | $34,928 | $35,974 | $39,753 | $44,315 | $47,637 | $51,617 | $54,993 | $47,741 | $58,790 | $65,240 |
| Mental health | $4,959 | $6,010 | $6,003 | $6,444 | $7,761 | $9,545 | $11,020 | $12,843 | $14,771 | $15,815 |
| Vision care | $5,936 | $7,084 | $6,207 | $6,928 | $6,764 | $7,696 | $10,514 | $8,030 | $9,405 | $9,446 |
| Other | $0 | $0 | $3 | $0 | $291 | $291 | $204 | $280 | $360 | $360 |
| Total | $146,051 | $158,911 | $168,211 | $183,108 | $192,983 | $209,122 | $232,177 | $222,953 | $248,869 | $271,783 |
| Source: FST and FIRMS, adapted by Program Analytics and Risk Mitigation | ||||||||||
Northern region
Annual expenditures in the Northern region for 2022 to 2023 totalled $181.8 million, an increase of 12.2% from the $162.1 million spent in 2021 to 2022.
Medical transportation expenditures increased by 15.1% to $103.9 million in 2022 to 2023 while pharmacy costs increased by 6.2% to $33.5 million. Dental expenditures increased by 13.1% to $30.3 million. Mental health counselling expenditures and vision care expenditures increased by 1.8% and 14.8% respectively, while MS&E expenditures decreased by 2.2%.
Similar to Manitoba, medical transportation expenditures comprised the largest portion of total NIHB expenditures in the Northern region at 57.2%. Pharmacy costs ranked second at 18.4%, followed by dental at 16.7%. MS&E, vision care, and mental health counselling expenditures accounted for 3.0%, 2.6% and 1.9% of total expenditures respectively.
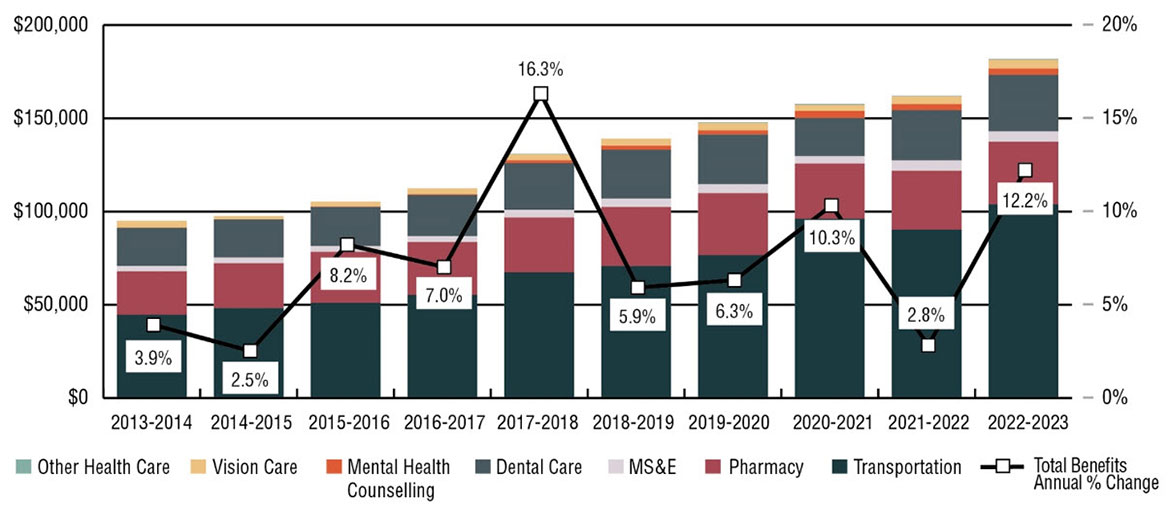
Source: FST and FIRMS, adapted by Program Analytics and Risk Mitigation
Text alternative for Figure 10.7: Percentage change in Northern Region NIHB expenditures ($ 000's)
This image is a stacked bar graph which visually describes NIHB expenditures and annual percentage change in the Northern region, as follows:
| Northern region | 2013 to 2014 | 2014 to 2015 | 2015 to 2016 | 2016 to 2017 | 2017 to 2018 | 2018 to 2019 | 2019 to 2020 | 2020 to 2021 | 2021 to 2022 | 2022 to 2023 |
|---|---|---|---|---|---|---|---|---|---|---|
| Total expenditures ($M) | $92,027 | $94,343 | $102,040 | $109,157 | $126,933 | $134,474 | $142,961 | $157,664 | $162,080 | $181,796 |
| Total benefits annual % change | 3.9% | 2.5% | 8.2% | 7.0% | 16.3% | 5.9% | 6.3% | 10.3% | 2.8% | 12.2% |
| Northern region | 2013 to 2014 | 2014 to 2015 | 2015 to 2016 | 2016 to 2017 | 2017 to 2018 | 2018 to 2019 | 2019 to 2020 | 2020 to 2021 | 2021 to 2022 | 2022 to 2023 |
|---|---|---|---|---|---|---|---|---|---|---|
| Transportation | $44,703 | $48,246 | $50,940 | $55,125 | $67,413 | $70,806 | $76,601 | $96,194 | $90,286 | $103,926 |
| Pharmacy | $23,144 | $23,941 | $27,408 | $28,488 | $29,373 | $31,571 | $33,220 | $29,479 | $31,499 | $33,457 |
| MS&E | $2,949 | $3,101 | $3,146 | $3,263 | $4,018 | $4,529 | $4,884 | $4,024 | $5,647 | $5,520 |
| Dental | $20,415 | $20,413 | $20,936 | $21,966 | $25,141 | $26,211 | $26,546 | $20,342 | $26,830 | $30,332 |
| Mental health | $2 | $0 | $191 | $362 | $1,528 | $2,172 | $2,167 | $3,895 | $3,333 | $3,394 |
| Vision care | $3,763 | $1,743 | $2,564 | $3,217 | $3,131 | $3,713 | $3,929 | $3,206 | $4,081 | $4,683 |
| Other | $0 | $1 | $1 | $0 | $346 | $1 | $498 | $524 | $405 | $485 |
| Total | $92,027 | $94,343 | $102,040 | $109,157 | $126,933 | $134,474 | $142,961 | $157,664 | $162,080 | $181,796 |
| Source: FST and FIRMS, adapted by Program Analytics and Risk Mitigation | ||||||||||
Section 11: NIHB program administration
The roles of NIHB headquarters include:
- program policy development and determination of eligible benefits
- development and maintenance of the HICPS system and other national systems such as the Medical Transportation Reporting System (MTRS)
- claims verification and provider negotiations
- data analysis and reporting
- adjudicating benefit requests through the NIHB Drug Exception Centre and the Dental Predetermination Centre
- providing expert advice through the MS&E Review Centre
- producing national program communications for NIHB clients and providers and
- maintaining relationships with partner organizations at the national level as well as with other federal departments and agencies.
The roles of NIHB regional offices include:
- adjudicating benefit requests for medical transportation, mental health counselling, vision care and medical supplies and equipment
- coordinating medical transportation arrangements such as flights and accommodations
- maintaining relationships with partner organizations at the provincial/territorial level as well as with provincial/territorial officials
- managing contribution agreements (CA) and certain contracts
- managing travelling provider arrangements.
Non-insured health benefits administration costs (thousands of dollars): 2022 to 2023
Table 11.1 outlines program administration expenditures by region as well as NIHB headquarters (HQ) costs. In 2022 to 2023, total NIHB administration costs were $74.0 million representing an increase of 5.8% over the previous fiscal year.
Claims processing contract costs are related to the administration of pharmacy, medical supplies and equipment, dental benefits, mental health counselling and vision care benefits through the Health Information and Claims Processing Services (HICPS) system.
Claims processing costs are also addressed in the individual benefit sections of this report.
| Categories | Atlantic | Quebec | Ontario | Manitoba | Saskatchewan | Alberta | North | HQ | Total |
|---|---|---|---|---|---|---|---|---|---|
| Salaries | $1,716 | $2,186 | $5,066 | $4,483 | $4,076 | $4,068 | $1,601 | $19,693 | $42,890 |
| EBP | $463 | $588 | $1,360 | $1,210 | $1,101 | $1,089 | $432 | $5,302 | $11,545 |
| Operating | $77 | $26 | $51 | $57 | $92 | $55 | $52 | $2,500 | $2,909 |
| Subtotal | $2,255 | $2,800 | $6,477 | $5,751 | $5,269 | $5,212 | $2,085 | $27,495 | $57,344 |
| Claims processing contract costs | $16,619 | ||||||||
| Total administration costs | $73,962 | ||||||||
| Source: FST adapted by Program Analytics and Risk Mitigation | |||||||||
Non-Insured Health Benefits administration costs as a proportion of benefit expenditures ($ Millions)
In 2022 to 2023, total NIHB benefit expenditures were $1,891.7 million, of which direct benefit expenditures totaled $1,875.1 million and expenditures for claims processing administration amounted to $16.6 million. An additional $57.3 million was spent on salaries and operating costs associated with program administration. Some administrative costs paid within contribution agreements are not captured in these data.
Total NIHB program administration costs ($74.0 million, including claims processing and other program administration) as a proportion of direct benefit expenditures ($1.9 billion), was 3.9% in 2022 to 2023. Over the past five fiscal years, the percentage of NIHB program administration costs as a proportion of total benefit expenditures has ranged from a high of 5.1% in 2019 to 2020 to a low of 3.9% in 2022 to 2023.
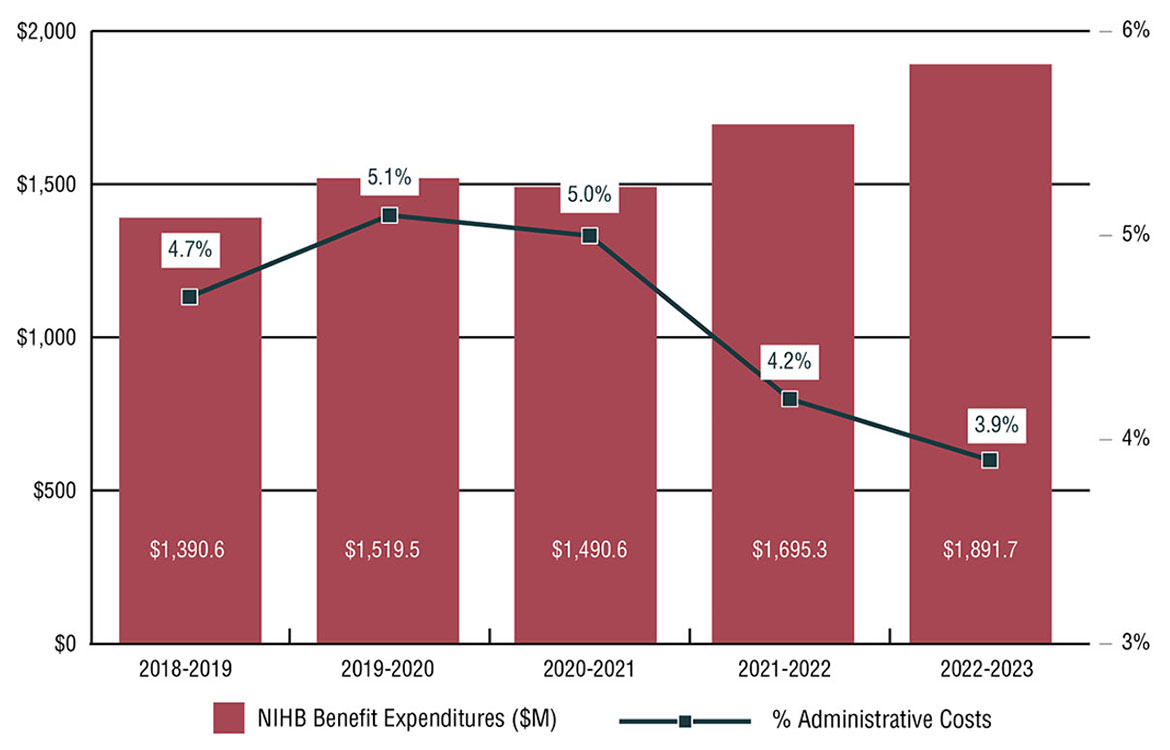
Source: FST and FIRMS, adapted by Program Analytics and Risk Mitigation
Text alternative for Figure 11.1: Non-Insured Health Benefits administration costs as a proportion of benefit expenditures ($ Millions)
This image is a bar graph which visually describes NIHB program expenditures and the percentage of which are administrative costs, as follows:
| Fiscal year | NIHB benefit expenditures ($M) | % Administrative costs |
|---|---|---|
| 2018 to 2019 | $1,390.2 | 4.7% |
| 2019 to 2020 | $1,519.5 | 5.1% |
| 2020 to 2021 | $1,490.6 | 5.0% |
| 2021 to 2022 | $1,695.3 | 4.2% |
| 2022 to 2023 | $1,891.7 | 3.9% |
Health Information and Claims Processing Services (HICPS): 2022 to 2023
Claims for NIHB pharmacy, dental, MS&E, as well as most mental health counselling and vision care benefits provided to eligible First Nations and Inuit clients are processed via the Health Information and Claims Processing Services (HICPS) system. HICPS includes administrative services and programs, technical support and automated information management systems used to process and pay claims in accordance with NIHB program client/benefit eligibility and pricing policies.
Since 1990, the NIHB program has retained the services of a private sector contractor to administer the following core claims processing services on its behalf:
- claim processing and payment operations
- claim adjudication and reporting systems development and maintenance
- provider registration and communications
- provider audit programs and audit recoveries and
- standard and ad hoc reporting.
The current HICPS contract is with Express Scripts Canada. This contract came into force on June 28, 2020, following a competitive contracting process led by Public Services and Procurement Canada (PSPC). The NIHB program manages the HICPS contract as the project authority in conjunction with PSPC, the contract authority.
Number of active providers registered in the Health Information and Claims Processing Services (HICPS) system: 2022 to 2023
Benefit providers can register with Express Scripts Canada to provide benefits to NIHB clients and bill the program directly. An active provider refers to a provider who has submitted at least one claim in the 24 months prior to March 31, 2023.
As of March 31, 2023, there were 42,337 active pharmacy, dental, MS&E, mental health counselling and vision care providers registered with the HICPS claims processor to deliver NIHB benefits. The number of active providers by region and by benefit is outlined in the table below.
| Region | Pharmacy | MS&E | Dental | Vision | Mental Health |
|---|---|---|---|---|---|
| Atlantic | 873 | 375 | 1,312 | 515 | 473 |
| Quebec | 2,043 | 245 | 3,363 | 937 | 416 |
| Ontario | 4,559 | 884 | 8,451 | 1,668 | 1,468 |
| Manitoba | 504 | 99 | 1,230 | 199 | 268 |
| Saskatchewan | 481 | 171 | 906 | 312 | 428 |
| Alberta | 1,806 | 375 | 3,978 | 1,026 | 528 |
| British Columbia | 998 | 47 | 796 | 63 | 7 |
| North | 31 | 27 | 414 | 21 | 40 |
| Total | 11,295 | 2,223 | 20,450 | 4,741 | 3,628 |
| Source: HICPS adapted by Program Analytics and Risk Mitigation | |||||
Number of claim lines settled through the Health Information and Claims Processing Services (HICPS) system: 2022 to 2023
Table 11.3 sets out the total number of pharmacy, dental, MS&E, mental health counselling and vision care claims settled through the HICPS system in fiscal year 2022 to 2023. During this period, more than 32 million claim lines were processed through HICPS. Ontario had the highest volume of total claims processed at 8.3 million, followed by Manitoba at 6.0 million and Saskatchewan at 5.6 million.
Claim Lines vs. Prescriptions or Visits
It is important to note that the program reports annually on claim lines. This is an administrative unit of measure as opposed to a health care unit of measure. A claim line represents a transaction in the claims processing system and is not equivalent to a prescription or health practitioner visit. Prescriptions can contain a number of different drugs with each one represented by a separate claim line. Prescriptions for a number of drugs may be repeated and refilled many times throughout the year. In the case of repeating prescriptions, each time a prescription is refilled, the system will log another transaction (claim line). Therefore, it is possible for an individual who has a prescription that repeats multiple times in a year to have numerous related claim lines associated with the single prescription. Likewise, an appointment with a medical practitioner may results in multiple claim lines as several procedures are performed at the same time.
Mental health counselling services for clients in Nunavut and the Northwest Territories are funded via contribution agreements, as such, claim lines are not captured in the HICPS system.
| Region | Pharmacy | Dental | MS&E | Mental Health | Vision Care | Total |
|---|---|---|---|---|---|---|
| Atlantic | 1,880,350 | 196,601 | 57,644 | 33,104 | 32,562 | 2,200,261 |
| Quebec | 3,579,067 | 242,161 | 50,037 | 18,871 | 20,546 | 3,910,682 |
| Ontario | 7,323,342 | 728,794 | 75,142 | 153,639 | 49,961 | 8,330,878 |
| Manitoba | 5,227,748 | 592,057 | 127,189 | 34,881 | 38,285 | 6,020,160 |
| Saskatchewan | 4,635,487 | 695,599 | 134,746 | 70,882 | 64,328 | 5,601,042 |
| Alberta | 3,926,806 | 653,594 | 85,445 | 63,453 | 61,001 | 4,790,299 |
| British Columbia | 202,460 | 38,599 | 3,008 | 230 | 364 | 244,661 |
| North | 1,084,845 | 275,565 | 44,965 | 3,152 | 9,918 | 1,418,445 |
| Total Claim Lines | 27,860,105 | 3,422,970 | 578,176 | 378,212 | 276,965 | 32,516,428 |
| Source: HICPS adapted by Program Analytics and Risk Mitigation | ||||||
Claims verification activities: 2022 to 2023
As part of risk management activities for the NIHB program, Indigenous Services Canada has mandated its claims processor to maintain a set of pre-payment and post-payment processes, including claims verification activities.
During 2022 to 2023, the claims processor carried out claims verifications as directed by the NIHB program. The verifications address the need of the NIHB program to comply with accountability requirements for the use of public funds and to ensure provider compliance with the terms and conditions of the program as outlined in the appropriate NIHB Benefit Guide, Claims Submission Kit, Provider Billing Agreement and other relevant documents.
There are five components within claims verification activities for the pharmacy, medical supplies and equipment, dental benefit, vision care, and mental health counselling areas. These are:
- Daily Claim Verification Program, which consists of a review of a defined sample of claims submitted by providers the day following receipt by the claims processor.
- Client Confirmation Program, which consists of a monthly mail-out to NIHB clients to confirm the receipt of services that have been paid on their behalf.
- On-Site Claim Verification Program, which consists of the selection of a sample of claims for administrative validation against a provider's records through an on-site visit.
- Desk Claim Verification Program, which consists of the selection of a sample of claims for administrative validation against a provider's records and conducted at a distance.
- Financial Recovery Program, which consists of a focused recovery assessment.
The following figures identify the number of initiated verifications and recoveries from components of the on-site, desk and financial verification processes during the 2022 to 2023 fiscal year.
Completion of the claim verification process often spans more than one fiscal year. Although the complete recovery for any verification may overlap into another fiscal year, recoveries from claims verification activities are recorded in the fiscal year in which they are received. Subsequent appeals to reversals may result in claim payment if confirmed services are in compliance with the terms and conditions of the NIHB Program.
| Region | Pharmacy Recoveries | Dental Recoveries | MS&E Recoveries | Mental Health Counselling Recoveries | Vision Care Recoveries |
|---|---|---|---|---|---|
| Atlantic | $1,630 | $0 | $0 | $0 | $0 |
| Quebec | $0 | $0 | $0 | $0 | $0 |
| Ontario | $875 | $10,177 | $0 | $71,342 | $0 |
| Manitoba | $3,461 | $14,987 | $0 | $26,058 | $899 |
| Saskatchewan | $19,772 | $37,942 | $0 | $262,639 | $3,255 |
| Alberta | $19,137 | $38,797 | $3,431 | $68,190 | $0 |
| British Columbia | $0 | $317 | $0 | $0 | $0 |
| Yukon | $0 | $0 | $0 | $0 | $0 |
| N.W.T. | $2,834 | $0 | $0 | $0 | $0 |
| Nunavut | $11,766 | $0 | $0 | $0 | $0 |
| Total | $59,476 | $102,221 | $3,431 | $428,228 | $4,154 |
| Source: Express Scripts Canada adapted by Program Analytics and Risk Mitigation | |||||
Section 12: NIHB policy and program initiatives
NIHB Drug benefit listing and review
The NIHB Drug Benefits List (DBL) is a listing of all of the drugs provided as benefits by the NIHB program. Drugs considered for, or currently listed on, the DBL must meet established criteria. For example, they must be legally available for sale in Canada with a Notice of Compliance (NOC) and Drug Identification Number (DIN) or Natural Product Number (NPN), and be dispensed in a pharmacy. The drugs must also demonstrate evidence of therapeutic efficacy, safety, and incremental benefit in proportion to incremental cost.
The review process for drug products that are considered for inclusion as a benefit under the NIHB program varies depending on the type of drug submitted. Submissions for new chemical entities, new combination drug products and existing chemical entities with new indications, must be sent to the Canadian Agency for Drugs and Technologies in Health (CADTH), an independent organization that provides research and information about the effectiveness of drugs and other medical treatments.
Through the Common Drug Review (CDR) and pan-Canadian Oncology Drug Review (pCODR) processes, CADTH conducts objective evaluations of the clinical, economic, and patient evidence on drugs and medical technologies. Based on this information, the CADTH expert committees provide coverage recommendations and advice to Canada's public drug plans, including the NIHB program. The CDR and pCODR were established by federal, provincial and territorial public drug plans to reduce duplication of effort in reviewing drug submissions, to maximize the use of resources and expertise, and to enhance the consistency and quality of drug reviews.
NIHB Drugs and Therapeutics Advisory Committee (DTAC)
The NIHB DTAC is an advisory body of highly qualified health professionals who bring impartial and practical expert medical and pharmaceutical advice to the NIHB program to promote improvement in the health outcomes of First Nations and Inuit clients through effective use of pharmaceuticals. The approach is evidence-based and the advice reflects medical and scientific knowledge, current utilization trends, current clinical practice, health care delivery and client healthcare needs.
More information on DTAC and its members can be found at Drugs and Therapeutics Advisory Committee.
NIHB Oral Health Advisory Committee (NOHAC)
The NIHB Oral Health Advisory Committee (NOHAC) is an independent advisory body of highly qualified oral health professionals and academic specialists. They bring impartial and practical expert views, advice, and recommendations to the NIHB program to support the improvement of oral health outcomes for First Nations and Inuit clients. The advice and recommendations provided by the Committee follow an evidence-based approach and reflect scientific knowledge, as well as clinical and oral health care delivery and disease prevention best practices.
More information on NOHAC and its members can be found at The Non-Insured Health Benefits (NIHB) Oral Health Advisory Committee.
NIHB Medical Supplies and Equipment Advisory Committee (MSEAC)
The NIHB MSEAC is a multidisciplinary advisory committee of highly qualified health professionals and academic specialists who bring evidence-informed impartial and practical expert advice and recommendations to the NIHB program regarding both medical supplies and equipment and vision care benefits. The approach reflects medical and scientific knowledge, current utilization trends, current clinical practice, health care delivery and client healthcare needs and is intended to promote improvement in the health outcomes of First Nations and Inuit clients.
Drug Exception Centre (DEC)
The Drug Exception Centre is a call centre that provides efficient responses to all requests for drugs that are not on the NIHB Drug Benefit List or require prior approval, for extemporaneous mixtures containing exception or Limited Use (LU) drugs, for prescriptions on which prescribers have indicated "no substitution," and for claims that exceed $1,999.99.
The DEC also supports the implementation of the Problematic Substance Use Strategy to address and prevent potential misuse of prescription drugs. The program has set limits on medications of concern, and developed a structured approach towards client safety which includes the implementation of the Client Safety Program across the country.
Dental Predetermination Centre
The Dental Predetermination Centre (DPC) is a call centre that provides efficient adjudication of all dental and orthodontic predetermination requests, post-determination requests and appeals. In addition, the DPC is responsible for addressing client and provider inquiries, and for assisting clients and providers with the submission of the predetermination, post-determination, client reimbursement and appeal requests.
Medical Supplies and Equipment Review Centre
NIHB staff at the regional level manage prior approval of medical supplies and equipment benefit requests, with support from the MS&E Review Centre (MSERC) at the NIHB national office. The MSERC is staffed in-house by various health professionals, including registered nurses. In cases where advice is required by a particular specialist, such as an audiologist or an orthotist, information is forwarded to the appropriate specialist consultant for review. Consultants make their recommendations based upon the current standards of practice, best practices, current scientific evidence, program policy and recommended guidelines within their field of specialty.
Client and provider communications
NIHB is continually seeking ways to improve communications with clients, providers and partners regarding benefit coverage and administration.
The NIHB program regularly produces newsletters and updates to inform clients and providers about any changes to NIHB policy and benefit coverage. For example, NIHB enrolled providers for dental, pharmacy, MS&E, vision care and mental health counselling receive notification of policy updates and relevant information regarding benefits through regular provider newsletters, periodic bulletins and broadcast messages.
These communications are distributed to enrolled providers by Express Scripts Canada (ESC), Indigenous Services Canada's claims processing contractor, and are available via the Express Scripts Canada website.
The Government of Canada website is a key venue for sharing NIHB program information to clients. NIHB program updates are produced quarterly and as needed to provide information for clients regarding changes to benefit coverage. They can be found on the website Non-Insured Health Benefits program updates. Clients can subscribe to receive email notifications when these updates are published, and those who have set up web accounts through Express Scripts Canada also receive notification of new updates. Client-focused communications are also promoted through social media on the Government of Canada's Healthy First Nations and Inuit Facebook Page and GCIndigenous X (Twitter) account. Additional social media posts promote client awareness of benefit coverage, often in conjunction with broader public health promotion campaigns. For example, a post on diabetes awareness will include a reminder about NIHB coverage of diabetes medications and supplies, and a post on vision health may include a reminder about NIHB coverage of eye exams.
NIHB strives to be accessible and responsive to clients. Clients can contact NIHB directly by calling Indigenous Services Canada regional offices, the NIHB Dental Predetermination Centre, or the NIHB Drug Exception Centre. The "Contact Us" web page for the NIHB program also provides an email address for direct inquiries to the NIHB program.
NIHB Navigators
NIHB Navigators help eligible clients to navigate and access the NIHB program. They are a resource for communities, organizations or individuals who need support or information on NIHB-related issues. Navigators are employed by regional First Nations and Inuit organizations. Their roles and activities are adapted to meet regional needs, and generally include the following:
- increase understanding of the NIHB program and share information on eligible benefits
- help clients and communities to resolve NIHB-related issues
- link with health departments and agencies to help improve client access to NIHB benefits and related health services.
NIHB program representatives engage regularly with Navigators and support them in their work by sharing Program information, responding to inquiries, and assisting with client cases. Navigators also provide valuable support to the program by sharing their insight on client experiences, and working collaboratively to improve client-focused service.
Collaboration with First Nations and Inuit partners
Indigenous Services Canada (ISC) is engaged in a multi-year Joint Review of the NIHB program in partnership with the Assembly of First Nations (AFN). The overall objectives of the review are to identify and implement actions that enhance client access to benefits, identify gaps in benefits, streamline service delivery to be more responsive to client needs, and increase program efficiencies. The AFN conducted a robust program of client, provider and stakeholder engagement activities to gather broad input and perspectives that will inform recommendations for program improvements. The Joint Review is guided by a Steering Committee comprised of First Nations and ISC representatives.
As of March 31, 2022, joint reviews of the mental health counselling, dental, vision care, pharmacy and medical supplies and equipment benefits are complete, and the review of the medical transportation benefit is in progress. Meanwhile, the NIHB Program continues to implement many improvements to benefit coverage and administration. More information on the Joint Review, including highlights of changes and improvements made by NIHB throughout the process, can be found at Non-insured Health Benefits program joint review.
Indigenous Services Canada continues to work with the Inuit Tapiriit Kanatami (ITK) to improve the quality, access, and delivery of NIHB benefits to Inuit clients. NIHB and ITK representatives meet regularly to discuss issues of concern, and identify opportunities for improvement. In January 2023, NIHB and ITK established a new engagement table including representatives of the National Inuit Committee on Health to discuss priorities and concerns for Inuit NIHB clients. NIHB shares information and updates Inuit partners regularly on progress made to advance priorities identified by Inuit partners.
Section 13: Technical notes
Information contained in the 2022 to 2023 NIHB Annual Report has been extracted from several databases. All tables and charts are footnoted with the appropriate data sources. These data sources are considered to be of very high quality but, as in any administrative data set, some data may be subject to coding errors or other anomalies. For this reason, users of the data should always refer to the most current edition of the NIHB Annual Report. Please note that some table totals may not add due to rounding procedures.
To address reporting challenges related to NIHB clients registered to British Columbia bands but living elsewhere, and Inuit clients living in BC, select financial and utilization data relating to the British Columbia Region have been suppressed. National totals, however, include these values.
To address reporting challenges related to the small number of NIHB clients choosing a non-binary gender designation at this time and in respect of departmental privacy obligations, population and utilization data relating to these individuals at the provincial/territorial level have been suppressed. National totals, however, include these values. As such, the sum of the provincial/territorial totals will not match the national total.
Starting in 2020 to 2021, expenditures for the NIHB MS&E benefit are being reported separately from NIHB pharmacy benefit expenditures. As such, historical values reported for NIHB pharmacy will not match those reported in previous editions as those values included MS&E.
Population data
First Nations and Inuit population data are drawn from the Status Verification System (SVS) which is operated by NIHB. SVS data on First Nations clients are based on information provided by the Registrar's office of Indigenous Services Canada (ISC). SVS data on Inuit clients are based on information provided by the Governments of the Northwest Territories and Nunavut, and Inuit land claim organizations including the Inuvialuit Regional Corporation, Nunavut Tunngavik Incorporated and the Makivik Corporation.
Pharmacy, MS&E, dental, mental health counselling and vision care data
Two Indigenous Services Canada data systems provide information on the expenditures and utilization of the NIHB pharmacy, MS&E, dental, mental health counselling and vision care benefits. Financial Services and Training (FST) is the source of most of the expenditures data, while the Health Information and Claims Processing Services (HICPS) system provides detailed information on utilization. Expenditure data prior to fiscal year 2019 to 2020 were collected from the Framework for Integrated Resource Management System (FIRMS).
Medical transportation data
Medical transportation financial data are provided through FST. Medical transportation data are also collected regionally through other electronic systems. Operational data at the regional level are tracked through the Medical Transportation Reporting System (MTRS). Contribution agreement data are also collected, but in a limited manner. In some communities, MTRS is used to collect contribution agreement data, while other communities report data using spreadsheet templates, in-house data management systems, or through paper reports.
The Medical Transportation Data Store (MTDS) serves as a repository for selected operational data, as well as the data collected from medical transportation contribution agreements, and ambulance data systems. The objective of the MTDS is to enable aggregate reporting on medical transportation at a national level in order to further strengthen program management, provide enhanced data analysis and reporting and aid in decision making.