An update on the socio-economic gaps between Indigenous Peoples and the non-Indigenous population in Canada: Highlights from the 2021 Census
A Compendium Report to the Department's 2023 Annual Report to Parliament.
Table of contents
- Executive summary
- Introduction
- Method
- Findings
- Income – Median individual income
- Low-income measure after tax
- Employment rate
- Employment income
- Education – having at least a high school credential
- Education – completion of a university degree
- Housing – Crowding
- Housing – Dwellings in need of major repair
- Children in foster care
- Indigenous language knowledge
- Justice – Incarceration
- A focus on urban settings
- Conclusions
- Appendix A
- Appendix B
List of tables
- Table 1: Comparison of the gap in median income 2015 to 2020 (adjusted), Indigenous and non-Indigenous populations, aged 25 to 64, Canada
- Table 2: Comparison of the gap in median individual income, 2015 to 2020, Indigenous and non-Indigenous populations, aged 25 to 64, by gender, Canada (Five-Year Change)
- Table 3: Number of people living in a low-income situation, 2015 to 2020, Indigenous and non-Indigenous populations, Canada
- Table 4: Comparison of the gap in the percentage living in a low-income situation 2015 to 2020, Indigenous and non-Indigenous populations, Canada
- Table 5: Comparison of the gap in percentage living in a low–income situation 2015 to 2020, Indigenous and non-Indigenous populations, by gender, Canada (Five-Year Change)
- Table 6: Number of individuals employed, 2016 to 2021, Indigenous and non-Indigenous populations aged 25 to 64, Canada
- Table 7: Comparison of the gap in employment rate 2016 to 2021, Indigenous and non-Indigenous populations, aged 25 to 64, Canada
- Table 8: Comparison of the gap in employment rate 2016 to 2021, Indigenous and non-Indigenous populations, aged 25 to 64, by gender, Canada (Five-Year Change)
- Table 9: Comparison of median employment income (adjusted) 2015 to 2020, Indigenous and non-Indigenous populations, aged 25 to 64, Canada
- Table 10: Comparison of median employment income 2015 to 2020, Indigenous and non-Indigenous Populations, aged 25 to 64, by gender, Canada (Five-Year Change)
- Table 11: Number of people with at least a high school credential, 2016 to 2021, Indigenous and non-Indigenous populations, aged 25 to 64, Canada
- Table 12: Comparison of the percentage of people with at least a high school credential 2016 to 2021, Indigenous and non-Indigenous populations, aged 25 to 64, Canada
- Table 13: Comparison of the gap in the percentage of pepole with at least a high school credential 2016 to 2021, Indigenous and non-Indigenous populations, aged 25 to 64, by gender, Canada (Five-Year Change)
- Table 14: Number of people with a university degree, 2016 to 2021, Indigenous and non-Indigenous populations, aged 25 to 64, Canada
- Table 15: Comparison of the gap in the percentage of people with a university degree 2016 to 2021, Indigenous and non-Indigenous populations, aged 25 to 64, Canada
- Table 16: Comparison of the percentage with a university degree 2016 to 2021, Indigenous and non-Indigenous populations, aged 25 to 64, by gender, Canada (Five-Year Change)
- Table 17: Number of households residing in a dwelling classified as crowded, 2016 to 2021, Indigenous and non-Indigenous populations, Canada
- Table 18: Comparison of the percentage of dwellings classified as crowded 2016 to 2021, Indigenous and non-Indigenous populations, Canada
- Table 19: Number of households residing in dwellings in need of major repair, 2016 to 2021, Indigenous and non-Indigenous populations, Canada
- Table 20: Comparison of the percentage of dwellings in need of major repair 2016 to 2021, Indigenous and non-Indigenous populations, Canada
- Table 21: Number of Indigenous and non-Indigenous children comprising the total population of children aged 0 to 17 in foster care, 2016 to 2021, Canada
- Table 22: Comparison of the percentage of children aged 0 to 17 in foster care, 2016 to 2021, Indigenous and non-Indigenous populations, Canada
- Table 23: Number of Indigenous and non-Indigenous people capable of holding a conversation in an Indigenous language, 2016 to 2021, Canada
- Table 24: Number of custody admissions of individuals with Indigenous and non-Indigenous identity, 2016 to 2017 to 2020 to 2021, Canada
- Table 25: Comparison of the employment rate, 2016 to 2021, Indigenous and non-Indigenous populations, aged 25 to 64, urban areas, Canada
- Table 26: Summary of the size and direction of the change in gap between Indigenous and non-Indigenous populations from 2016 to 2021 for all domains, Canada
List of figures
- Figure 1: Distribution and number of Indigenous people in Canada by province and territory, 2021
- Figure 2: Composition of the Indigenous population in Canada by province and territory, 2021
- Figure 3: Median individual income, 2020, Indigenous and non-Indigenous populations, aged 25 to 64, Canada
- Figure 4: Median individual income 2005 to 2020 (adjusted), Indigenous and non-Indigenous populations, aged 25 to 64, Canada
- Figure 5: Median individual income, 2020, First Nations and non-Indigenous populations, aged 25 to 64, by region
- Figure 6: Median individual income, 2020, Métis and non-Indigenous populations, aged 25 to 64, by region
- Figure 7: Median individual income, 2020, Inuit and non-Indigenous populations, aged 25 to 64, by Inuit region
- Figure 8: Median individual income, 2020, Indigenous and non-Indigenous populations, aged 25 to 64, by gender, Canada
- Figure 9: Percentage living in a low-income situation, 2020, Indigenous and non-Indigenous populations, Canada
- Figure 10: Percentage living in a low-income situation, 2005 to 2020, Indigenous and non-Indigenous populations, Canada
- Figure 11: Percentage living in a low-income situation, 2020, First Nations and non-Indigenous populations, by region
- Figure 12: Percentage living in a low-income situation, 2020, Métis and non-Indigenous populations, by region
- Figure 13: Percentage living in a low-income situation, 2020, Inuit and non-Indigenous populations, by Inuit region
- Figure 14: Percentage living in a low-income situation, 2020, Indigenous and non-Indigenous populations, by gender, Canada
- Figure 15: Employment rate, 2021, Indigenous and non-Indigenous populations, aged 25 to 64, Canada
- Figure 16: Employment rate, 2001 to 2021, Indigenous and non-Indigenous populations, aged 25 to 64, Canada
- Figure 17: Employment rate, 2021, First Nations and non-Indigenous populations, aged 25 to 64, by region
- Figure 18: Employment rate, 2021, Métis and non-Indigenous populations, aged 25 to 64, by region
- Figure 19: Employment rate, 2021, Inuit and non-Indigenous populations, aged 25 to 64, by Inuit region
- Figure 20: Employment rate, 2021, Indigenous and non-Indigenous populations, aged 25 to 64, by gender, Canada
- Figure 21: Median employment income, 2020, Indigenous and non-Indigenous populations, aged 25 to 64, Canada
- Figure 22: Median employment income, 2005 to 2020 (adjusted), Indigenous and non-Indigenous populations, aged 25 to 64, Canada
- Figure 23: Median employment income, 2020, First Nations and non-Indigenous populations, aged 25 to 64, by region
- Figure 24: Median employment income, 2020, Métis and non-Indigenous populations, aged 25 to 64, by region
- Figure 25: Median employment income, 2020, Inuit and non-Indigenous populations, aged 25 to 64, by Inuit region
- Figure 26: Median employment income, 2020, Indigenous and non-Indigenous populations, aged 25 to 64, by gender, Canada
- Figure 27: Percentage of people with at least a high school credential, 2021, Indigenous and non-Indigenous populations, aged 25 to 64, Canada
- Figure 28: Gap in high school completion (in percentage points) between Indigenous and non-Indigenous populations, aged 18 to 24, 25 to 34, 35+ and 25 to 64, 2021, Canada
- Figure 29: Percentage of people with at least a high school credential, 2001 to 2021, Indigenous and non-Indigenous populations, aged 25 to 64, Canada
- Figure 30: Percentage of people with at least a high school credential, 2021, First Nations and non-Indigenous populations, aged 25 to 64, by region
- Figure 31: Percentage of people with at least a high school credential, 2021, Métis and non-Indigenous populations, aged 25 to 64, by region
- Figure 32: Percentage with at least a high school credential, 2021, Inuit and non-Indigenous populations, aged 25 to 64, by Inuit region
- Figure 33: Percentage of people with at least a high school credential, 2021, Indigenous and non-Indigenous populations, aged 25 to 64, by gender, Canada
- Figure 34: Percentage of people with a university degree, 2021, Indigenous and non-Indigenous populations, aged 25 to 64, Canada
- Figure 35: Gap in university completion (in percentage points) between Indigenous and non-Indigenous populations, aged 25 to 34 and 25 to 64, 2021, Canada
- Figure 36: Percentage of people with a university degree, 2001 to 2021, Indigenous and non-Indigenous populations, aged 25 to 64, Canada
- Figure 37: Percentage of people with a university degree, 2021, First Nations and non-Indigenous populations, aged 25 to 64, by region
- Figure 38: Percentage of people with a university degree, 2021, Métis and non-Indigenous populations, aged 25 to 64, by region
- Figure 39: Percentage of people with a university degree, 2021, Inuit and non-Indigenous populations, aged 25 to 64, by region
- Figure 40: Percentage of people with a university degree, 2021, Indigenous and non-Indigenous populations, aged 25 to 64, by gender, Canada
- Figure 41: Percentage of dwellings classified as crowded, 2021, Indigenous and non-Indigenous populations, Canada
- Figure 42: Percentage of dwellings classified as crowded, 2001 to 2021, Indigenous and non-Indigenous populations, Canada
- Figure 43: Percentage of dwellings classified as crowded, 2021, First Nations and non-Indigenous populations, by region
- Figure 44: Percentage of dwellings classified as crowded, 2021, Métis and non-Indigenous populations, by region
- Figure 45: Percentage of dwellings classified as crowded, 2021, Inuit and non-Indigenous populations, by region
- Figure 46: Percentage of dwellings in need of major repair, 2021, Indigenous and non-Indigenous populations, Canada
- Figure 47: Percentage of dwellings in need of major repair, 2001 to 2021, Indigenous and non-Indigenous populations, Canada
- Figure 48: Percentage of dwellings in need of major repair, 2021, First Nations and non-Indigenous populations, by region
- Figure 49: Percentage of dwellings in need of major repair, 2021, Métis and non-Indigenous populations, by region
- Figure 50: Percentage of dwellings in need of major repair, 2021, Inuit and non-Indigenous populations, by Inuit region
- Figure 51: Percentage of Indigenous and non-Indigenous children comprising the total population of children aged 0 to 17 in foster care, 2021, Canada
- Figure 52: Percentage of children aged 0 to 17 in foster care, 2021, Indigenous and non-Indigenous populations, Canada
- Figure 53: Percentage of children aged 0 to 17 in foster care, 2011 to 2021, Indigenous and non-Indigenous populations, Canada
- Figure 54: Percentage of children aged 0 to 17 in foster care, 2021, First Nations and non-Indigenous populations, by region
- Figure 55: Percentage of children aged 0 to 17 in foster care, 2021, Métis and non-Indigenous populations, by region
- Figure 56: Percentage of Indigenous populations with knowledge of an Indigenous language, 2021, Canada
- Figure 57: Percentage of Indigenous populations with knowledge of an Indigenous language, 2001 to 2021, Canada
- Figure 58: Percentage of First Nations with knowledge of an Indigenous language, 2021, by region
- Figure 59: Percentage of Métis with knowledge of an Indigenous language, 2021, by region
- Figure 60: Percentage of Inuit with knowledge of an Indigenous language, 2021, by region
- Figure 61: Percentage of Indigenous populations with knowledge of an Indigenous language, 2021, by gender, Canada
- Figure 62: Percentage of Indigenous populations with knowledge of an Indigenous language, 2021, aged 0 to 19 and aged 20+, Canada
- Figure 63: Custody admissions associated with Indigenous and non-Indigenous people in 2021 to 2022 as a percentage of their respective 2021 Census populations, Canada
- Figure 64: Percentage of custody admissions of individuals with Indigenous and non-Indigenous identity, 2016 to 2017 to 2020 to 2021, Canada
- Figure 65: Comparison of total and urban employment rates, 2021, Indigenous and non-Indigenous populations, aged 25 to 64, Canada
Executive summary
Keywords: Indigenous Peoples, First Nations, Inuit, Métis, income, employment, family, culture, Indigenous languages, housing, foster care, justice, incarceration.
This report serves as a compendium to the Department's Annual Report to Parliament and provides an update on the 2020 report using data from the 2021 census cycle. It provides a broad overview of the socio-economic gaps between First Nations, Inuit and Métis populations and the non-Indigenous population in Canada. It covers a wide range of social and economic variables that can be linked primarily to data collected as part of the Census of Population. It highlights not only the gaps that exist today, but also the evolution of those gaps over time. The report also acknowledges that while progress has been made, much work remains to address the ongoing challenges faced by Indigenous Peoples and communities and to advance meaningful reconciliation.
In Canada, the Census of Population is conducted every five years. In 2022, data from the 2021 Census of Population were made available. This report focuses on a subset of these data and examines indicators related to income, employment, education, housing, foster care and Indigenous languages. Indicators related to incarceration are also examined using data from the most recent Adult Correctional Services Survey. As new data on the health domains included in the 2020 report have yet to be published, the health indicators are excluded from this report.
Indigenous Peoples in Canada face significant and long-standing socio-economic gaps when compared to the non-Indigenous population. These gaps have been shaped by a long history of colonialism, discrimination and marginalization, which have had a profound impact on Indigenous people and continue to affect their lives today. Although gaps remain, significant work is being done to narrow them and improve conditions. Continued measurement of these socio-economic gaps is important as it helps determine whether progress is being made over time. It can also help demonstrate whether existing programs and policies are properly designed and resourced. Lastly, it can help ensure accountability of those who design and implement programs, policies and calls for reflection to clearly and transparently define what progress means.
Overall, median individual income was higher in 2020Footnote 1 than in 2015 for all Indigenous groups, even after accounting for inflation. Although a similar proportion of individuals were employed compared to 2016, those who were employed made more, bringing home an additional $800 to $4,200 a year in income after adjusting for inflation. Increased income means fewer low-income households. Between the non-Indigenous population and each of the Indigenous groups, there was a clear narrowing of gaps, by 31.8 to 46.5%. The total number of Indigenous people living in a low-income situation dropped from 471,560 in 2015 to 335,560 in 2020. Overall, 136,000 fewer Indigenous people (60,190 Registered Indians living on reserve, 45,030 Registered Indians living off reserve, 8,975 Non-Status Indians, 2,840 Inuit and 18,965 Métis) were living in a low-income situation over 2015. In addition to contextualizing the historic implications of the pandemic on the socio-economic well-being of all Canadians, Census 2026 will be important to determine whether there have been lasting changes in these gaps beyond the availability of government benefits during the COVID-19 pandemic.
Improving Indigenous education is a crucial step towards closing the socio-economic gaps and achieving substantive equality in recognizing that additional service supports may be required to enable Indigenous children to achieve equal outcomes. Among those 25 to 64 years of age with at least a high school education, a small narrowing of the gaps was observed for Registered Indians living off reserve and Non-Status Indians, while a large narrowing of the gap was seen for Métis. In total, there were 80,280 more Indigenous people with a high school education in 2021 (925 Registered Indians living on reserve, 26,150 Registered Indians living off reserve, 25,545 Non-Status Indians, 1,730 Inuit and 25,930 Métis). Increases in high school completion are important as it often represents a critical step to employment and higher education. From 2016 to 2021, there was a widening of the gap for all Indigenous groups in the proportion of the population with a university degree. Although an additional 47,980 Indigenous people (4,985 Registered Indians living on reserve, 14,630 Registered Indians living off reserve, 9,200 Non-Status Indians, 890 Inuit and 18,275 Métis) obtained a university education over 2016, the non-Indigenous population saw greater gains in university completion during the same time period.
Housing quality and conditions generally improved for Indigenous people from 2016 to 2021; however, the narrowing of the gap in the proportion of dwellings that were crowded was due in part to increases in crowding for the non-Indigenous population. Overall, the total number of Indigenous households experiencing crowding was relatively flat from 2016 (25,220 dwellings) to 2021 (25,345 dwellings). Both Métis and Non-Status Indians had lower proportions of crowded dwellings than the non-Indigenous population in 2016 and 2021. There were also substantial improvements in the proportion of dwellings requiring major repairs. From 2016 to 2021, there were 3,715 fewer dwellings associated with Indigenous people that required major repairs.
Indigenous children continue to be overrepresented in foster care. The census data collection method identifies only children in foster care who reside in a private home. It excludes those in institutions, group homes or other care arrangements. The proportion of Registered Indians, Non-Status Indians and Métis children in foster care remained fairly stable over the period. There was an increase of almost one percentage point for Inuit children. In total, there were 17,410 Indigenous children in foster care in 2016 compared to 17,320 in 2021.
In addition to the socio-economic gaps, the declines in Indigenous language knowledge are noteworthy. In 2021, there were over 70 Indigenous languages spoken in Canada. For more than 20 (28.6%) of those languages, 500 or fewer people reported speaking them as their mother tongue. Overall, 243,155 individuals could conduct a conversation in an Indigenous language, 188,905 people reported having at least one Indigenous mother tongue and 182,925 reported speaking an Indigenous language at home at least on a regular basis. Indigenous languages are a vital part of Canada's cultural and linguistic diversity and are essential to Indigenous Peoples' identity, culture and well-being. Many of the Indigenous languages in Canada are endangered, at risk of extinction due to the impacts of colonialism, residential schools and ongoing discrimination.
Indigenous Peoples in Canada continue to be overrepresented in the criminal justice system, as both victims and offenders. Reporting on custody admissions is limited to a pan-Indigenous identifier. From 2016 to 2021, the percentage of Indigenous adults who entered a correctional facility for remand or who were sentenced to custody or a community supervision program increased slightly from 29.9% to 31.2%. However, the total number of these admissions decreased considerably during the same period, with the number of admissions for Indigenous adults dropping from 74,823 in 2016 to 46,633 in 2021, a difference of 28,190 people.
Income, employment, education, housing, foster care and incarceration are key areas in which Indigenous Peoples face systemic barriers and inequalities. Continued measurement of these gaps is crucial to inform policies and programs that aim to improve socio-economic conditions and reduce disparities between Indigenous and non-Indigenous Peoples. Furthermore, preserving Indigenous languages and promoting language revitalization initiatives can help foster appreciation for Indigenous cultures and maintain this vital component of Canada's linguistic and cultural landscape. Addressing socio-economic disparities and preserving Indigenous languages are essential components of reconciliation. These efforts contribute to the establishment of a more equitable and just society for all Canadians, promoting greater understanding and respect between Indigenous and non-Indigenous Peoples.
Introduction
Each year, Indigenous Services Canada provides a report on:
- the socio-economic gaps between First Nations, Inuit, Métis and other Canadians and the measures taken by the Department to reduce those gaps; and
- the progress made towards the transfer of departmental responsibilities to Indigenous organizations as part of its obligations under the Department of Indigenous Services Act. The 2020 report provided a detailed overview of the demographic and socio-economic trends reported on through Statistics Canada's Census of Population.
This compendium report provides an update to the 2020 report using data from the 2021 census cycle. It provides a broad overview of the socio-economic gaps between First Nations, Inuit and Métis and the non-Indigenous population in Canada. It covers a wide range of social and economic variables, ranging from income and education to housing and language use. It highlights not only the gaps that exist today, but also the evolution of those gaps over time.
Method
A note on terminology
At the outset, we wish to acknowledge that some terms in this document may be offensive and problematic for certain individuals who will read this report. While the language that is used in Canada to describe and speak about Indigenous Peoples is evolving to be more respectful and reflective of how Indigenous Peoples and communities themselves choose to be identified, some pieces of legislation continue to use outdated and colonial terminology.
For example, Canada's Constitution Act, 1982 recognizes three distinct "aboriginal peoples of Canada", namely, "Indian, Inuit and Métis". The Government of Canada now uses the terms "Indigenous" and "First Nations". However, "Aboriginal" and "Indian" remain the legal terms that continue to be used in certain circumstances.
Also, as the Indian Act (PDF), a very outdated and colonial piece of legislation, continues to be in effect, terms such as "registered Indian" (also referred to as "status Indian") remain in use. As these remain accepted legal terms, for the purposes of this report, which requires reference to the Indian Act and its provisions and requires precision in terminology for statistical purposes, the legal terms will be used.
Indigenous Peoples is a collective name for the original peoples of North America and their descendants. More than 1.8 million people in Canada (5.0% of the population of Canada) self-identified as an Indigenous person on Canada's 2021 Census of Population. Indigenous Peoples are the fastest growing population in Canada. Between 2016 and 2021, the Indigenous population grew by 8.0%, while the non-Indigenous population grew by 5.4%. The Indigenous population is also the youngest in Canada: in 2021, 41.2% of Indigenous people were under the age of 25, compared to 27.3% of the non-Indigenous population.
Figure 1 shows the distribution of Indigenous populations across Canada. The figure includes the number of Indigenous individuals living in each province and territory, as well as the proportion of Indigenous Peoples in its overall population. Indigenous Peoples make up the largest proportion of the population in Nunavut (85.8%), the Northwest Territories (49.6%) and the Yukon Territory (22.3%), followed by Manitoba (18.1%) and Saskatchewan (17.0%).
The associated table indicates which proportion of the overall Indigenous population resides in each province and territory. Although Indigenous people comprise only 2.9% of Ontario's population, the province is home to the largest population of Indigenous people, with 406,585 individuals or 22.5% of the Indigenous population in Canada, followed by 16.1 and 15.7% in British Columbia and Alberta, respectively.
The Canadian Constitution recognizes three groups of Indigenous Peoples: First Nations, Inuit, and Métis. These are three distinct peoples with unique histories, languages, cultural practices and spiritual beliefs. Figure 2 shows how the composition of Indigenous populations varies across the provinces and territories. This figure also includes "Other Indigenous" which is comprised of those with multiple Indigenous identities and those who identify as a band member only.

Text alternative for Figure 1: Distribution and number of Indigenous people in Canada by province and territory, 2021
| Population size | Percentage of Region Population | Percentage of Indigenous Population | |
|---|---|---|---|
| Newfoundland and Labrador | 46,545 | 9.3% | 2.6% |
| Prince Edward Island | 3,385 | 2.2% | 0.2% |
| Nova Scotia | 52,430 | 5.5% | 2.9% |
| New Brunswick | 33,300 | 4.4% | 1.8% |
| Quebec | 205,010 | 2.5% | 11.3% |
| Ontario | 406,585 | 2.9% | 22.5% |
| Manitoba | 237,190 | 18.1% | 13.1% |
| Saskatchewan | 187,890 | 17.0% | 10.4% |
| Alberta | 284,470 | 6.8% | 15.7% |
| British Columbia | 290,210 | 5.9% | 16.1% |
| Yukon | 8,810 | 22.3% | 0.5% |
| Northwest Territories | 20,035 | 49.6% | 1.1% |
| Nunavut | 31,390 | 85.8% | 1.7% |
Source: Indigenous Services Canada. Custom Tabulations, 2021 Census of Population.
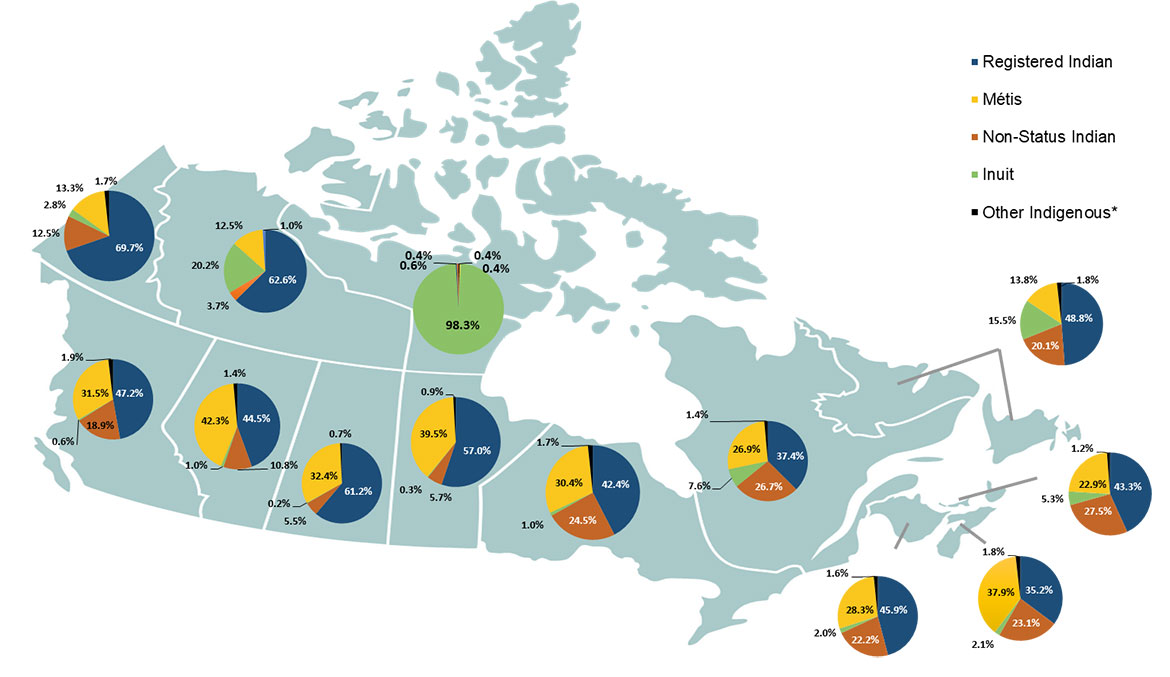
Text alternative for Figure 2: Composition of the Indigenous population in Canada by province and territory, 2021
| Registered Indian | Non-Status Indian | Inuit | Métis | Other Indigenous | |
|---|---|---|---|---|---|
| Newfoundland and Labrador | 48.8% | 20.1% | 15.5% | 13.8% | 1.8% |
| Prince Edward Island | 43.3% | 27.5% | 5.3% | 22.9% | 1.2% |
| Nova Scotia | 35.2% | 23.1% | 2.1% | 37.9% | 1.8% |
| New Brunswick | 45.9% | 22.2% | 2.0% | 28.3% | 1.6% |
| Quebec | 37.4% | 26.7% | 7.6% | 26.9% | 1.4% |
| Ontario | 42.4% | 24.5% | 1.0% | 30.4% | 1.7% |
| Manitoba | 53.6% | 5.7% | 0.3% | 39.5% | 0.9% |
| Saskatchewan | 61.2% | 5.5% | 0.2% | 32.4% | 0.7% |
| Alberta | 44.5% | 10.8% | 1.0% | 42.3% | 1.4% |
| British Columbia | 47.2% | 18.9% | 0.6% | 31.5% | 1.9% |
| Yukon | 69.7% | 12.5% | 2.8% | 13.3% | 1.7% |
| Northwest Territories | 62.6% | 3.7% | 20.2% | 12.5% | 1.0% |
| Nunavut | 0.4% | 0.4% | 98.3% | 0.4% | 0.6% |
Source: Indigenous Services Canada. Custom Tabulations, 2021 Census of Population.
Note: "Other Indigenous" comprises those with multiple Indigenous identities and those who identify as a band member only.
Composition of the Indigenous population in Canada, 2021
First Nations
- The term "First Nations" includes Registered Indians (also called Status Indians) and Non-Status Indians. Registered Indians are individuals registered as Indians under the Indian Act.
- According to the Census, there were 831,720 Registered Indians in Canada in 2021, comprising 46.0% of the Indigenous population. According to the Indian Register, which is an administrative list of all Registered Indians that is maintained by Indigenous Services Canada, there were 1,040,319 Registered Indians as of December 31, 2021.
- Indigenous Services Canada officially recognizes 619 First Nations in Canada, which represent more than 50 Nations and 50 Indigenous languages.
- Some First Nations reside on reserve. A reserve is a parcel of land for which legal title is held by the Crown (Government of Canada), for the use and benefit of a particular First Nation. There are 3,406 reserves in Canada.
- According to the 2021 Census of Canada, about 37.5% of Registered Indians live on reserve and 62.5% live off reserve. Overall, 48.0% of Registered Indians live in urban areas.
- Of the 883 populated census subdivisions associated with First Nations communities in the 2021 Census, 635 or 71.9% have less than 500 inhabitants while only 39 or 4.4% have more than 2,000 inhabitants.
- Non-Status Indians account for 16.3% of the total Indigenous population and live almost exclusively off reserve (97.4%). Overall, 75.0% live in urban areas.
Inuit
- Inuit are Indigenous people of the Arctic. The word Inuit means "the people" in the Inuit language of Inuktitut. The singular of Inuit is Inuk.
- According to the Census, Canada's self-identified Inuit population was 69,705 in 2021, comprising 0.2% of the national population and 3.9% of the Indigenous population. The majority (69.7%) live in Inuit Nunangat, which means "homeland", and 44.3% in Nunavut in particular.
- Inuit Nunangat comprises 51 communities across four regions: Inuvialuit Settlement Region (Northwest Territories and Yukon), Nunavut, Nunavik (northern Quebec), and Nunatsiavut (Labrador).
- In the 2021 Census, just over four-fifths (81.2%) of Inuit in Canada reported that they were enrolled under or were a beneficiary of an Inuit land claims agreement. Of Inuit who were enrolled under or were a beneficiary of an Inuit land claim agreement:
- 32,620 (57.6%) came under the Nunavut Land Claims Agreement;
- 13,235 (23.4%) came under the James Bay and Northern Quebec Agreement;
- 5,920 (10.5%) came under the Labrador Inuit Land Claims Agreement; and
- 4,860 (8.6%) came under the Inuvialuit Final Agreement.
- Most Inuit who are not enrolled under or are not a beneficiary of a land claim agreement (13,080) live outside Inuit Nunangat (86.4%).
Métis
- Of the 624,220 Canadians who self-identified as Métis in the 2021 Census, 224,655 (36.0%) reported membership in a Métis organization or Settlement. Four-fifths (79.8%) reported being a member of one of the five signatories to the Canada-Métis Nation Accord.
- In 2021, the Métis Nation of Alberta had the largest membership reported among Métis organizations, at 45,350, followed closely by the Manitoba Métis Federation, at 43,920, and then by the Métis Nation of Ontario (36,240), Métis Nation British Columbia (27,140) and Métis Nation-Saskatchewan (26,700).
- 3,540 people reported being a member of one of the eight Métis Settlements of Alberta.
Measuring the socio-economic gaps
Why measurement is important
First, continued measurement helps determine whether progress is being achieved over time. Second, ongoing measurement can help demonstrate whether existing programs and policies are properly designed and resourced, and whether there are program and policy gaps that must be addressed. Third, by tracking program and policy performance and identifying gaps, measurement can help ensure accountability of those who design and implement programs and policies. Finally, measurement calls for reflection to clearly and transparently define what progress means. By stimulating conversation and inviting challenge, the iterative process of defining how to measure progress focuses attention on the things that truly matter.
What is important to measure
The socio-economic dimensions addressed in this report were originally selected and analyzed as part of the 2020 Annual Report to Parliament based on a review of the various socio-economic wellness frameworks being used around the world. This compendium report provides an update on these measures to determine the progress that has been made towards narrowing the gaps between Indigenous and non-Indigenous people in Canada.
Examining gaps between Indigenous and non-Indigenous populations helps contextualize the extent of the differences between groups. Without a basis for comparison, raw statistics are difficult to interpret. It is sometimes suggested that focusing on gaps between different populations is inappropriate as it may involve an implicit value judgment. It suggests that the lower-scoring population should aspire to the level of the higher-scoring population on a particular indicator, even if the indicator is of little importance to the lower-scoring population. This is a fair critique and is why the current report focuses on key socio-economic indicators that appear regularly in Indigenous wellness frameworks and that are recognized internationally as important to quality of life in most cultural contexts.
The indicators
The complete set of indicators addressed in this report includes the following.
| Domain | Indicator | Data Source |
|---|---|---|
| Income | Median income Median total income for the working-age population |
Census of Population, Canada, 2006, 2011, 2016, 2021 |
| Poverty Percentage of the population that lived in a low-income situation in the year preceding the Census |
Census of Population, Canada, 2006, 2011, 2016, 2021 | |
| Employment | Employment rate Percentage of the working-age population that was employed on Census reference day |
Census of Population, Canada, 2001, 2006, 2011, 2016, 2021 |
| Median employment income Median employment income received by the working-age population in the year prior to the Census |
Census of Population, Canada, 2006, 2011, 2016, 2021 | |
| Education | High school completion Percentage of the working-age population that had a high school diploma or that had a post-secondary credential even though they did not complete high school |
Census of Population, Canada, 2001, 2006, 2011, 2016, 2021 |
| University completion Percentage of the working-age population with a university degree |
Census of Population, Canada, 2001, 2006, 2011, 2016, 2021 | |
| Family | Foster care Percentage of children and youth aged 0 to 17 in foster care within a private household |
Census of Population, Canada, 2011, 2016, 2021 |
| Culture | Indigenous language knowledge Percentage of the population that is able to carry on a conversation in an Indigenous language |
Census of Population, Canada, 2001, 2006, 2011, 2016, 2021 |
| Housing | Crowding Percentage of dwellings classified as crowded (i.e., having more than one person per room) |
Census of Population, Canada, 2001, 2006, 2011, 2016, 2021 |
| State of repair Percentage of dwellings in need of major repair |
Census of Population, Canada, 2001, 2006, 2011, 2016, 2021 | |
| Justice | Incarceration Custodial admissions as a percentage of the Indigenous and the non-Indigenous population and overrepresentation of Indigenous people in custodial admissions |
Adult Correctional Services survey, 2013 to 2014, 2014 to 2015, 2015 to 2016, 2016 to 2017, 2017 to 2018, 2019 to 2020, 2020 to 2021 |
The 2020 Annual Report to Parliament also included a health domain with a number of indicators linked to vital statistics such as life expectancy and infant mortality. Although new publications on these critical indicators are in development, no new data had been published on these indicators as of the time this report was drafted. Therefore, the health domain and its indicators will be omitted from this iteration of the report and will be reported in a future version once the data are available.
Limitations of the data
Data for the first six sets of indicators (from income to housing) are taken from the Census of Population that is conducted every five years and enumerates private dwellings and the people who reside within them. This robust source of socio-economic information remains the cornerstone of data because of its unparalleled ability to support distinctions-based, cross-time analyses for all of Canada, including reserves and the territories.
Despite its richness, the Census has some important limitations. For example, Indigenous people are classified in the Census as Indigenous (or not) based on self-identification, which can be imperfect given variations in how respondents interpret or understand the Indigenous identity questions, as well as their individual choices respecting whether and how to self-identify as an Indigenous person.
Each of the Indigenous identities is determined through a combination of census questions and is subject to interpretation. For example, Statistics Canada looks only at question 24: "Is this person First Nations, Métis or Inuk (Inuit)?" As Indigenous Services Canada is responsible for maintaining the Indian Register, there is a greater emphasis on the importance of identifying Registered versus Non-Status Indians. Indigenous Services Canada considers an individual's response to question 26: "Is this person a Status Indian (Registered or Treaty Indian as defined by the Indian Act of Canada)?" before question 24 (identity). This seemingly small difference can lead to differences in how the Indigenous identity groups are reported.
Another important limitation is that the Census of Population includes a relatively narrow range of socio-economic indicators and does not capture the various other dimensions of well-being that are important from an Indigenous perspective. For example, the National Outcome-Based Framework includes indicators on governance, the environment, participation in cultural activities, relationship to the land and systemic racism. It also counts only those residing in private dwellings, which leads to an undercount as it inherently excludes those who reside in institutions, who are transient or who are experiencing homelessness.
The 2021 Census was further complicated by the ongoing COVID-19 pandemic, which profoundly impacted the way data were collected for this census cycle. The 2021 Census was launched on May 11, 2021. In order to mitigate the circumstances created by the pandemic and prevent further spread of COVID-19 in First Nations and Inuit communities, Statistics Canada implemented a data collection approach that differed from previous censuses. To minimize face-to-face interactions, the 2021 Census data collection initially prioritized self-enumeration (paper questionnaires, online) rather than in-person interviews with an enumerator. In addition to the constraints caused by the COVID-19 pandemic, the uncovering of burial sites at former residential schools as well as the forest fires in northern Ontario and the western provinces further impacted participation by Indigenous communities and their residents. In order to mitigate the impact of low participation in the 2021 Census, Statistics Canada revised its data collection strategy in July 2021 and sent travel teams of enumerators to various regions across Canada. Engagement efforts were bolstered through an expanded Indigenous Liaison Program at Statistics Canada, and efforts were made to hire census staff locally within communities.
All data collection activities for the 2021 Census ceased on September 24, 2021. Despite all efforts by Statistics Canada, a total of 63 census subdivisions defined as reserves and settlements were incompletely enumerated. Previously, the number of incompletely enumerated reserves had declined; for example, it was 30 in 2001, 22 in 2006, 36 in 2011 and 14 in 2016. In 2021, the estimated census response rate in Indigenous and northern communities was 85.6%. Comparatively, the overall census response rate was 98% in 2021, and the response rate in Indigenous communities was 92% in 2016.
Given the larger number of First Nations communities that were incompletely enumerated in 2021, Statistics Canada has urged caution when comparing variables that are strongly tied to First Nations reserves. For example, Indigenous language knowledge is typically substantially higher among those residing on a reserve. As some of those responses were not captured during this census data collection cycle, there is an increased risk of potentially erroneous or confounding conclusions. Any potential drop in Indigenous language knowledge may stem from a real drop in the number of Indigenous language speakers or from the fact that fewer Indigenous language speakers were counted this census and are missing from the overall findings.
As we move beyond the census to seek other sources of data on justice, the persistent gaps in data on Indigenous populations become more evident as data are limited to a pan-Indigenous identifier. Where such limitations exist, the best data available are used to illustrate the gaps between Indigenous and non-Indigenous populations.
The analysis
To the extent possible, this analysis is distinctions-based. Data are presented for the three main distinctions groups: First Nations, Inuit and Métis. First Nations data are further disaggregated, given the significant differences in socio-economic outcomes that are known to exist among the following groups: Registered Indians living on reserve, Registered Indians living off reserve and Non-Status Indians. Where possible, data for the past 20 years have been included to illustrate how socio-economic gaps between Indigenous and non-Indigenous populations have evolved.
Regional analyses are also provided. Notably, some very small populations of First Nations and Métis in the territories are also the populations experiencing the largest gaps relative to the non-Indigenous population. Because statistics based on very small populations are less reliable and can create a skewed image of overall trends, one option would be to exclude them from broader analyses and/or discuss them separately. In the interest of transparency, however, it was decided to retain these small populations as part of the general analysis. Readers are encouraged to interpret statistics for small populations with caution, especially when data are further broken down by gender, age or other variables.
For the first time in census history, 2021 marks the shift to reporting on gender rather than biological sex. A new question on gender was included in the 2021 Census to reflect a growing social and legislative recognition of transgender and non-binary people. Gender identity refers to a person's internal and individual experience with gender. It may not be visible to others and it may not align with socially constructed gender norms. A person may refer to their gender identity in a multitude of ways including Woman, Man, Non-binary, Two-Spirit, Pangender, Agender, Gender Queer, Gender Fluid, Transgender or Cisgender.
The 2021 Census is the first census to provide data on transgender people and non-binary people. Census 2021 allowed individuals to write in responses other than male or female for the gender question. All these responses were condensed into a single non-binary gender for reporting purposes. Even with this amalgamation, the number of non-binary people is still quite small. Given this, Statistics Canada further aggregates data into a two-category gender variable when necessary to protect the confidentiality of responses provided. In these cases, individuals in the category "non-binary persons" are distributed in the other two gender categories and are denoted by the "+" symbol. "Men+" includes men (and/or boys), as well as half of non-binary persons. "Women+" includes women (and/or girls), as well as half of non-binary persons. Detailed analyses by gender are provided where feasible.
Measuring the gap
A number of different approaches can be taken to assess the gaps between Indigenous and non-Indigenous populations. For instance, the difference between groups (e.g., there was a difference of X % or Y dollars between group A and B) can be used to get a sense of where the gaps exist. However, limiting analysis to look only at the differences between groups can hinder the comparability between groups and indicators over time. Another choice is to examine the relative variation. The % change in gaps can be calculated, allowing for the relative size of the changes to be compared.
In this report, the gap between the total Indigenous population (or Indigenous group) and the non-Indigenous population is provided for each indicator. The gap is reported as the difference between the two populations. An analysis of the % change in the gap from 2016 to 2021 is also presented and discussed where feasible.
A common approach to interpreting % change is to use Cohen's d effect size measure as a guide. According to Cohen's conventions, a small effect size is typically defined as a Cohen's d of 0.2, a medium effect size as a Cohen's d of 0.5, and a large effect size as a Cohen's d of 0.8. Using these conventions, a % change of 5% would be considered a small effect size, a % change of 12.5% would be considered a medium effect size, and a % change of 20% or more would be considered a large effect size.
In the spirit of accessibility and transparency, the goal of this report is to provide a large volume of data to inform partners and stakeholders. For each figure, a brief summary of the more notable findings is presented. The full data tables are available in Appendix A and readers are encouraged to engage with the data. To obtain a copy of the data associated with this report or to obtain additional census data related to Indigenous Peoples in Canada, please contact the Indigenous and Northern Statistics Team (INSTAT) at instat@sac-isc.gc.ca.
Findings
Income – Median individual income
Median income is a well-established measure of material well-being. Although it does not capture an individual's assets, median income is one way of estimating a person's wealth. Median individual income refers to a person's total income before tax from all sources including market income (such as employment wages) and government transfers (such as Old Age Security pension and other government benefit programs). In the census, income information is provide through tax records from the previous calendar year. For example, for data collected in the 2021 Census, income from January 1, 2020 to December 31, 2020 is reported. Similarly, for Census 2016, income data is based on 2015.
Median individual income includes government benefits, which is of particular importance for 2020. In response to the COVID-19 pandemic, a number of new government benefits were offered such as the Canada Emergency Response Benefit (CERB). Statistics Canada has analyzed these most recent census data and concluded that "the decrease [in poverty rates] was mostly driven by increased government transfers and temporary pandemic-related benefits."
For a full list of all data tables relevant to median income, please see Appendix A, tables A1.1 to A1.6.

Text alternative for Figure 3: Median individual income, 2020, Indigenous and non-Indigenous populations, aged 25 to 64, Canada
| Registered Indian on reserve | Registered Indian off reserve | Non-Status Indian | Inuit | Métis | Non-Indigenous |
|---|---|---|---|---|---|
| $32,000 | $42,000 | $43,200 | $42,800 | $48,800 | $50,400 |
Source: Indigenous Services Canada. Custom Tabulations, 2021 Census of Population.
- Median individual income for individuals aged 25 to 64 was lower for all Indigenous groups compared to the non-Indigenous population ($50,400).
- Registered Indians living on reserve had the largest gap in median individual income ($32,000) with relative to the non-Indigenous population, at $18,400.
- The gaps in median individual income for Registered Indians living off reserve ($8,400), Inuit ($7,600) and Non-Status Indians ($7,200) relative to the non-Indigenous population were similar in size.
- For Métis, median individual income varied little relative to the non-Indigenous population with a gap of only $1,600.
- The full dataset for this figure is available in Appendix A – Table A1.1.

Text alternative for Figure 4: Median individual income 2005 to 2020 (adjusted), Indigenous and non-Indigenous populations, aged 25 to 64, Canada
| Registered Indian on reserve | Registered Indian off reserve | Non-Status Indian | Inuit | Métis | Non-Indigenous | |
|---|---|---|---|---|---|---|
| 2005 | $17,700 | $27,700 | $30,800 | $31,000 | $35,200 | $41,800 |
| 2010 | $18,200 | $32,300 | $34,700 | $34,200 | $40,300 | $44,400 |
| 2015 | $22,100 | $35,400 | $37,400 | $36,000 | $44,300 | $46,600 |
| 2020 | $32,000 | $42,000 | $43,200 | $42,800 | $48,800 | $50,400 |
Source: Indigenous Services Canada. Custom Tabulations, 2006 to 2021 Census of Population.
Note: The dollar values have been adjusted for inflation and are stated in terms of their value in 2020.
- In the last 15 years, there has been a notable closing of the gap in median individual income between each of the Indigenous groups and the non-Indigenous population.
- The most striking reduction in the income gap occurred among Registered Indians living on reserve, improving from the largest gap of $26,200 in 2010 to $18,400 in 2020, which represents a reduction of $7,770.
- Registered Indians off reserve had the largest change in dollars, with median individual income increasing from $27,700 in 2005 to $42,000 in 2020, an increase of $14,300.
- The median income gap narrowed to a lesser extent for Non-Status Indians, from $11,000 in 2005 to $7,200 in 2020; for Inuit, from $10,800 to $7,600; and for Métis, from $6,600 to $1,600.
- This narrowing of gaps is likely due in part to the increased government transfers in 2020 as a result of supports made available during the COVID-19 pandemic. Results from the 2026 Census will be essential to assess if these improvements are sustainable long term.
- The full dataset for this figure is available in Appendix A – Table A1.2.

Text alternative for Figure 5: Median individual income, 2020, First Nations and non-Indigenous populations, aged 25 to 64, by region
| Registered Indian on reserve | Registered Indian off reserve | Non-Status Indian | Non-Indigenous | |
|---|---|---|---|---|
| Newfoundland and Labrador | $44,800 | $42,800 | $43,200 | $46,000 |
| Prince Edward Island | $38,400 | $41,200 | $34,800 | $45,600 |
| Nova Scotia | $32,400 | $43,600 | $39,600 | $45,600 |
| New Brunswick | $35,600 | $40,400 | $36,800 | $45,200 |
| Quebec | $44,800 | $46,800 | $45,200 | $50,000 |
| Ontario | $32,400 | $44,000 | $42,400 | $50,400 |
| Manitoba | $28,000 | $36,400 | $40,000 | $48,800 |
| Saskatchewan | $27,000 | $39,200 | $41,200 | $53,600 |
| Alberta | $31,200 | $42,400 | $45,900 | $54,400 |
| British Columbia | $32,400 | $42,400 | $44,000 | $50,000 |
| Yukon | $50,800 | $62,000 | $68,500 | |
| Northwest Territories | $39,200 | $47,600 | $69,000 | $89,000 |
| Nunavut | $100,000 | $92,000 | $116,000 |
Source: Indigenous Services Canada. Custom Tabulations, 2021 Census of Population.
- The national picture of the gap in median income between First Nations and the non-Indigenous population masks important regional differences.
- Registered Indians living on reserve in Newfoundland and Labrador, for example, had a median income that was almost equal to that of the non-Indigenous population, while those in Saskatchewan had a median income that was only half of the median income of Saskatchewan's non-Indigenous population, a difference of approximately $26,600 annually.
- For Registered Indians living off reserve, the smallest gap in median individual income was found in Nova Scotia ($2,000) and the largest in the Northwest Territories ($41,400).
- Among Non-Status Indians, Newfoundland and Labrador had the smallest gap at $2,800 compared to the largest in Nunavut ($24,000) followed by the Northwest Territories ($20,000).
- The full dataset for this figure is available in Appendix A – Table A1.3.

Text alternative for Figure 6: Median individual income, 2020, Métis and non-Indigenous populations, aged 25 to 64, by region
| Métis | Non-Indigenous | |
|---|---|---|
| Newfoundland and Labrador | $48,400 | $46,000 |
| Prince Edward Island | $51,600 | $45,600 |
| Nova Scotia | $44,000 | $45,600 |
| New Brunswick | $40,400 | $45,200 |
| Quebec | $47,600 | $50,000 |
| Ontario | $49,200 | $50,400 |
| Manitoba | $47,600 | $48,800 |
| Saskatchewan | $49,200 | $53,600 |
| Alberta | $50,800 | $54,400 |
| British Columbia | $48,400 | $50,000 |
| Yukon | $61,600 | $68,500 |
| Northwest Territories | $79,000 | $89,000 |
| Nunavut | $125,000 | $116,000 |
Source: Indigenous Services Canada. Custom Tabulations, 2021 Census of Population.
- Regional differences were less pronounced among Métis than First Nations, as their median individual incomes were much closer to and, in some areas, above those of their non-Indigenous counterparts.
- Of note, the Métis populations in Nunavut (110 people) and Prince Edward Island (770 people) were small, and the high incomes observed in these areas are more likely a result of the effects of the small population size, not a reflection of robust area differences.
- The largest gap in median individual income ($10,000) between Métis and the non-Indigenous population was found in the Northwest Territories.
- The full dataset for this figure is available in Appendix A – Table A1.4.
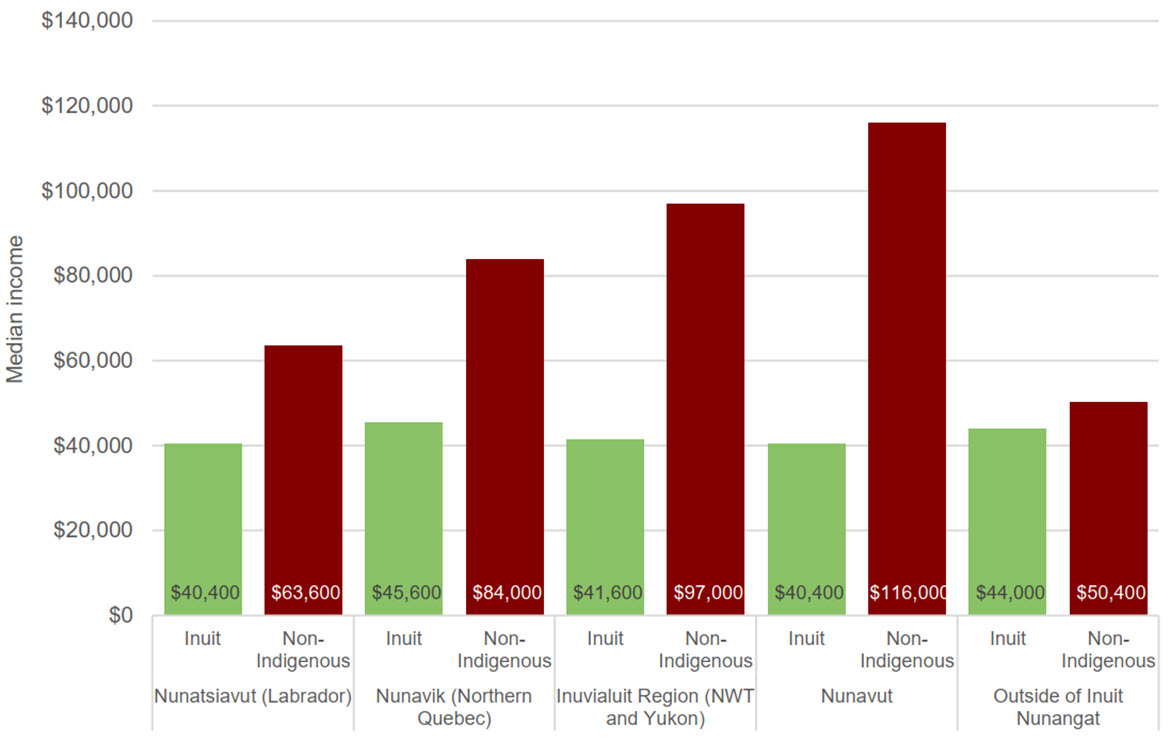
Text alternative for Figure 7: Median individual income, 2020, Inuit and non-Indigenous populations, aged 25 to 64, by Inuit region
| Nunatsiavut (Labrador) | Nunavik (Northern Quebec) | Inuvialuit Region (Northwest Territories and Yukon) | Nunavut | Outside of Inuit Nunangat | |||||
|---|---|---|---|---|---|---|---|---|---|
| Inuit | Non-Indigenous | Inuit | Non-Indigenous | Inuit | Non-Indigenous | Inuit | Non-Indigenous | Inuit | Non-Indigenous |
| $40,400 | $63,600 | $45,600 | $84,000 | $41,600 | $97,000 | $40,400 | $116,000 | $44,000 | $50,400 |
Source: Indigenous Services Canada. Custom Tabulations, 2021 Census of Population.
- Median individual income among the Inuit population differed marginally across regions, ranging from $40,400 in both regions of Nunatsiavut and Nunavut to $45,600 in the Nunavik region of Northern Quebec.
- The gaps in median individual income relative to the non-Indigenous population in Inuit Nunangat's four constituting regions were sizable, ranging from $23,200 in Nunatsiavut to $75,600 in Nunavut.
- It is worth noting that the wide gaps reflect the high median incomes of the non-Indigenous population living in Inuit Nunangat. Outside of Inuit Nunangat, the median income of the non-Indigenous population was much lower, and the gap was comparatively narrow at $6,400.
- The full dataset for this figure is available in Appendix A – Table A1.5.
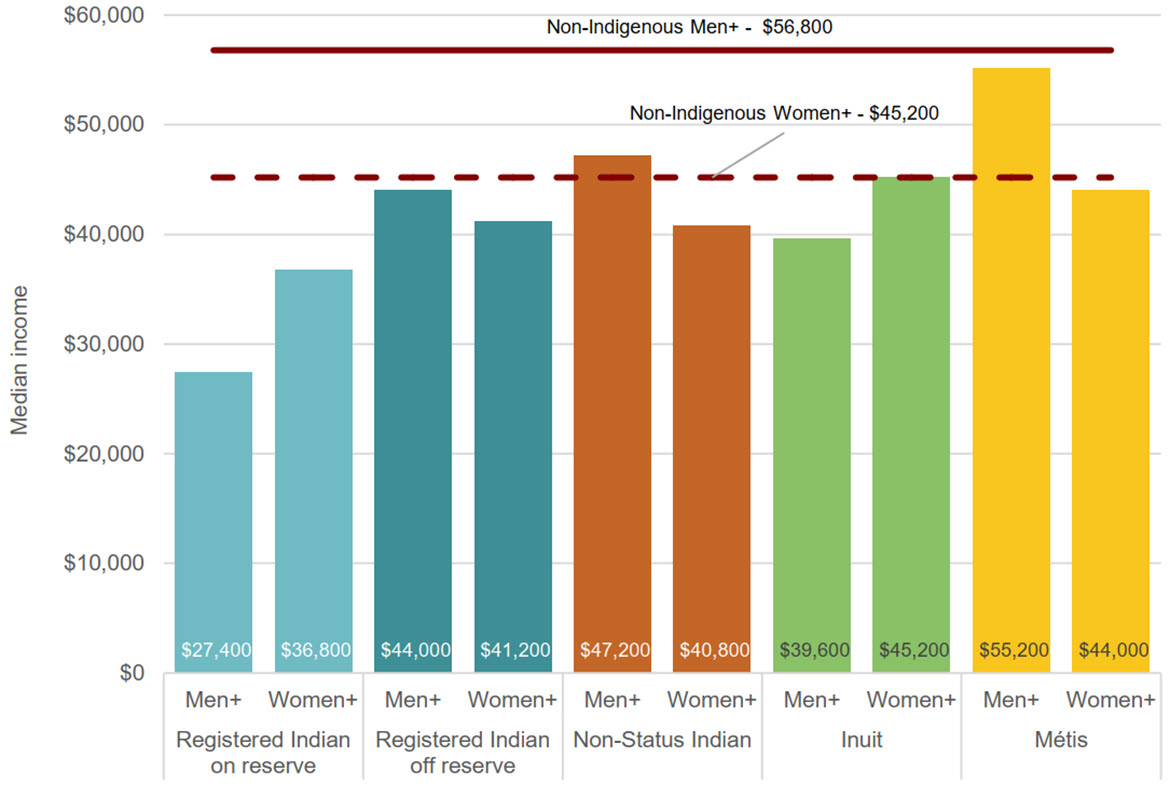
Text alternative for Figure 8: Median individual income, 2020, Indigenous and non-Indigenous populations, aged 25 to 64, by gender, Canada
| Men+ Income | Women+ Income | |
|---|---|---|
| Registered Indian on reserve | $27,400 | $36,800 |
| Registered Indian off reserve | $44,000 | $41,200 |
| Non-Status Indian | $47,200 | $40,800 |
| Inuit | $39,600 | $45,200 |
| Métis | $55,200 | $44,000 |
| Non-Indigenous | $56,800 | $45,200 |
Source: Indigenous Services Canada. Custom Tabulations, 2021 Census of Population.
Note: Given that the non-binary population is small, Statistics Canada implemented a method producing a two-category gender variable to prevent disclosure of identifiable data for lower levels of geography. Consequently, information will be disseminated using the following categories: Men+, Women+. Individuals in the "non-binary persons" category are distributed in the other two gender categories and are denoted by the "+" symbol.
- In 2020, the median individual income for non-Indigenous men+ was higher than the median income for non-Indigenous women+ by approximately $11,600.
- By contrast, Inuit women+ had a higher median income (by $5,600) than Inuit men+. Among Registered Indians living on reserve, the median income of women+ was $9,400 higher than that of men+.
- The gap in median individual income relative to the non-Indigenous population was highest among Registered Indian men+ on reserve, at $29,400, and lowest among Métis men+, at $1,600.
- The median individual income of Inuit women+ was equivalent to that of the non-Indigenous group (no gap), while Registered Indian women+ living on reserve had the largest gap relative to the non-Indigenous group, at $8,400.
- The full dataset for this figure is available in Appendix A – Table A1.6.
Measuring the gap
| 2015 | 2020 | Five-Year Change | ||||
|---|---|---|---|---|---|---|
| Income | Gap | Income | Gap | Income | Percentage change in gap | |
| Registered Indian on reserve | $22,100 | -$24,500 | $32,000 | -$18,400 | $9,900 | -24.9% |
| Registered Indian off reserve | $35,400 | -$11,200 | $42,000 | -$8,400 | $6,600 | -25.0% |
| Non-Status Indian | $37,400 | -$9,200 | $43,200 | -$7,200 | $5,800 | -21.7% |
| Inuit | $36,000 | -$10,600 | $42,800 | -$7,600 | $6,800 | -28.3% |
| Métis | $44,300 | -$2,300 | $48,800 | -$1,600 | $4,500 | -30.4% |
| Non-Indigenous | $46,600 | $50,400 | $3,800 | |||
Source: Indigenous Services Canada. Custom Tabulations, 2016 to 2021 Census of Population. Note: The dollar values for 2015 have been adjusted for inflation and are stated in terms of their value in 2020. |
||||||
- Overall, in all cases, the gaps between the Indigenous group and the non-Indigenous population shrunk between 2015 and 2020.
- There was a large narrowing of the gap in individual median income for all Indigenous groups compared to the non-Indigenous population, with the largest change occurring among Métis, at 30.4%.
| Men+ | Women+ | |||
|---|---|---|---|---|
| Income change | Percentage change in gap | Income change | Percentage change in gap | |
| Registered Indian on reserve | $10,360 | -12.1% | $13,500 | -38.7% |
| Registered Indian off reserve | $6,100 | 1.6% | $11,600 | -45.9% |
| Non-Status Indian | $6,500 | -2.0% | $10,600 | -35.3% |
| Inuit | $7,000 | -3.9% | $11,800 | -100.0% |
| Métis | $5,200 | 220.0% | $9,500 | -52.0% |
| Non-Indigenous | $6,300 | $8,200 | ||
Source: Indigenous Services Canada. Custom Tabulations, 2016 to 2021 Census of Population. Note: The 2015 dollar values have not been adjusted for inflation. Given that the non-binary population is small, Statistics Canada implemented a method producing a two-category gender variable to prevent disclosure of identifiable data for lower levels of geography. Consequently, information will be disseminated using the following categories: Men+, Women+. Individuals in the "non-binary persons" category are distributed in the other two gender categories and are denoted by the "+" symbol. |
||||
- Generally, Indigenous women+ had substantially greater gains than Indigenous men+ in terms of closing the gap with their non-Indigenous counterparts.
- For Indigenous men+, the gaps in median individual income relative to the non-Indigenous population remained relatively stable between 2015 and 2020, with the exception of Métis for whom the gap more than doubled (220.0%) from $500 in 2015 to $1,600 in 2020.
- All Indigenous women+ saw a large narrowing of the gap between 2015 and 2020, particularly Inuit women+ for whom the gap with their non-Indigenous counterparts closed entirely (-100.0%).
- It is important to acknowledge that the general narrowing of the gaps may stem from the increased availability of government benefits during the COVID-19 pandemic.
- The full dataset for this figure is available in Appendix A – Table A1.6.
Low-income measure after tax
The low-income measure after tax (LIM-AT) is one way to assess the level of poverty in a population. A person is considered to be living in a low-income situation if they are part of a household whose total income (after tax) is less than half of the national median household income, adjusted for household size. The low-income threshold in 2020 was $26,503 for a single person and $53,005 for a family of four. Overall, more than 335,000 Indigenous people were living in a low-income situation in 2020 (Table 3). Data are based on the last full calendar year before the census (i.e., 2005, 2010, 2015, 2020). For a full list of all data tables relevant to the low-income measure after tax, please see Appendix A, tables A2.1 to A2.6.
| 2015 | 2020 | Difference | Percentage Change | |
|---|---|---|---|---|
| Registered Indian on reserve | 157,785 | 97,595 | -60,190 | -38.1% |
| Registered Indian off reserve | 147,970 | 102,940 | -45,030 | -30.4% |
| Non-Status Indian | 58,600 | 49,625 | -8,975 | -15.3% |
| Inuit | 14,330 | 11,490 | -2,840 | -19.8% |
| Métis | 92,875 | 73,910 | -18,965 | -20.4% |
| Non-Indigenous | 4,517,905 | 3,677,120 | -840,785 | -18.6% |
Source: Indigenous Services Canada. Custom Tabulations, 2016 to 2021 Census of Population. |
||||
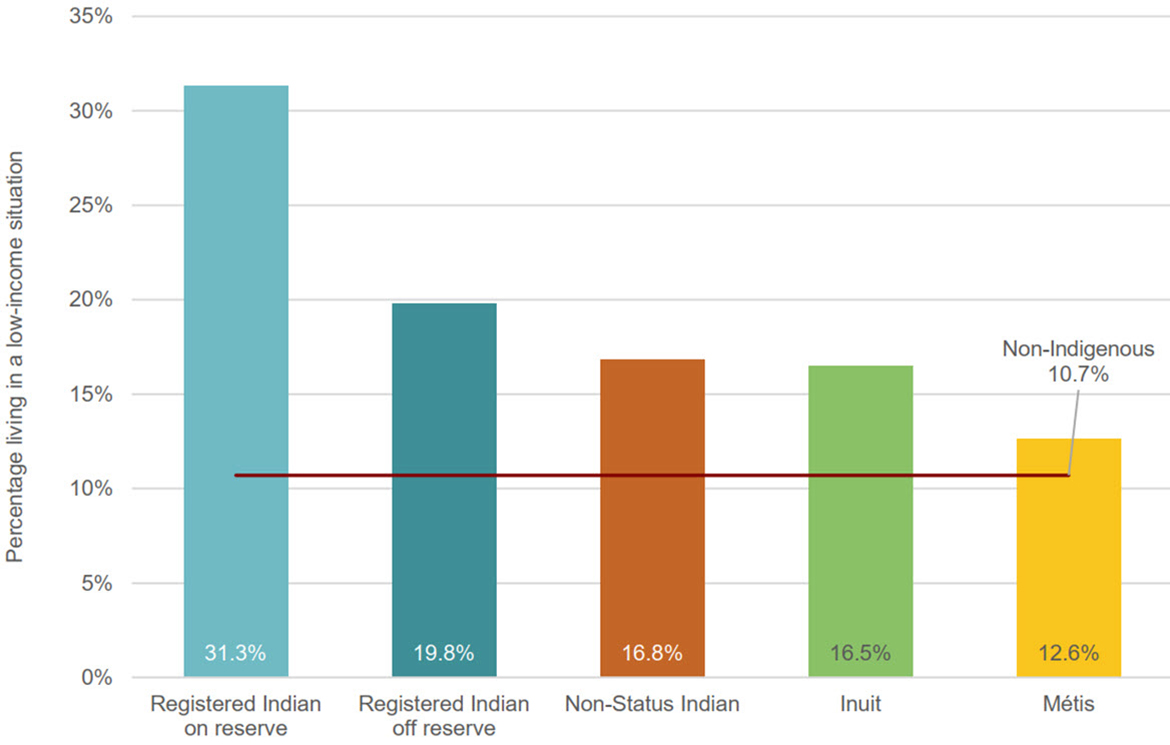
Text alternative for Figure 9: Percentage living in a low-income situation, 2020, Indigenous and non-Indigenous populations, Canada
| Percentage | |
|---|---|
| Registered Indian on reserve | 31.3% |
| Registered Indian off reserve | 19.8% |
| Non-Status Indian | 16.8% |
| Inuit | 16.5% |
| Métis | 12.6% |
| Non-Indigenous | 10.7% |
Source: Indigenous Services Canada. Custom Tabulations, 2021 Census of Population.
- All the Indigenous groups were more likely to live in a low-income situation than the non-Indigenous population (10.7%).
- The proportion of those living in a low-income situation was highest amongst Registered Indians, representing 31.3% of Registered Indians on reserve and 19.8% of Registered Indians off reserve.
- A slightly lower proportion of Non-Status Indians (16.8%) and Inuit (16.5%) were living in a low-income situation in 2020.
- Métis were closest to the proportion of the non-Indigenous population living in a low-income situation (12.6%).
- The full dataset for this figure is available in Appendix A – Table A2.1.
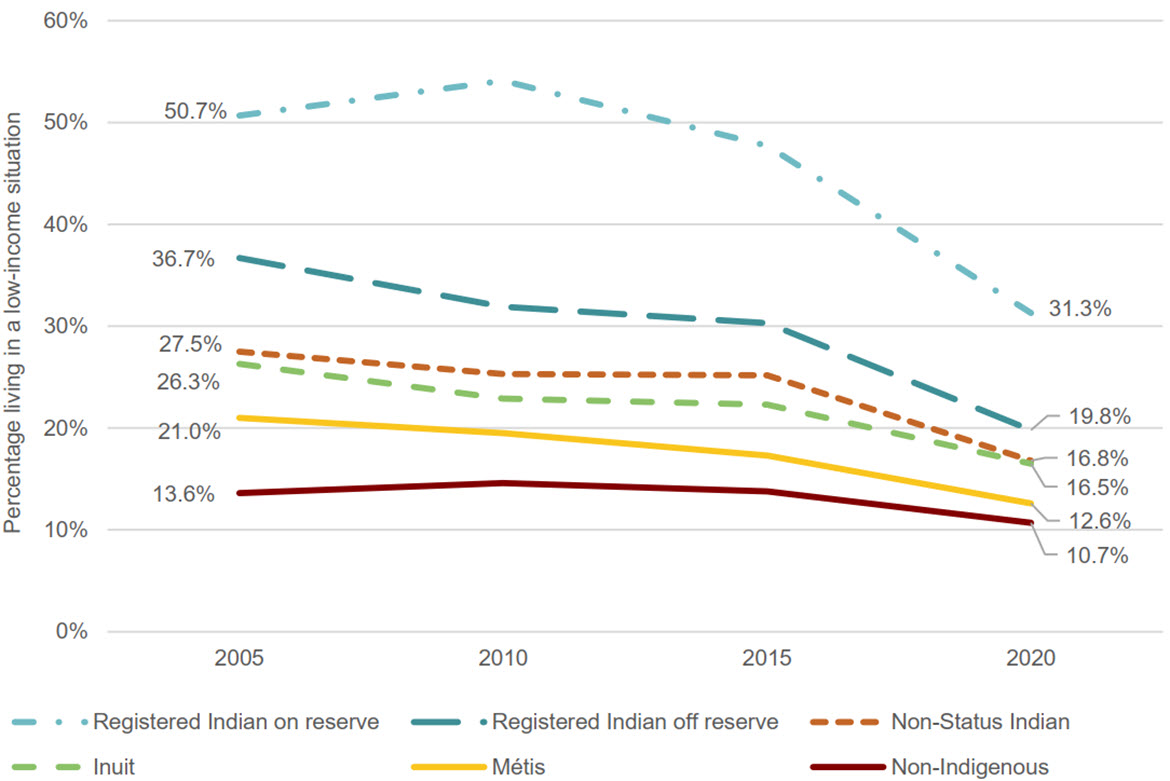
Text alternative for Figure 10: Percentage living in a low-income situation, 2005 to 2020, Indigenous and non-Indigenous populations, Canada
| Registered Indian on reserve | Registered Indian off reserve | Non-Status Indian | Inuit | Métis | Non-Indigenous | |
|---|---|---|---|---|---|---|
| 2005 | 50.7% | 36.7% | 27.5% | 26.3% | 21.0% | 13.6% |
| 2010 | 54.1% | 31.9% | 25.3% | 22.9% | 19.5% | 14.6% |
| 2015 | 47.7% | 30.3% | 25.2% | 22.3% | 17.3% | 13.8% |
| 2020 | 31.3% | 19.8% | 16.8% | 16.5% | 12.6% | 10.7% |
Source: Indigenous Services Canada. Custom Tabulations, 2021 Census of Population.
- The likelihood of living in a low-income situation decreased between 2005 and 2020 for each Indigenous group, particularly Registered Indians on reserve. That group had a total decline of 19.4 percentage points from 2005 (50.7%) to 2020 (31.3%).
- The proportion of Registered Indians living off reserve in a low-income situation dropped considerably, from 36.7% in 2005 to 19.8% in 2020, a decline of 16.9 percentage points.
- The proportion of individuals living in a low-income situation among Non-Status Indians, Inuit and Métis also fell, from 27.5 to 16.8% (10.7 percentage points), 26.3 to 16.5% (9.8 percentage points), and 21.0 to 12.6% (8.4 percentage points), respectively.
- Although the availability of government benefits during the COVID-19 pandemic may have contributed to these reductions, the downward trend was also notable between 2005 and 2015 prior to the pandemic and any related supports. Census 2026 will be important in determining if these recent reductions are long lasting.
- The full dataset for this figure is available in Appendix A – Table A2.2.

Text alternative for Figure 11: Percentage living in a low-income situation, 2020, First Nations and non-Indigenous populations, by region
| Registered Indian on reserve | Registered Indian off reserve | Non-Status Indian | Non-Indigenous | |
|---|---|---|---|---|
| Newfoundland and Labrador | 12.4% | 15.9% | 15.0% | 15.2% |
| Prince Edward Island | 21.8% | 20.3% | 18.3% | 13.7% |
| Nova Scotia | 35.2% | 17.5% | 20.4% | 14.6% |
| New Brunswick | 24.0% | 16.3% | 21.1% | 14.0% |
| Quebec | 14.8% | 16.5% | 15.4% | 11.8% |
| Ontario | 33.7% | 16.8% | 16.0% | 9.9% |
| Manitoba | 38.5% | 30.6% | 31.0% | 11.5% |
| Saskatchewan | 40.9% | 26.6% | 28.8% | 10.7% |
| Alberta | 29.8% | 19.5% | 15.2% | 8.6% |
| British Columbia | 25.0% | 15.9% | 13.9% | 10.5% |
| Yukon | 12.9% | 12.7% | 6.4% | |
| Northwest Territories | 18.4% | 11.3% | 6.7% | 2.9% |
| Nunavut | 8.0% | 9.1% | 3.4% |
Source: Indigenous Services Canada. Custom Tabulations, 2021 Census of Population.
- For Registered Indians living on reserve, the highest proportion of individuals living in a low-income situation was observed in Saskatchewan (40.9%) and Manitoba (38.5%), and the lowest in Newfoundland and Labrador (12.4%).
- Among Registered Indians living off reserve, the highest proportions of individuals living in a low-income situation were in Manitoba (30.6%) and Saskatchewan (26.6%), and the lowest in Nunavut (8.0%) and the Northwest Territories (11.3%).
- The same trend applied to Non-Status Indians, where the highest proportions of individuals living in a low-income situation were in Manitoba (31.0%) and Saskatchewan (28.8%), and the lowest in the Northwest Territories (6.7%).
- The gaps between First Nations and non-Indigenous people living in a low-income situation varied markedly across the provinces and territories. These gaps were consistently highest for Registered Indians living on and off reserve as well as Non-Status Indians in Manitoba and Saskatchewan, and were lowest for those in Newfoundland and Labrador.
- The full dataset for this figure is available in Appendix A – Table A2.3.

Text alternative for Figure 12: Percentage living in a low-income situation, 2020, Métis and non-Indigenous populations, by region
| Métis | Non-Indigenous | |
|---|---|---|
| Newfoundland and Labrador | 10.2% | 15.2% |
| Prince Edward Island | 13.6% | 13.7% |
| Nova Scotia | 14.0% | 14.6% |
| New Brunswick | 16.4% | 14.0% |
| Quebec | 15.9% | 11.8% |
| Ontario | 11.3% | 9.9% |
| Manitoba | 14.5% | 11.5% |
| Saskatchewan | 14.5% | 10.7% |
| Alberta | 11.4% | 8.6% |
| British Columbia | 10.7% | 10.5% |
| Yukon | 5.1% | 6.4% |
| Northwest Territories | 6.8% | 2.9% |
| Nunavut | 3.4% |
Source: Indigenous Services Canada. Custom Tabulations, 2021 Census of Population.
- The proportion of Métis living in a low-income situation varied across Canada.
- Métis were less likely than their non-Indigenous counterparts to live in a low-income situation in Newfoundland and Labrador (10.2%) and Yukon (5.1%).
- In Prince Edward Island (13.6%), Nova Scotia (14.0%) and British Columbia (10.7%), the proportion of Métis and non-Indigenous people living in a low-income situation was on par.
- The proportion of Métis living in a low-income situation outpaced that of the non-Indigenous population in all other regions.
- The full dataset for this figure is available in Appendix A – Table A2.4.

Text alternative for Figure 13: Percentage living in a low-income situation, 2020, Inuit and non-Indigenous populations, by Inuit region
| Nunatsiavut (Labrador) | Nunavik (Northern Quebec) | Inuvialuit Region (Northwest Territories and Yukon) | Nunavut | Outside Inuit Nunangat | |||||
|---|---|---|---|---|---|---|---|---|---|
| Inuit | Non-Indigenous | Inuit | Non-Indigenous | Inuit | Non-Indigenous | Inuit | Non-Indigenous | Inuit | Non-Indigenous |
| 22.2% | 13.3% | 15.1% | 5.8% | 16.1% | 5.7% | 16.7% | 3.4% | 16.5% | 10.7% |
Source: Indigenous Services Canada. Custom Tabulations, 2021 Census of Population.
- The proportion of Inuit living in a low-income situation was highest in Nunatsiavut (22.2%) and lowest in Nunavik (15.1%).
- The gap between Inuit and non-Indigenous people living in a low-income situation varied considerably. Inside of Inuit Nunangat, the gap was highest in Nunavut (13.3 percentage point difference) and lowest in the Nunatsiavut region (8.9 percentage point difference).
- Conversely, for Inuit residing outside the Inuit Nunangat, the gap between Inuit and non-Indigenous people living in a low-income situation was 5.8 percentage point difference.
- The full dataset for this figure is available in Appendix A – Table A2.5.

Text alternative for Figure 14: Percentage living in a low-income situation, 2020, Indigenous and non-Indigenous populations, by gender, Canada
| Men+ Percentage | Women+ Percentage | |
|---|---|---|
| Registered Indian on reserve | 31.2% | 31.4% |
| Registered Indian off reserve | 18.4% | 21.0% |
| Non-Status Indian | 16.3% | 17.3% |
| Inuit | 16.1% | 16.8% |
| Métis | 11.9% | 13.3% |
| Non-Indigenous | 10.1% | 11.2% |
Source: Indigenous Services Canada. Custom Tabulations, 2021 Census of Population.
Note: Given that the non-binary population is small, Statistics Canada produced a two-category gender variable that was applied to prevent disclosure of identifiable data for lower levels of geography when necessary. Consequently, information will be disseminated using the following categories: Men+, Women+. Individuals in the "non-binary persons" category are distributed in the other two gender categories and are denoted by the "+" symbol.
- Although women+ were more likely than men+ to be living in a low-income situation, the differences were relatively small when compared to the gaps between Indigenous and non-Indigenous populations.
- The proportion of Indigenous people living in a low-income situation ranged from 11.9% for Métis men+ to 31.2% for Registered Indian men+ living on reserve. Similarly, this percentage ranged from 13.3% for Métis women+ to 31.4% for Registered Indian women+ living on reserve.
- The gaps between Indigenous and non-Indigenous men+ did not differ in a marked or consistent way from the gaps between Indigenous and non-Indigenous women+. Both Registered Indian men+ and women+ living on reserve exhibited the largest gap with their non-Indigenous counterparts, with differences of 21.1 and 20.2 percentage points, respectively. Conversely, Métis men+ and women+ displayed the smallest gap in low-income situation with differences of 1.8 and 2.1 percentage points.
- The full dataset for this figure is available in Appendix A – Table A2.6.
Measuring the gap
| 2015 | 2020 | Five-Year Change | ||||
|---|---|---|---|---|---|---|
| Percentage | Gap | Percentage | Gap | Percentage | Percentage change in gap | |
| Registered Indian on reserve | 47.7% | 33.9% | 31.3% | 20.6% | -16.4% | -39.2% |
| Registered Indian off reserve | 30.3% | 16.5% | 19.8% | 9.1% | -10.5% | -44.8% |
| Non-Status Indian | 25.2% | 11.4% | 16.8% | 6.1% | -8.4% | -46.5% |
| Inuit | 22.3% | 8.5% | 16.5% | 5.8% | -5.8% | -31.8% |
| Métis | 17.3% | 3.5% | 12.6% | 1.9% | -4.7% | -45.7% |
| Non-Indigenous | 13.8% | 10.7% | -3.1% | |||
Source: Indigenous Services Canada. Custom Tabulations, 2016 to 2021 Census of Population. |
||||||
- Indigenous groups were more likely than the non-Indigenous population to be living in a low-income situation.
- The gap was especially large for Registered Indians living on reserve (20.6 percentage points higher than for the non-Indigenous population), although it had closed considerably since 2015, narrowing by 39.2%.
- Overall, there was a large narrowing of gap for each Indigenous group from 2015 to 2020, with the largest improvement among Non-Status Indians (46.5%), followed by Métis (45.7%), Registered Indians off reserve (44.8%) and Inuit (31.8%).
| Men+ | Women+ | |||
|---|---|---|---|---|
| Percentage | Percentage change in gap | Percentage | Percentage change in gap | |
| Registered Indian on reserve | -16.5% | -39.0% | -16.3% | -39.2% |
| Registered Indian off reserve | -10.0% | -45.8% | -10.9% | -43.7% |
| Non-Status Indian | -8.0% | -44.6% | -8.8% | -47.4% |
| Inuit | -6.0% | -33.3% | -5.7% | -30.0% |
| Métis | -4.1% | -37.9% | -5.2% | -47.5% |
| Non-Indigenous | -3.0% | -3.3% | ||
Source: Indigenous Services Canada. Custom Tabulations, 2016 to 2021 Census of Population. Note: Given that the non-binary population is small, Statistics Canada produced a two-category gender variable that was applied to prevent disclosure of identifiable data for lower levels of geography when necessary. Consequently, information will be disseminated using the following categories: Men+, Women+. Individuals in the "non-binary persons" category are distributed in the other two gender categories and are denoted by the "+" symbol. |
||||
- The changes in gaps between Indigenous men+ and women+ compared to their non-Indigenous counterparts were mostly similar in terms of direction and strength.
- A large narrowing of the gaps was observed for both Indigenous men+ and Indigenous women+ compared to the non-Indigenous population.
- The full dataset for this table is available in Appendix A – Table A2.6.
Employment rate
The employment rate is another way to measure a population's economic health. This rate is the percentage of the working-age population (aged 25 to 64) that has a job. As seen in 2021, 538,415 Indigenous individuals aged 25 to 64 were employed, up 7.1% since 2016 (Table 6). For a full list of all data tables relevant to the employment rate, please see Appendix A, tables A3.1 to A3.6.
| 2016 | 2021 | Difference | Percentage Change | |
|---|---|---|---|---|
| Registered Indian on reserve | 69,235 | 66,880 | -2,355 | -3.4% |
| Registered Indian off reserve | 149,770 | 159,790 | 10,020 | 6.7% |
| Non-Status Indian | 68,565 | 85,290 | 16,725 | 24.4% |
| Inuit | 16,135 | 17,175 | 1,040 | 6.4% |
| Métis | 199,220 | 209,280 | 10,060 | 5.0% |
| Non-Indigenous | 13,764,415 | 13,847,435 | 83,020 | 0.6% |
Source: Indigenous Services Canada. Custom Tabulations, 2016 to 2021 Census of Population. |
||||
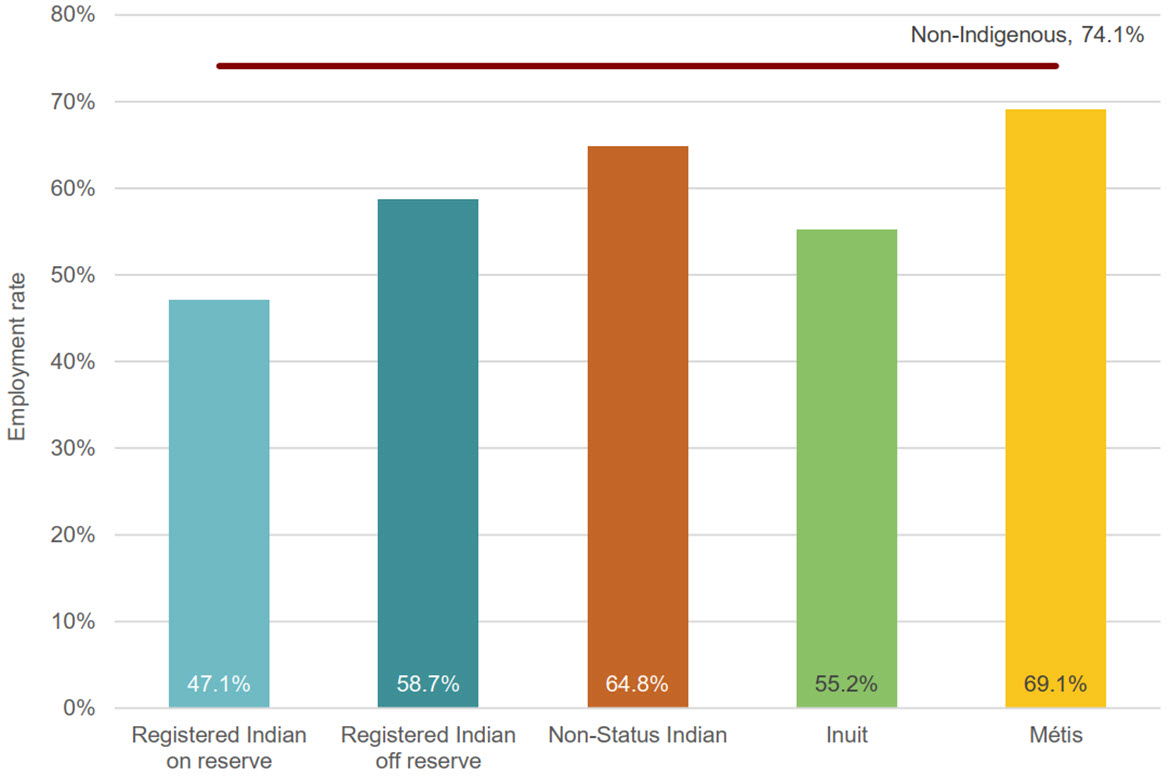
Text alternative for Figure 15: Employment rate, 2021, Indigenous and non-Indigenous populations, aged 25 to 64, Canada
| Registered Indian on reserve | Registered Indian off reserve | Non-Status Indian | Inuit | Métis | Non-Indigenous |
|---|---|---|---|---|---|
| 47.1% | 58.7% | 64.8% | 55.2% | 69.1% | 74.1% |
Source: Indigenous Services Canada. Custom Tabulations, 2021 Census of Population.
- Employment rates among Indigenous Peoples in 2021 were highest for Métis (69.1%) and lowest for Registered Indians on reserve (47.1%).
- Indigenous groups presented lower employment rates than the non-Indigenous population (74.1%), particularly Registered Indians living on reserve (a gap of 27.0 percentage points).
- Large gaps in employment rates were also found for Inuit (18.9 percentage points) and Registered Indians living off reserve (15.4 percentage points).
- By contrast, a smaller gap was observed for Non-Status Indians (9.3 percentage points). The smallest gap was found for Métis at 5.0 percentage points.
- The full dataset for this figure is available in Appendix A – Table A3.1.

Text alternative for Figure 16: Employment rate, 2001 to 2021, Indigenous and non-Indigenous populations, aged 25 to 64, Canada
| Registered Indian on reserve | Registered Indian off reserve | Non-Status Indian | Inuit | Métis | Non-Indigenous | |
|---|---|---|---|---|---|---|
| 2001 | 48.1% | 56.4% | 63.3% | 59.0% | 67.9% | 75.1% |
| 2006 | 50.2% | 61.8% | 67.4% | 59.7% | 71.5% | 76.3% |
| 2011 | 46.8% | 61.2% | 67.0% | 58.6% | 71.6% | 75.8% |
| 2016 | 46.9% | 60.2% | 66.1% | 57.4% | 70.4% | 76.0% |
| 2021 | 47.1% | 58.7% | 64.8% | 55.2% | 69.1% | 74.1% |
Source: Indigenous Services Canada. Custom Tabulations, 2021 Census of Population.
- Employment rates were relatively stable from 2001 to 2021, with each Indigenous group showing little overall change, although trends differed substantially across groups.
- Among Registered Indians on reserve, the employment rate decreased by 1.0 percentage points, from 48.1% in 2001 to 47.1% in 2021.
- Among Inuit, the drop in employment rate was slightly more pronounced at 3.8 percentage points, from 59.0% in 2001 to 55.2% in 2021.
- Over this period, Registered Indians living off reserve, Non-Status Indians and Métis saw small employment rate increases of 2.3, 1.5 and 1.2 percentage points, respectively, from 2001 to 2021.
- The gap in employment rates compared to the non-Indigenous population decreased for all Indigenous groups, with the exception of Registered Indians living on reserve and Inuit. While the gap for Registered Indians living on reserve fluctuated over the years, it was identical in 2001 and 2021 at 27.0 percentage points.
- By contrast, this gap increased for the Inuit population, from 16.1% in 2001 to 18.9% in 2021 (representing a widening of 2.8 percentage points).
- The full dataset for this figure is available in Appendix A – Table A3.2.
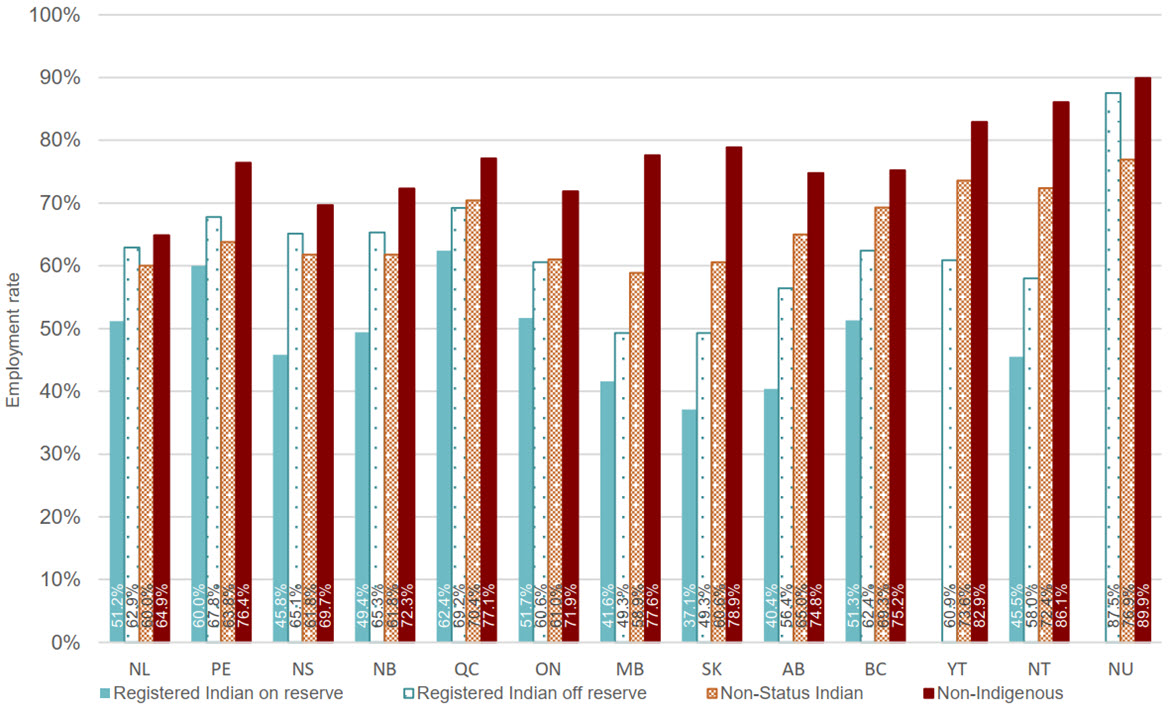
Text alternative for Figure 17: Employment rate, 2021, First Nations and non-Indigenous populations, aged 25 to 64, by region
| Registered Indian on reserve | Registered Indian off reserve | Non-Status Indian | Non-Indigenous | |
|---|---|---|---|---|
| Newfoundland and Labrador | 51.2% | 62.9% | 60.0% | 64.9% |
| Prince Edward Island | 60.0% | 67.8% | 63.8% | 76.4% |
| Nova Scotia | 45.8% | 65.1% | 61.8% | 69.7% |
| New Brunswick | 49.4% | 65.3% | 61.8% | 72.3% |
| Quebec | 62.4% | 69.2% | 70.4% | 77.1% |
| Ontario | 51.7% | 60.6% | 61.0% | 71.9% |
| Manitoba | 41.6% | 49.3% | 58.9% | 77.6% |
| Saskatchewan | 37.1% | 49.3% | 60.6% | 78.9% |
| Alberta | 40.4% | 56.4% | 65.0% | 74.8% |
| British Columbia | 51.3% | 62.4% | 69.3% | 75.2% |
| Yukon | 60.9% | 73.6% | 82.9% | |
| Northwest Territories | 45.5% | 58.0% | 72.4% | 86.1% |
| Nunavut | 87.5% | 76.9% | 89.9% |
Source: Indigenous Services Canada. Custom Tabulations, 2021 Census of Population.
- In 2021, the employment rate among First Nations varied widely across the provinces and territories.
- For Registered Indians living on reserve, the employment rate ranged from 37.1% in Saskatchewan to 62.4% in Quebec. For those living off reserve, the employment rate ranged from 49.3% in Manitoba and Saskatchewan to 87.5% in Nunavut. For Non-Status Indians, the employment rate was lowest in Manitoba (58.9%) and highest in Nunavut (76.9%).
- Manitoba, Saskatchewan and the Northwest Territories stood out with the largest gaps between the non-Indigenous and First Nations populations.
- In Saskatchewan in particular, the gaps were 41.8 percentage points for Registered Indians living on reserve, 29.6 percentage points for Registered Indians living off reserve, and 18.3 percentage points for Non-Status Indians.
- The full dataset for this figure is available in Appendix A – Table A3.3.
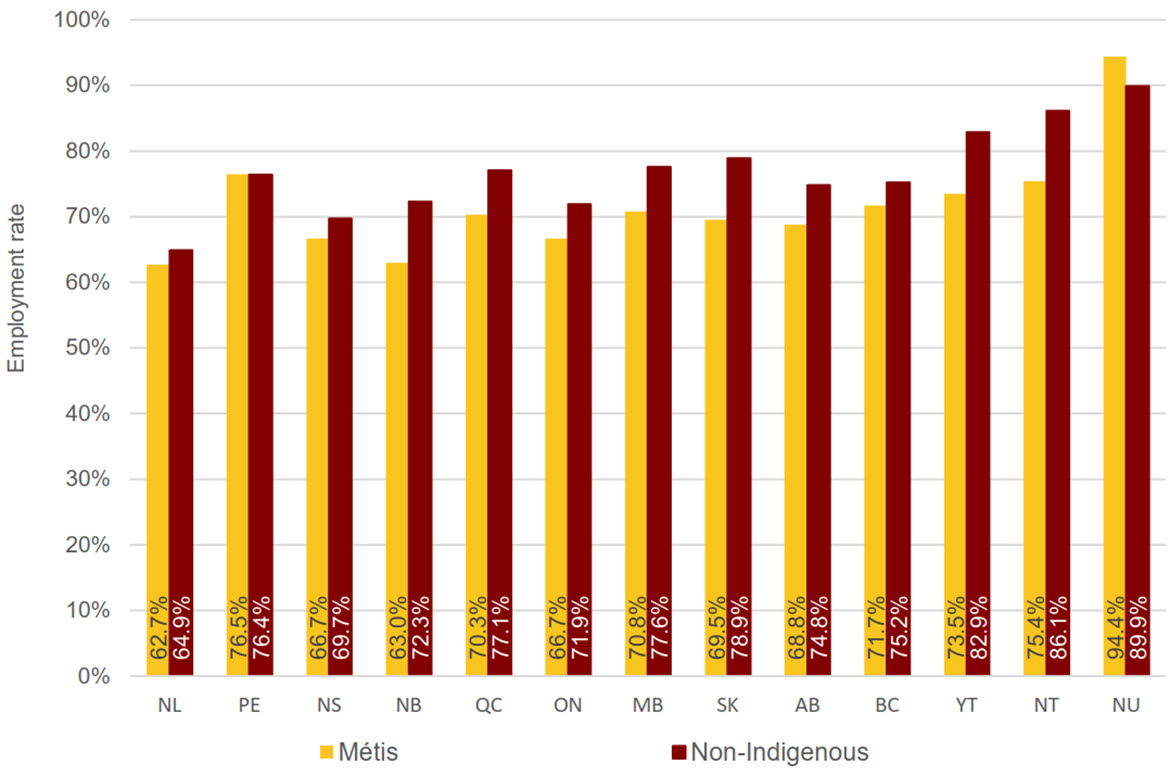
Text alternative for Figure 18: Employment rate, 2021, Métis and non-Indigenous populations, aged 25 to 64, by region
| Métis | Non-Indigenous | |
|---|---|---|
| Newfoundland and Labrador | 62.7% | 64.9% |
| Prince Edward Island | 76.5% | 76.4% |
| Nova Scotia | 66.7% | 69.7% |
| New Brunswick | 63.0% | 72.3% |
| Quebec | 70.3% | 77.1% |
| Ontario | 66.7% | 71.9% |
| Manitoba | 70.8% | 77.6% |
| Saskatchewan | 69.5% | 78.9% |
| Alberta | 68.8% | 74.8% |
| British Columbia | 71.7% | 75.2% |
| Yukon | 73.5% | 82.9% |
| Northwest Territories | 75.4% | 86.1% |
| Nunavut | 94.4% | 89.9% |
Source: Indigenous Services Canada. Custom Tabulations, 2021 Census of Population.
- The employment rate for Métis ranged from 62.7% in Newfoundland and Labrador to 94.4% in Nunavut.
- The gaps in employment rate compared to the non-Indigenous population were widest in the Northwest Territories (10.7 percentage points), Yukon and Saskatchewan (9.4 percentage points each), and New Brunswick (9.3 percentage points).
- The gaps were narrowest in Nunavut, where the employment rate of Métis surpassed that of the non-Indigenous population by 4.5 percentage points, and in Prince Edward Island, where the rates of both populations were the same.
- The full dataset for this figure is available in Appendix A – Table A3.4.
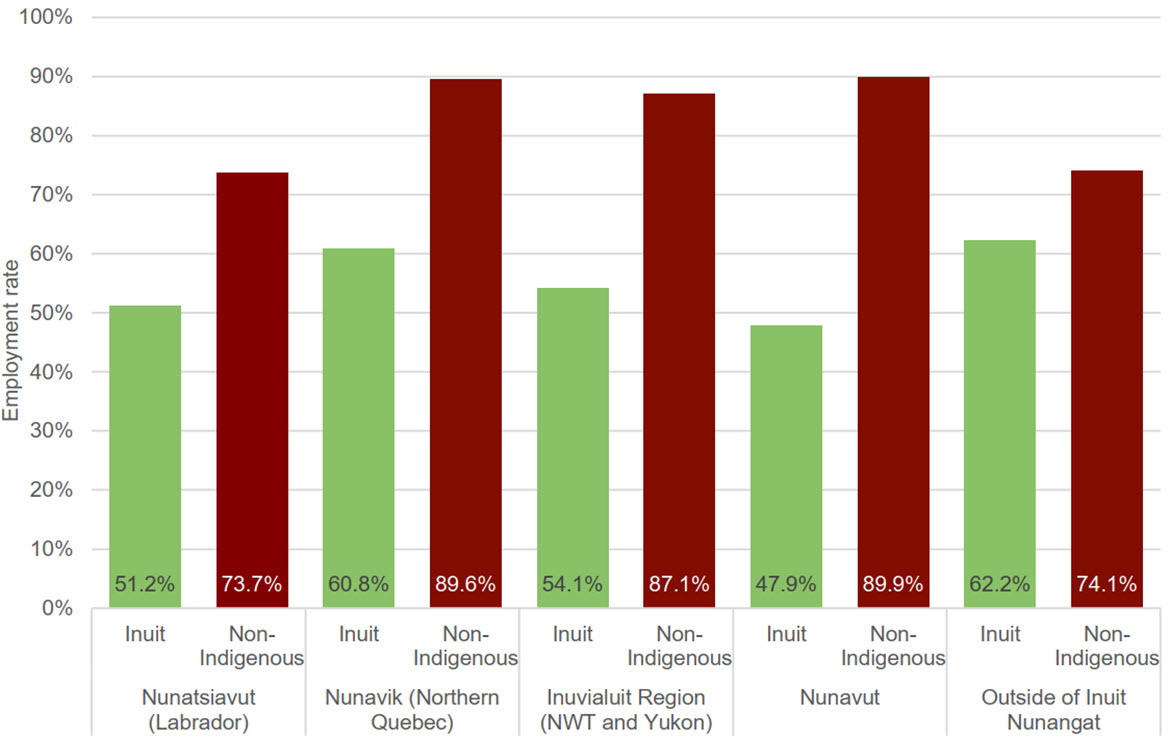
Text alternative for Figure 19: Employment rate, 2021, Inuit and non-Indigenous populations, aged 25 to 64, by Inuit region
| Nunatsiavut (Labrador) | Nunavik (Northern Quebec) | Inuvialuit Region (Northwest Territories and Yukon) | Nunavut | Outside of Inuit Nunangat | |||||
|---|---|---|---|---|---|---|---|---|---|
| Inuit | Non-Indigenous | Inuit | Non-Indigenous | Inuit | Non-Indigenous | Inuit | Non-Indigenous | Inuit | Non-Indigenous |
| 51.2% | 73.7% | 60.8% | 89.6% | 54.1% | 87.1% | 47.9% | 89.9% | 62.2% | 74.1% |
Source: Indigenous Services Canada. Custom Tabulations, 2021 Census of Population.
- In 2021, the employment rate among Inuit within Inuit Nunangat ranged from 47.9% in Nunavut to 60.8% in Nunavik. Outside Inuit Nunangat, the employment rate was 62.2%.
- The gaps in employment rate compared to the non-Indigenous were smallest outside Inuit Nunangat (11.9 percentage points).
- Inside Inuit Nunangat, the smallest gap was in Nunatsiavut (22.5 percentage points) and the largest in Nunavut (42 percentage points).
- The full dataset for this figure is available in Appendix A – Table A3.5.
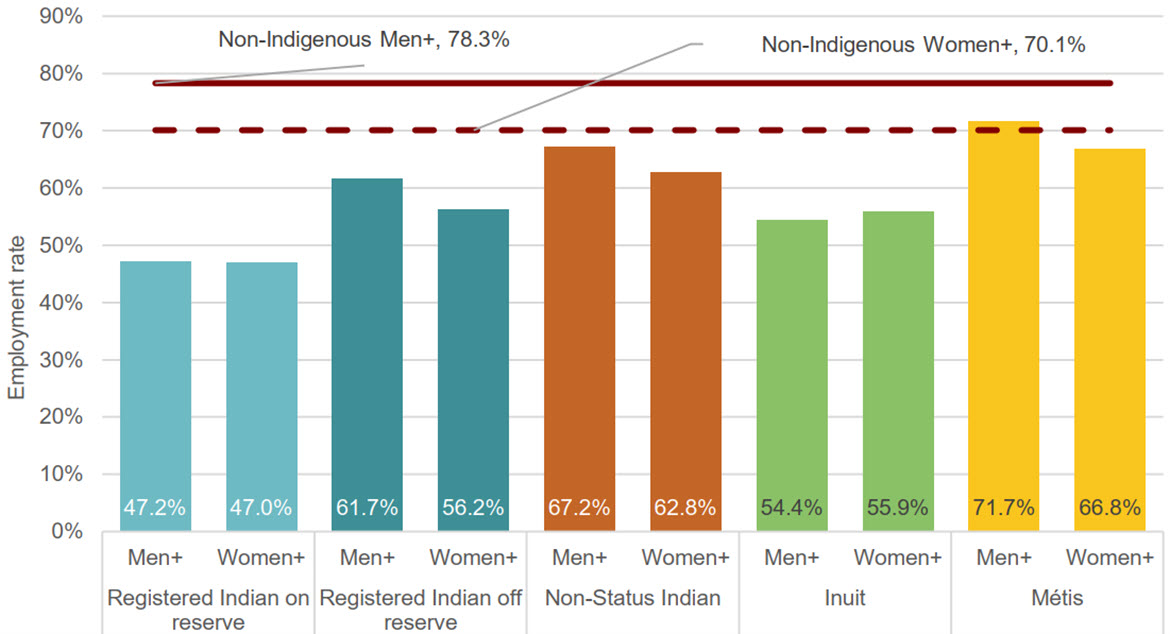
Text alternative for Figure 20: Employment rate, 2021, Indigenous and non-Indigenous populations, aged 25 to 64, by gender, Canada
| Men+ Percentage | Women+ Percentage | |
|---|---|---|
| Registered Indian on reserve | 47.2% | 47.0% |
| Registered Indian off reserve | 61.7% | 56.2% |
| Non-Status Indian | 67.2% | 62.8% |
| Inuit | 54.4% | 55.9% |
| Métis | 71.7% | 66.8% |
| Non-Indigenous | 78.3% | 70.1% |
Source: Indigenous Services Canada. Custom Tabulations, 2021 Census of Population.
Note: Given that the non-binary population is small, Statistics Canada produced a two-category gender variable that was applied to prevent disclosure of identifiable data for lower levels of geography when necessary. Consequently, information will be disseminated using the following categories: Men+, Women+. Individuals in the "non-binary persons" category are distributed in the other two gender categories and are denoted by the "+" symbol.
- The gaps in employment rates between the Indigenous and non-Indigenous populations were larger among men+ than among women+. This trend was also reflected among the different Indigenous groups.
- The gap between Registered Indian women+ living on reserve and non-Indigenous women+ was 23.1 percentage points, whereas the gap between Registered Indian men+ on reserve and non-Indigenous men+ was 31.1 percentage points.
- Both Registered Indian men+ and women+ living on reserve had the largest gaps in employment rate compared to their respective non-Indigenous populations, followed by Inuit, Registered Indians off reserve, Non-Status Indians and Métis.
- When comparing men+ and women+, men+ had higher employment rates in all Indigenous groups, with the exception of Inuit where women were slightly (1.5 percentage points) more likely to be employed.
- Registered Indian men+ and women+ were close to parity in employment rates.
- The full dataset for this figure is available in Appendix A – Table A3.6.
Measuring the gap
| 2016 | 2021 | Five-Year Change | ||||
|---|---|---|---|---|---|---|
| Percentage | Gap | Percentage | Gap | Percentage | Percentage change in gap | |
| Registered Indian on reserve | 46.9% | -29.1% | 47.1% | -27.0% | 0.2% | -7.2% |
| Registered Indian off reserve | 60.2% | -15.8% | 58.7% | -15.4% | -1.5% | -2.5% |
| Non-Status Indian | 66.1% | -9.9% | 64.8% | -9.3% | -1.3% | -6.1% |
| Inuit | 57.4% | -18.6% | 55.2% | -18.9% | -2.2% | 1.6% |
| Métis | 70.4% | -5.6% | 69.1% | -5.0% | -1.3% | -10.7% |
| Non-Indigenous | 76.0% | 74.1% | -1.9% | |||
Source: Indigenous Services Canada. Custom Tabulations, 2016 to 2021 Census of Population. |
||||||
- For Métis, Registered Indians on reserve and Non-Status Indians, there was a small narrowing of the gap in employment rate, ranging from 6.1 to 10.7%, compared to the non-Indigenous population.
- For the Registered Indians off reserve and Inuit groups, the gap in employment rate compared to the non-Indigenous population remained relatively stable from 2016 to 2021.
| Men+ | Women+ | |||
|---|---|---|---|---|
| Percentage | Percentage change in gap | Percentage | Percentage change in gap | |
| Registered Indian on reserve | 1.7% | -9.9% | -1.2% | -3.3% |
| Registered Indian off reserve | -2.1% | 2.5% | -1.1% | -6.1% |
| Non-Status Indian | -1.7% | 0.0% | -0.9% | -13.1% |
| Inuit | -2.5% | 3.5% | -1.9% | -0.7% |
| Métis | -0.9% | -10.8% | -1.6% | -10.8% |
| Non-Indigenous | -1.7% | -2.0% | ||
Source: Indigenous Services Canada. Custom Tabulations, 2016 to 2021 Census of Population. Note: Given that the non-binary population is small, Statistics Canada produced a two-category gender variable that was applied to prevent disclosure of identifiable data for lower levels of geography when necessary. Consequently, information will be disseminated using the following categories: Men+, Women+. Individuals in the "non-binary persons" category are distributed in the other two gender categories and are denoted by the "+" symbol. |
||||
- A small narrowing of the gap was observed in Registered Indian men+ living on reserve and Métis men+; otherwise, the gap in employment rate between Indigenous men+ and non-Indigenous men+ remained relatively stable between 2016 and 2021.
- Similarly, small declines in gaps were observed in Registered Indian women+ living off reserve, Non-Status Indian women+ and Métis women+.
- The gaps observed in Inuit men+ and women+ were relatively stable between 2016 and 2021.
- The full dataset for this table is available in Appendix A – Table A3.6.
Employment income
The median employment income measure complements employment rates, as it is a common way to assess the quality of jobs held by the employed population. For a full list of all data tables relevant to employment income, please see Appendix A, tables A4.1 to A4.6.
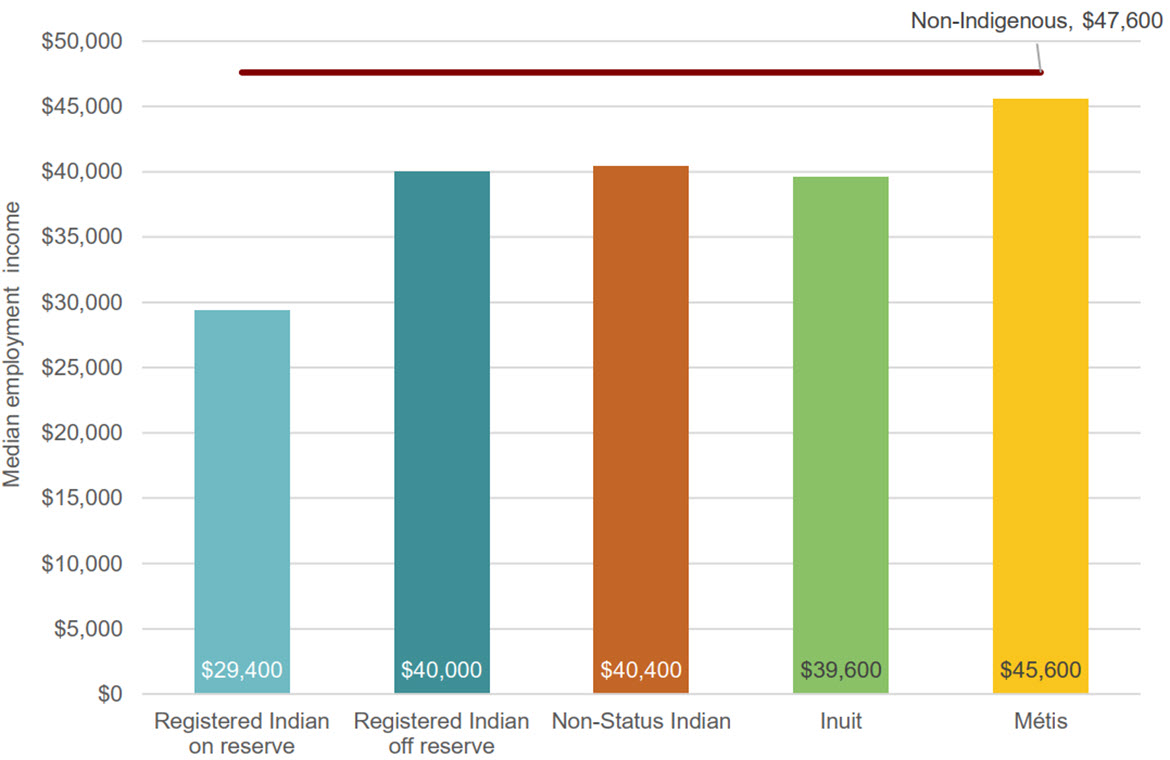
Text alternative for Figure 21: Median employment income, 2020, Indigenous and non-Indigenous populations, aged 25 to 64, Canada
| Registered Indian on reserve | Registered Indian off reserve | Non-Status Indian | Inuit | Métis | Non-Indigenous |
|---|---|---|---|---|---|
| $29,400 | $40,000 | $40,400 | $39,600 | $45,600 | $47,600 |
Source: Indigenous Services Canada. Custom Tabulations, 2021 Census of Population.
- The median employment income differed markedly across Indigenous groups, ranging from $29,400 for Registered Indians on reserve to $45,600 for Métis.
- In 2020, the gap in median employment income was largest between Registered Indians on reserve and the non-Indigenous population, at $18,200, and smallest between Métis and the non-Indigenous population, at $2,000.
- The full dataset for this figure is available in Appendix A – Table A4.1.
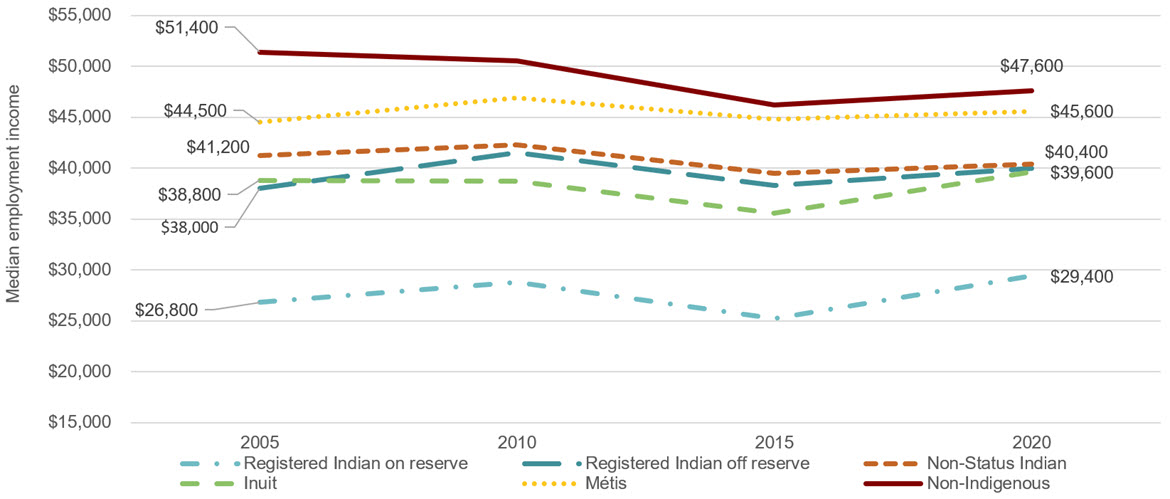
Text alternative for Figure 22: Median employment income, 2005 to 2020 (adjusted), Indigenous and non-Indigenous populations, aged 25 to 64, Canada
| Registered Indian on reserve | Registered Indian off reserve | Non-Status Indian | Inuit | Métis | Non-Indigenous | |
|---|---|---|---|---|---|---|
| 2005 | $26,800 | $38,000 | $41,200 | $38,800 | $44,500 | $51,400 |
| 2010 | $28,800 | $41,500 | $42,300 | $38,700 | $46,900 | $50,500 |
| 2015 | $25,200 | $38,300 | $39,500 | $35,600 | $44,800 | $46,200 |
| 2020 | $29,400 | $40,000 | $40,400 | $39,600 | $45,600 | $47,600 |
Source: Indigenous Services Canada. Custom Tabulations, 2006 to 2021 Census of Population.
Note: The dollar values have been adjusted for inflation and are stated in terms of their value in 2020.
- With the exception of Non-Status Indians (-$800), each Indigenous group made more money in 2020 than in 2005. These increases ranged from $760 for Inuit to $2,600 a year for Registered Indians living on reserve, after accounting for inflation.
- The median employment income decreased by $3,800 for the non-Indigenous population during the same time period.
- As a result, the gap in median employment income compared to the non-Indigenous population diminished for all Indigenous groups from 2005 to 2020, narrowing to the greatest extent for Registered Indians living on reserve (total of $6,400), followed by Registered Indians off reserve ($5,800), Métis ($4,900), Inuit ($4,600) and Non-Status Indians ($3,000).
- The full dataset for this figure is available in Appendix A – Table A4.2.
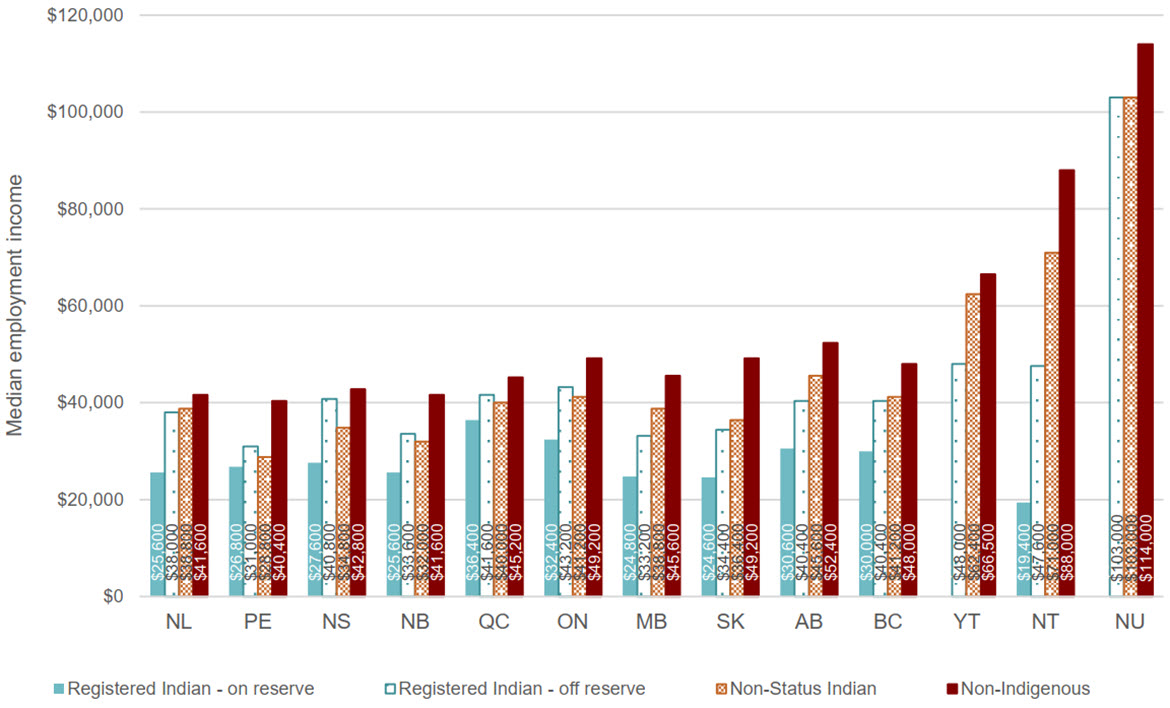
Text alternative for Figure 23: Median employment income, 2020, First Nations and non-Indigenous populations, aged 25 to 64, by region
| Registered Indian on reserve | Registered Indian off reserve | Non-Status Indian | Non-Indigenous | |
|---|---|---|---|---|
| Newfoundland and Labrador | $25,600 | $38,000 | $38,800 | $41,600 |
| Prince Edward Island | $26,800 | $31,000 | $28,800 | $40,400 |
| Nova Scotia | $27,600 | $40,800 | $34,800 | $42,800 |
| New Brunswick | $25,600 | $33,600 | $32,000 | $41,600 |
| Quebec | $36,400 | $41,600 | $40,000 | $45,200 |
| Ontario | $32,400 | $43,200 | $41,200 | $49,200 |
| Manitoba | $24,800 | $33,200 | $38,800 | $45,600 |
| Saskatchewan | $24,600 | $34,400 | $36,400 | $49,200 |
| Alberta | $30,600 | $40,400 | $45,600 | $52,400 |
| British Columbia | $30,000 | $40,400 | $41,200 | $48,000 |
| Yukon | $48,000 | $62,400 | $66,500 | |
| Northwest Territories | $19,400 | $47,600 | $71,000 | $88,000 |
| Nunavut | $103,000 | $103,000 | $114,000 |
Source: Indigenous Services Canada. Custom Tabulations, 2021 Census of Population.
- Notable disparities in median employment income appear when considering regional trends for First Nations populations. In Alberta, for example, the median employment income for First Nations ranged from $30,600 for Registered Indians living on reserve to $45,600 for Non-Status Indians. In the Northwest Territories, the median employment income was lowest for Registered Indians living on reserve, at $19,400, and highest for Non-Status Indians, at $71,000.
- Gaps in national median employment income can further conceal important regional differences.
- For Registered Indians living on reserve, the gap in median employment income compared to the non-Indigenous population was highest in the Northwest Territories ($68,600), followed by Saskatchewan ($24,600), and was lowest in Quebec ($8,800).
- Registered Indians living off reserve followed similar regional trends, although the gaps were not as large in the Northwest Territories ($40,400) and Saskatchewan ($14,800). The gap was smallest in Nova Scotia ($2,000).
- For Non-Status Indians, the gap was largest in the Northwest Territories ($17,000) and Saskatchewan ($12,800), and smallest in Newfoundland and Labrador ($2,800).
- The full dataset for this figure is available in Appendix A – Table A4.3.
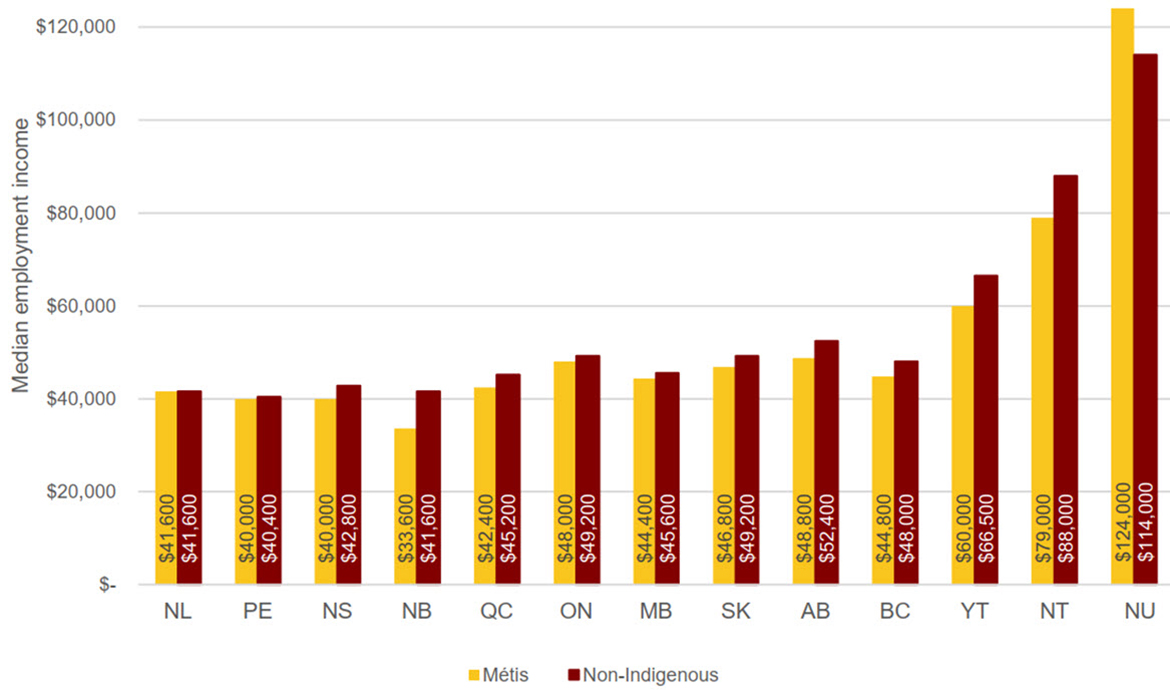
Text alternative for Figure 24: Median employment income, 2020, Métis and non-Indigenous populations, aged 25 to 64, by region
| Métis | Non-Indigenous | |
|---|---|---|
| Newfoundland and Labrador | $41,600 | $41,600 |
| Prince Edward Island | $40,000 | $40,400 |
| Nova Scotia | $40,000 | $42,800 |
| New Brunswick | $33,600 | $41,600 |
| Quebec | $42,400 | $45,200 |
| Ontario | $48,000 | $49,200 |
| Manitoba | $44,400 | $45,600 |
| Saskatchewan | $46,800 | $49,200 |
| Alberta | $48,800 | $52,400 |
| British Columbia | $44,800 | $48,000 |
| Yukon | $60,000 | $66,500 |
| Northwest Territories | $79,000 | $88,000 |
| Nunavut | $124,000 | $114,000 |
Source: Indigenous Services Canada. Custom Tabulations, 2021 Census of Population.
- The median employment income of the Métis population ranged from $33,600 in New Brunswick to $124,000 in in Nunavut.
- The small gap in median employment income observed for Métis at the national level was similarly small in most regions.
- The gap in median employment income compared to the non-Indigenous population was largest in Northwest Territories ($9,000) and New Brunswick ($8,000). In Newfoundland and Labrador, the median employment incomes of both populations were on par, while in Nunavut, the median income of Métis surpassed that of the non-Indigenous population by $10,000.
- The full dataset for this figure is available in Appendix A – Table A4.4.
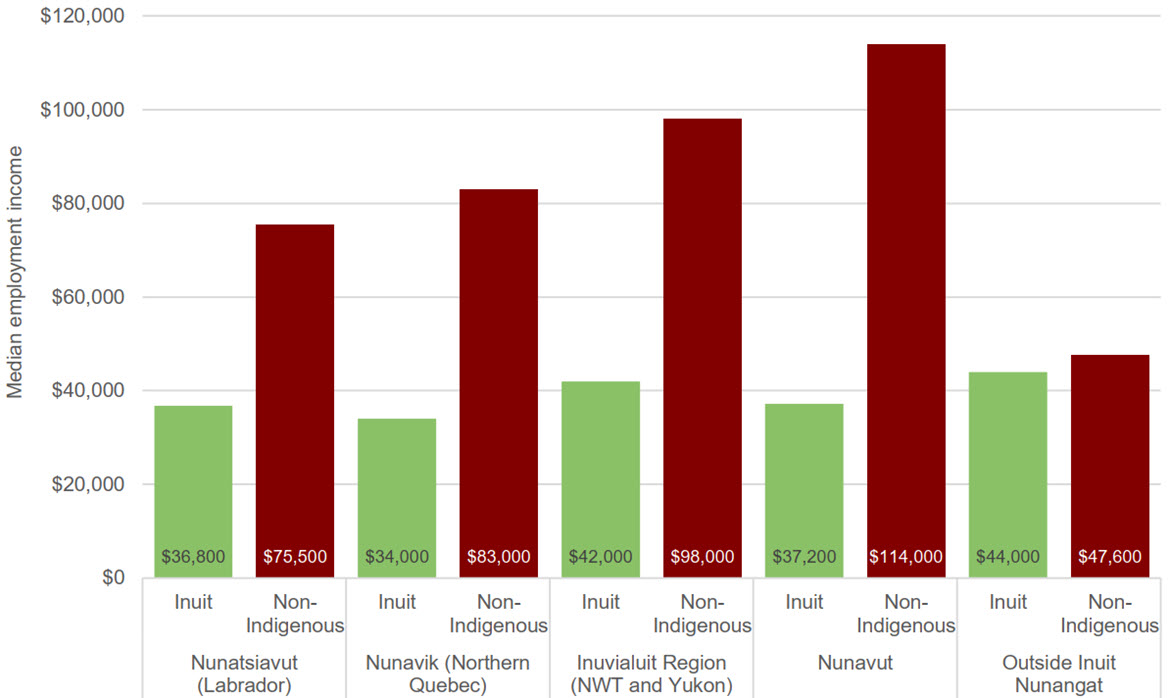
Text alternative for Figure 25: Median employment income, 2020, Inuit and non-Indigenous populations, aged 25 to 64, by Inuit region
| Nunatsiavut (Labrador) | Nunavik (Northern Quebec) | Inuvialuit Region (Northwest Territories and Yukon) | Nunavut | Outside Inuit Nunangat | |||||
|---|---|---|---|---|---|---|---|---|---|
| Inuit | Non-Indigenous | Inuit | Non-Indigenous | Inuit | Non-Indigenous | Inuit | Non-Indigenous | Inuit | Non-Indigenous |
| $36,800 | $75,500 | $34,000 | $83,000 | $42,000 | $98,000 | $37,200 | $114,000 | $44,000 | $47,600 |
Source: Indigenous Services Canada. Custom Tabulations, 2021 Census of Population.
- The median employment income among Inuit varied regionally. Outside Inuit Nunangat, the median income was $44,000. Inside Inuit Nunangat, the median income ranged from $36,800 in Nunatsiavut to $42,000 in the Inuvialuit Region.
- Outside Inuit Nunangat, the gap in median employment income for Inuit was relatively narrow, with Inuit earning $3,600 less then their non-Indigenous counterparts.
- Inside Inuit Nunangat, the gap between the Inuit and non-Indigenous populations was significantly larger, ranging from $38,700 in Nunatsiavut to $76,800 in Nunavut.
- The full dataset for this figure is available in Appendix A – Table A4.5.
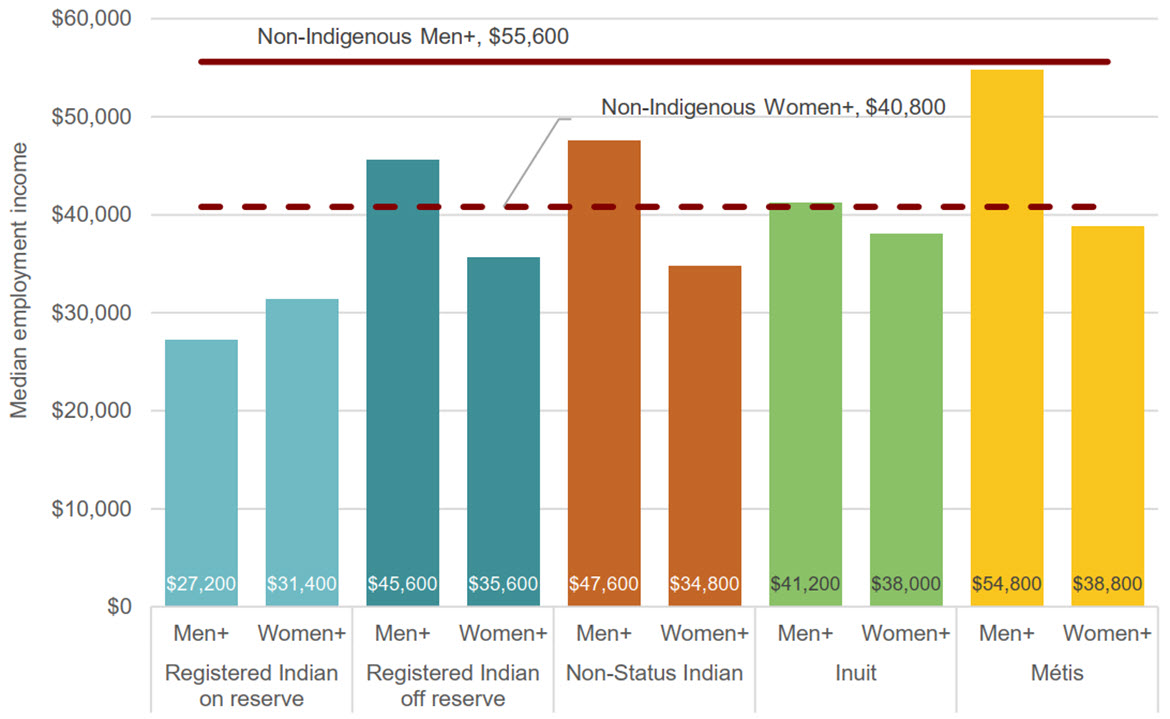
Text alternative for Figure 26: Median employment income, 2020, Indigenous and non-Indigenous populations, aged 25 to 64, by gender, Canada
| Men+ Income | Women+ Income | |
|---|---|---|
| Registered Indian on reserve | $27,200 | $31,400 |
| Registered Indian off reserve | $45,600 | $35,600 |
| Non-Status Indian | $47,600 | $34,800 |
| Inuit | $41,200 | $38,000 |
| Métis | $54,800 | $38,000 |
| Non-Indigenous | $55,600 | $40,800 |
Source: Indigenous Services Canada. Custom Tabulations, 2021 Census of Population.
Note: Given that the non-binary population is small, Statistics Canada produced a two-category gender variable that was applied to prevent disclosure of identifiable data for lower levels of geography when necessary. Consequently, information will be disseminated using the following categories: Men+, Women+. Individuals in the "non-binary persons" category are distributed in the other two gender categories and are denoted by the "+" symbol.
- The gap in median employment income between the Indigenous and non-Indigenous populations was generally larger among men+ than among women+.
- For men+, the largest gap was identified for Registered Indians living on reserve ($28,400), followed by Inuit ($14,400), Registered Indians living off reserve ($10,000), Non-Status Indians ($8,000) and Métis ($800).
- For women+, the largest gap was observed among Registered Indians living on reserve ($9,400), followed by Non-Status Indians ($6,000) and Registered Indians living off reserve ($5,200). The smallest gap was found among Inuit and Métis at $2,800 and $2,000, respectively.
- Men+ had higher median employment incomes than women+ for all Indigenous groups except Registered Indians living on reserve. In that group, women+ made an additional $4,200 over men+.
- The full dataset for this figure is available in Appendix A – Table A4.6.
Measuring the gaps
| 2016 | 2021 | Five-Year Change | ||||
|---|---|---|---|---|---|---|
| Income | Gap | Income | Gap | Income | Percentage change in gap | |
| Registered Indian on reserve | $25,200 | -$21,000 | $29,400 | -$18,200 | $4,200 | -13.3% |
| Registered Indian off reserve | $38,300 | -$7,900 | $40,000 | -$7,600 | $1,700 | -3.8% |
| Non-Status Indian | $39,500 | -$6,700 | $40,400 | -$7,200 | $900 | 7.5% |
| Inuit | $35,400 | -$10,800 | $39,600 | -$8,000 | $4,200 | -25.9% |
| Métis | $44,800 | -$1,400 | $45,600 | -$2,000 | $800 | 42.9% |
| Non-Indigenous | $46,200 | $47,600 | $1,400 | |||
Source: Indigenous Services Canada. Custom Tabulations, 2016 to 2021 Census of Population. Note: The 2015 dollar values have been adjusted for inflation and are stated in terms of their value in 2020. |
||||||
- After adjusting for inflation from 2015 to 2020, the comparison shows that all Indigenous groups saw an increase in employment income in terms of the amount earned; however, the gaps between each Indigenous group and the non-Indigenous population showed more variability.
- There was a large narrowing of the gap in employment income for Inuit, from $10,800 in 2015 to $8,000 in 2020.
- There was a medium narrowing of the gap for Registered Indians living on reserve (13.3%), while the gap in employment income remained relatively stable for Registered Indians living off reserve.
- There was a widening of the gap for Non-Status Indians and Métis. Both groups saw a small increase in dollar value between 2015 and 2020, of only $900 and $800 respectively.
| Men+ | Women+ | |||
|---|---|---|---|---|
| Income change | Percentage change in gap | Income change | Percentage change in gap | |
| Registered Indian on reserve | $5,000 | -1.4% | $7,200 | -21.0% |
| Registered Indian off reserve | $2,800 | 22.0% | $5,600 | -14.8% |
| Non-Status Indian | $3,100 | 23.1% | $4,600 | 1.7% |
| Inuit | $6,900 | -13.8% | $6,900 | -44.0% |
| Métis | $3,500 | -366.7% | $4,000 | 33.3% |
| Non-Indigenous | $4,600 | $4,700 | ||
Source: Indigenous Services Canada. Custom Tabulations, 2016 to 2021 Census of Population. Note: The 2015 dollar values have not been adjusted for inflation. Given that the non-binary population is small, Statistics Canada produced a two-category gender variable that was applied to prevent disclosure of identifiable data for lower levels of geography when necessary. Consequently, information will be disseminated using the following categories: Men+, Women+. Individuals in the "non-binary persons" category are distributed in the other two gender categories and are denoted by the "+" symbol. |
||||
- In general, Indigenous women+ saw greater narrowing of gaps in median employment income than Indigenous men+, although the results are somewhat mixed.
- Among Inuit men+, there was a small narrowing of the gap in median employment income compared to the non-Indigenous population, at 13.8%.
- For Métis men+, the median employment income was above that of the non-Indigenous population in 2015; the opposite was true in 2020, leading to the seemingly large change in the gap (366.7%), but in reality the change was actually very small.
- There was a medium widening of gaps for Registered Indian men+ off reserve and Non-Status Indian men+, at 22.0 and 23.1%, respectively.
- Registered Indian women+ off reserve saw a medium narrowing of the gap (14.8%), while Registered Indian women+ living on reserve and Inuit women+ experienced a large narrowing of gaps at 21.0 and 44.0%, respectively.
- Like Métis men+, Métis women+ also saw a widening of the gap, at 33.3%.
- The full dataset for this figure is available in Appendix A – Table A4.6.
Education – having at least a high school credential
In addition to being a baseline requirement for many careers, completion of a formal education at the high school level or above has the benefit of ensuring that individuals have the literacy, numeracy and other skills they need to participate fully in Canada's economy and in civil society, and to effectively access the services and benefits to which they are entitled. As with most measures, high school completion can be assessed in a number of ways. The census measures the highest level of education each person has achieved. All individuals who have a high school diploma or equivalency degree or who have engaged in any form of post-secondary education (e.g., university, college or trade school) are considered to have at least a high school credential. As seen in Table 11, there were 80,280 more Indigenous people with a high school education in 2021 than in 2016. For a full list of all data tables relevant to high school completion, please see Appendix A, tables A5.1 to A5.7.
Changes in a population's education levels tend to start with youth. As the availability of and need for formal education expands, young people strive to obtain the credentials they need to achieve their career goals. Although older adults can and do obtain additional educational credentials, most people complete their formal education when they are relatively young. Looking at the educational attainment of younger cohorts can therefore provide some insight into how the overall gap in education can be expected to change in the future. Simply put, if the gaps are smaller among younger cohorts (under 25 years of age), the overall gaps are in the process of narrowing.
| 2016 | 2021 | Difference | Percentage Change | |
|---|---|---|---|---|
| Registered Indian on reserve | 84,195 | 85,120 | 925 | 1.1% |
| Registered Indian off reserve | 186,520 | 212,670 | 26,150 | 14.0% |
| Non-Status Indian | 83,265 | 108,810 | 25,545 | 30.7% |
| Inuit | 15,710 | 17,440 | 1,730 | 11.0% |
| Métis | 232,905 | 258,835 | 25,930 | 11.1% |
| Non-Indigenous | 16,151,880 | 16,944,150 | 792,270 | 4.9% |
Source: Indigenous Services Canada. Custom Tabulations, 2016 to 2021 Census of Population. |
||||

Text alternative for Figure 27: Percentage of people with at least a high school credential, 2021, Indigenous and non-Indigenous populations, aged 25 to 64, Canada
| Registered Indian on reserve | Registered Indian off reserve | Non-Status Indian | Inuit | Métis | Non-Indigenous |
|---|---|---|---|---|---|
| 59.9% | 78.2% | 82.7% | 56.0% | 85.5% | 90.7% |
Source: Indigenous Services Canada. Custom Tabulations, 2021 Census of Population.
- High school completion rates varied substantially among the Indigenous groups. The percentage of individuals aged 25 to 64 with at least a high school credential was highest among Métis (85.5%) and lowest among Inuit (56.0%).
- The largest gap in high school completion compared to the non-Indigenous population was found for Inuit (34.7 percentage points), followed by Registered Indians living on reserve (30.8 percentage points) and Registered Indians living off reserve (12.5 percentage points).
- By contrast, the gaps for Non-Status Indians (8.0 percentage points) and Métis (5.2 percentage points) were smaller.
- The full dataset for this figure is available in Appendix A – Table A5.1.
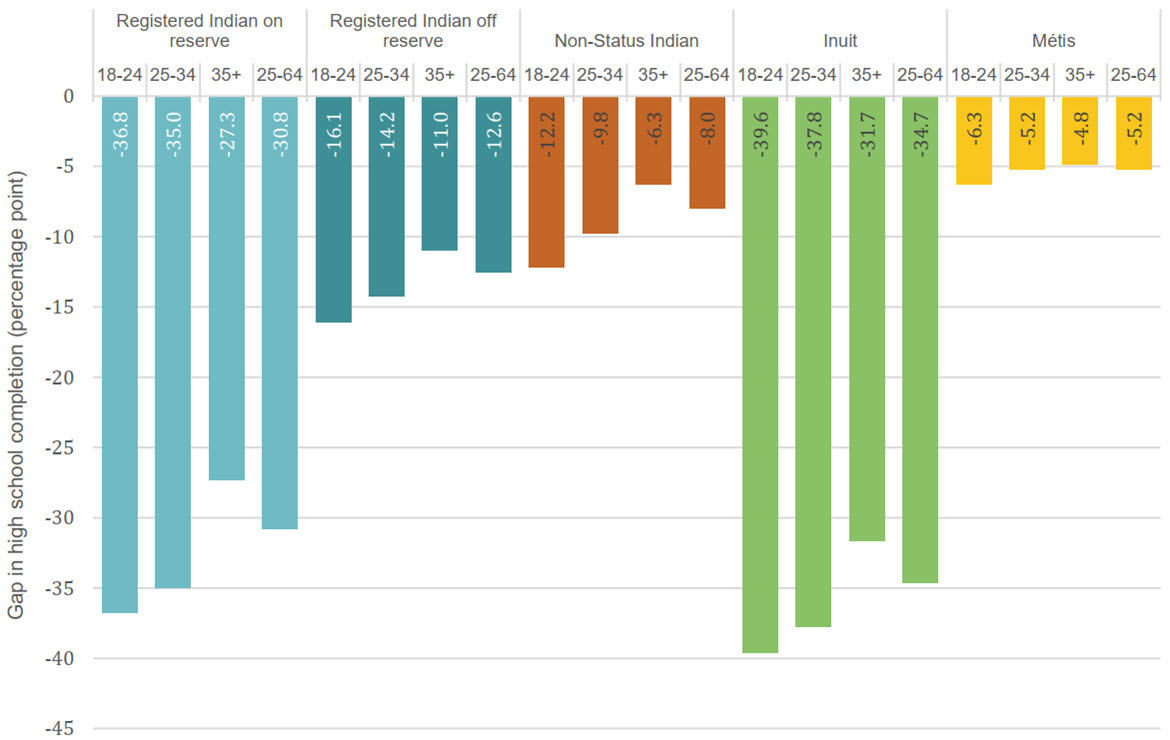
Text alternative for Figure 28: Gap in high school completion (in percentage points) between Indigenous and non-Indigenous populations, aged 18 to 24, 25 to 34, 35+ and 25 to 64, 2021, Canada
| Registered Indian on reserve | Registered Indian off reserve | Non-Status Indian | Inuit | Métis | |||||||||||||||
|---|---|---|---|---|---|---|---|---|---|---|---|---|---|---|---|---|---|---|---|
| 18 to 24 | 25 to 35 | 35+ | 25 to 64 | 18 to 24 | 25 to 35 | 35+ | 25 to 64 | 18 to 24 | 25 to 35 | 35+ | 25 to 64 | 18 to 24 | 25 to 35 | 35+ | 25 to 64 | 18 to 24 | 25 to 35 | 35+ | 25 to 64 |
| -36.8 | -35.0 | -27.3 | -30.8 | -16.1 | -14.2 | -11.0 | -12.6 | -12.2 | -9.8 | -6.3 | -8.0 | -39.6 | -37.8 | -31.7 | -34.7 | -6.3 | -5.2 | -4.8 | -5.2 |
Source: Indigenous Services Canada. Custom Tabulations, 2021 Census of Population.
- The gaps in high school completion compared to the non-Indigenous population were largest for the youngest cohort (aged 18-24) and smallest for those aged 35+ across all Indigenous groups.
- The largest disparities compared to the non-Indigenous population were observed among Inuit aged 18 to 24 and 25 to 34, where the differences were 39.6 and 37.8 percentage points, respectively. The gaps for Registered Indians on reserve aged 18 to 24 and 25 to 34 living on reserve were also particularly high at 36.9 and 35.0 percentage points, respectively.
- Differences between the youngest (18 to 24) and oldest (35+) cohorts were highest among Registered Indians on reserve (6.6 percentage point difference) and Inuit (5.4 percentage point difference).
- Métis had the smallest gaps compared to the non-Indigenous population, at 5.2 percentage points for those aged 24 to 34 and 6.3 for those aged 18 to 24, as well as the smallest changes between the age cohorts, with only a 1.6 percentage point difference between the youngest and oldest cohorts.
- The gap among the working-age (aged 25 to 64) population is also provided for comparison, as this age cohort presents the standard used throughout this section of the report.
- The full dataset for this figure is available in Appendix A – Table A5.2.
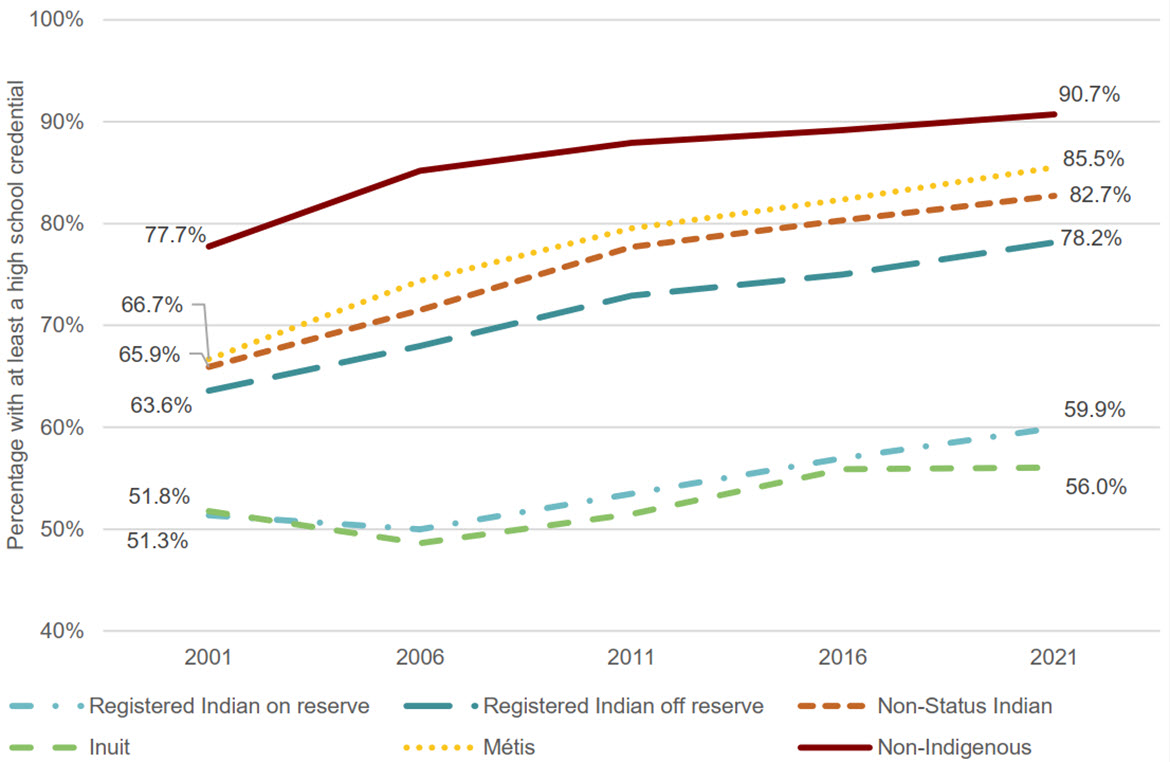
Text alternative for Figure 29: Percentage of people with at least a high school credential, 2001 to 2021, Indigenous and non-Indigenous populations, aged 25 to 64, Canada
| Registered Indian on reserve | Registered Indian off reserve | Non-Status Indian | Inuit | Métis | Non-Indigenous | |
|---|---|---|---|---|---|---|
| Newfoundland and Labrador | 60.1% | 87.3% | 87.2% | 80.9% | 85.9% | 87.6% |
| Prince Edward Island | 68.0% | 89.0% | 86.2% | 100.0% | 90.6% | 91.0% |
| Nova Scotia | 75.4% | 88.3% | 87.7% | 86.0% | 86.7% | 90.3% |
| New Brunswick | 72.6% | 84.3% | 83.4% | 81.8% | 86.1% | 89.3% |
| Quebec | 58.5% | 79.5% | 81.9% | 45.0% | 83.3% | 88.5% |
| Ontario | 62.4% | 82.2% | 83.4% | 81.0% | 88.5% | 91.4% |
| Manitoba | 51.3% | 71.4% | 74.9% | 79.5% | 84.1% | 90.6% |
| Saskatchewan | 58.5% | 75.5% | 75.9% | 78.6% | 84.8% | 91.8% |
| Alberta | 53.5% | 75.8% | 81.7% | 83.1% | 83.6% | 90.9% |
| British Columbia | 68.5% | 78.8% | 82.8% | 85.8% | 86.6% | 92.6% |
| Yukon | 73.4% | 81.3% | 68.0% | 87.9% | 93.8% | |
| Northwest Territories | 31.8% | 59.0% | 77.6% | 55.5% | 79.8% | 94.2% |
| Nunavut | 81.3% | 84.6% | 42.7% | 88.9% | 94.9% |
Source: Indigenous Services Canada. Custom Tabulations, 2021 Census of Population.
- High school completion rates gradually increased from 2001 to 2021 for all Indigenous groups, as well as for the non-Indigenous population. Registered Indians living on reserve, for example, experienced a 8.6% increase, while Registered Indians those living off reserve saw an increase of 14.6 percentage points.
- Although the proportion of Registered Indians living on reserve with a high school education rose from 51.3% in 2001 to 59.9% in 2021, the gap compared to the non-Indigenous population widened slightly from 26.4 percentage points to 30.8 percentage points.
- Registered Indians living off reserve and Non-Status Indians reported similar high school completion rates, although the gap between Non-Status Indians and the non-Indigenous population was slightly smaller across all census years.
- Since 2021, Inuit have had the lowest proportion of high school completion of all the Indigenous groups and the largest gaps compared to the non-Indigenous population, ranging from 25.9 percentage points in 2001 to 36.6 in 2006.
- Métis have seen the largest increase in high school completion rates, from 66.7% in 2001 to 85.5% in 2021. During the same period, the gap compared to the non-Indigenous population shrunk at a steady pace, from 11.0 percentage points in 2001 to 5.2 percentage points in 2021.
- The full dataset for this figure is available in Appendix A – Table A5.3.
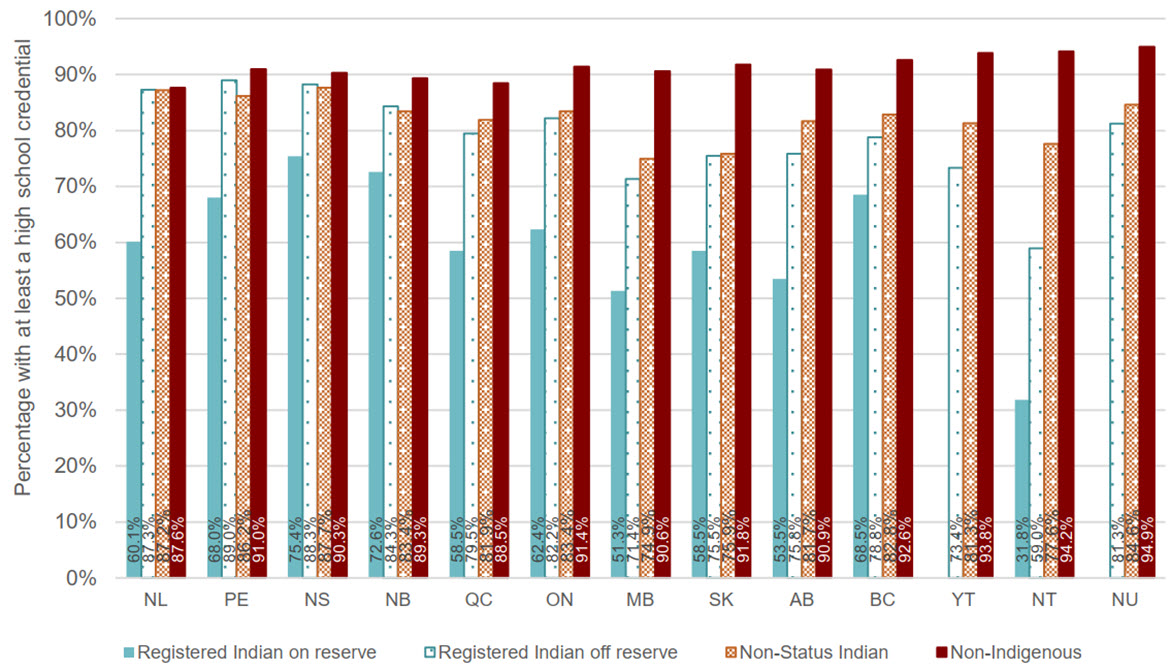
Text alternative for Figure 30: Percentage of people with at least a high school credential, 2021, First Nations and non-Indigenous populations, aged 25 to 64, by region
| Registered Indian on reserve | Registered Indian off reserve | Non-Status Indian | Non-Indigenous | |
|---|---|---|---|---|
| Newfoundland and Labrador | 60.1% | 87.3% | 87.2% | 87.6% |
| Prince Edward Island | 68.0% | 89.0% | 86.2% | 91.0% |
| Nova Scotia | 75.4% | 88.3% | 87.7% | 90.3% |
| New Brunswick | 72.6% | 84.3% | 83.4% | 89.3% |
| Quebec | 58.5% | 79.5% | 81.9% | 88.5% |
| Ontario | 62.4% | 82.2% | 83.4% | 91.4% |
| Manitoba | 51.3% | 71.4% | 74.9% | 90.6% |
| Saskatchewan | 58.5% | 75.5% | 75.9% | 91.8% |
| Alberta | 53.5% | 75.8% | 81.7% | 90.9% |
| British Columbia | 68.5% | 78.8% | 82.8% | 92.6% |
| Yukon | 73.4% | 81.3% | 93.8% | |
| Northwest Territories | 31.8% | 59.0% | 77.6% | 94.2% |
| Nunavut | 81.3% | 84.6% | 94.9% |
Source: Indigenous Services Canada. Custom Tabulations, 2021 Census of Population.
- High school completion rates vary considerably across the provinces and territories.
- For Registered Indians living on reserve, the highest high school completion rates were found in Nova Scotia (75.4%) and New Brunswick (72.6%). By contrast, the Northwest Territories displayed the lowest rate (31.8%) and the largest gap compared to the non-Indigenous population, at 62.4 percentage points.
- For Registered Indians living off reserve, the highest high school completion rates were found in Prince Edward Island (89.0%) and Nova Scotia (88.3%). Again, the Northwest Territories had the lowest rate (59.0%) and the largest gap (35.2 percentage points).
- High school completion rates for Non-Status Indians showed less variation, ranging from 74.9% in Manitoba to 87.7 in Nova Scotia. The largest gap was again found in the Northwest Territories (16.6 percentage points).
- The full dataset for this figure is available in Appendix A – Table A5.4.
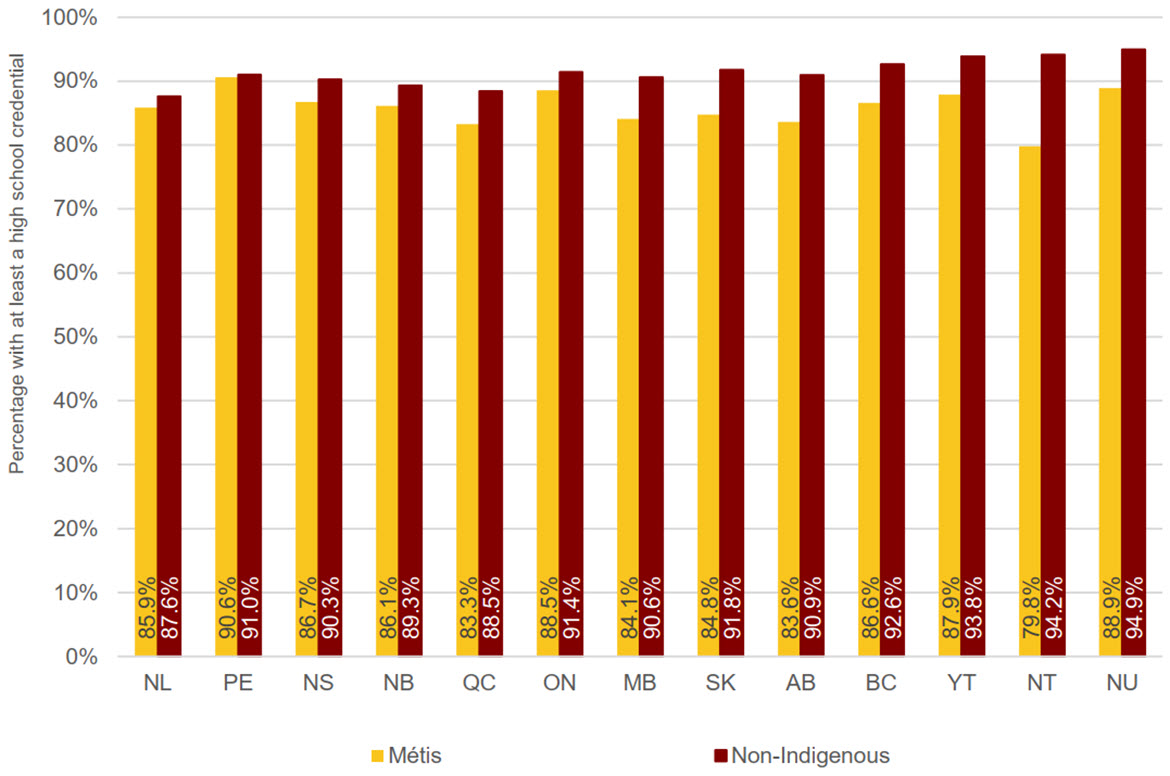
Text alternative for Figure 31: Percentage of people with at least a high school credential, 2021, Métis and non-Indigenous populations, aged 25 to 64, by region
| Métis | Non-Indigenous | |
|---|---|---|
| Newfoundland and Labrador | 85.9% | 87.6% |
| Prince Edward Island | 90.6% | 91.0% |
| Nova Scotia | 86.7% | 90.3% |
| New Brunswick | 86.1% | 89.3% |
| Quebec | 83.3% | 88.5% |
| Ontario | 88.5% | 91.4% |
| Manitoba | 84.1% | 90.6% |
| Saskatchewan | 84.8% | 91.8% |
| Alberta | 83.6% | 90.9% |
| British Columbia | 86.6% | 92.6% |
| Yukon | 87.9% | 93.8% |
| Northwest Territories | 79.8% | 94.2% |
| Nunavut | 88.9% | 94.9% |
Source: Indigenous Services Canada. Custom Tabulations, 2021 Census of Population.
- Regional variation in high school attainment is modest among Métis, and the gaps relative to the non-Indigenous population range from close to zero in the four Atlantic Provinces to 14.4 percentage points in the Northwest Territories.
- The full dataset for this figure is available in Appendix A – Table A5.5.
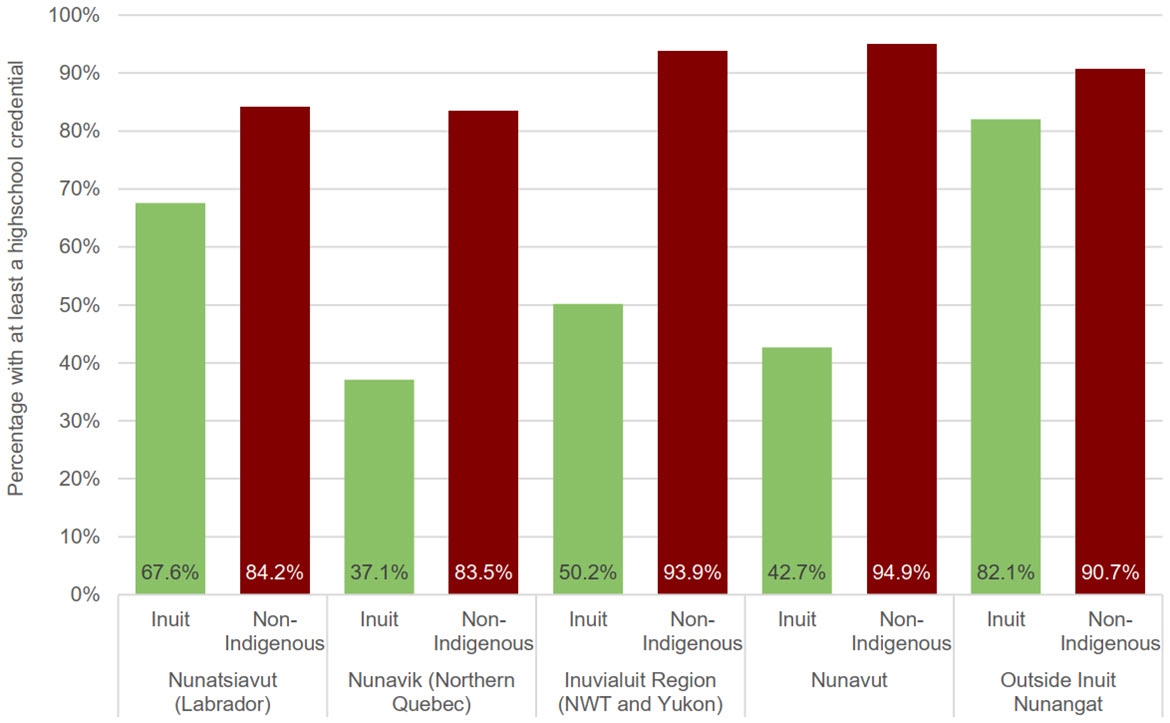
Text alternative for Figure 32: Percentage with at least a high school credential, 2021, Inuit and non-Indigenous populations, aged 25 to 64, by Inuit region
| Nunatsiavut (Labrador) | Nunavik (Northern Quebec) | Inuvialuit Region (Northwest Territories and Yukon) | Nunavut | Outside Inuit Nunangat | |||||
|---|---|---|---|---|---|---|---|---|---|
| Inuit | Non-Indigenous | Inuit | Non-Indigenous | Inuit | Non-Indigenous | Inuit | Non-Indigenous | Inuit | Non-Indigenous |
| 67.6% | 84.2% | 37.1% | 83.5% | 50.2% | 93.9% | 42.7% | 94.9% | 82.1% | 90.7% |
Source: Indigenous Services Canada. Custom Tabulations, 2021 Census of Population.
- Within Inuit Nunangat, the percentage of Inuit with at least a high school credential ranged from 37.1% in Nunavik to 67.6% in Nunatsiavut. The highest proportion was found outside Inuit Nunangat, at 82.1%.
- Outside Inuit Nunangat, the gap in high school completion for Inuit compared to the non-Indigenous population was 8.6 percentage points.
- Within Inuit Nunangat, the gap was considerably wider, ranging from 16.6 percentage points in Nunatsiavut to 52.2 percentage points in Nunavik.
- The full dataset for this figure is available in Appendix A – Table A5.6.
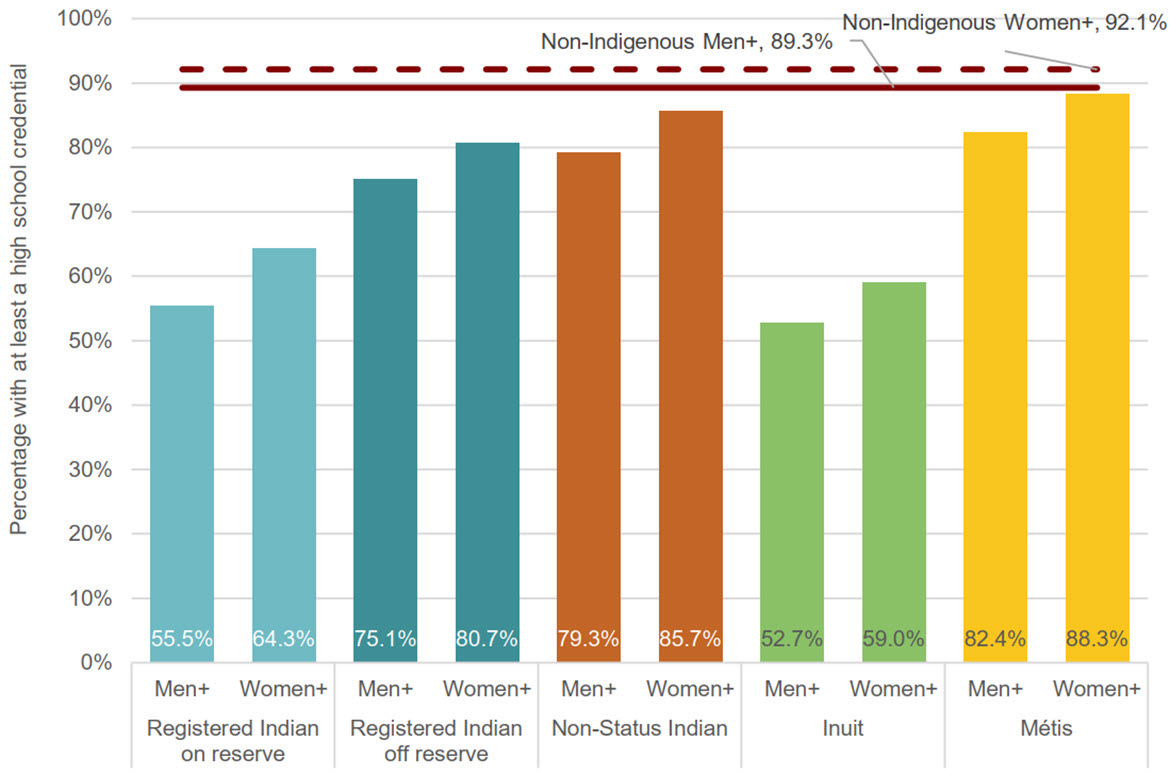
Text alternative for Figure 33: Percentage of people with at least a high school credential, 2021, Indigenous and non-Indigenous populations, aged 25 to 64, by gender, Canada
| Men+ Percentage | Women+ Percentage | |
|---|---|---|
| Registered Indian on reserve | 55.5% | 64.3% |
| Registered Indian off reserve | 75.1% | 80.7% |
| Non-Status Indian | 79.3% | 85.7% |
| Inuit | 52.7% | 59.0% |
| Métis | 82.4% | 88.3% |
| Non-Indigenous | 89.3% | 92.1% |
Source: Indigenous Services Canada. Custom Tabulations, 2021 Census of Population.
Note: Given that the non-binary population is small, Statistics Canada produced a two-category gender variable that was applied to prevent disclosure of identifiable data for lower levels of geography when necessary. Consequently, information will be disseminated using the following categories: Men+, Women+. Individuals in the "non-binary persons" category are distributed in the other two gender categories and are denoted by the "+" symbol.
- Unlike with other socio-economic indicators such as income and employment, women+ tended to have higher levels of educational attainment than men+. These levels were highest among Métis women+ at 88.3%, and lowest among Inuit women+ at 59.0%. Likewise, for Indigenous men+, these rates were highest for Métis (82.4%) and lowest for Inuit (52.7%).
- Both men+ and women+ showed the same overall trends with regard to gaps in high school completion relative to the non-Indigenous population. These gaps were highest for Inuit, followed by Registered Indians living on reserve, Registered Indians living off reserve and Non-Status Indians. Gaps were smallest for Métis men+ and women+.
- Gaps in high school completion were larger between Indigenous and non-Indigenous men+ than women+. Among Registered Indian men+ living on reserve, the gap in high school completion relative to the non-Indigenous population was 33.8 percentage points compared to 27.8 percentage points for women+. This was the largest difference between men+ and women+, at 6.0 percentage points.
- For Registered Indian men+ and women+ living off reserve, the gaps in high school completion were 14.2 and 11.4 percentage points, respectively. This represents the smallest difference between men+ and women+ of any group, at 2.8 percentage points. The difference in gap between Métis men+ and women+ was similar, at 3.1 percentage points.
- The full dataset for this figure is available in Appendix A – Table A5.7.
Measuring the gaps
| 2016 | 2021 | Five-Year Change | ||||
|---|---|---|---|---|---|---|
| Percentage | Gap | Percentage | Gap | Percentage | Percentage change in gap | |
| Registered Indian on reserve | 57.0% | -32.2% | 59.9% | -30.8% | 2.9% | -4.3% |
| Registered Indian off reserve | 75.0% | -14.2% | 78.2% | -12.5% | 3.2% | -12.0% |
| Non-Status Indian | 80.3% | -8.9% | 82.7% | -8.0% | 2.4% | -10.1% |
| Inuit | 55.9% | -33.3% | 56.0% | -34.7% | 0.1% | 4.2% |
| Métis | 82.3% | -6.9% | 85.5% | -5.2% | 3.2% | -24.6% |
| Non-Indigenous | 89.2% | 90.7% | 1.5% | |||
Source: Indigenous Services Canada. Custom Tabulations, 2016 to 2021 Census of Population. |
||||||
- There was an increase in the overall percentage of people with at least a high school credential; however, the gap did not close for all Indigenous groups compared to the non-Indigenous population.
- There was a small narrowing of the gap for Registered Indians living off reserve (12.0%) and for Non-Status Indians (10.1%).
- There was a large narrowing of the gap for Métis (24.6%).
- The gaps for Registered Indians living on reserve and Inuit were relatively stable from 2016 to 2021.
| Men+ | Women+ | |||
|---|---|---|---|---|
| Percentage | Percentage change in gap | Percentage | Percentage change in gap | |
| Registered Indian on reserve | 2.6% | -2.9% | 3.3% | -6.1% |
| Registered Indian off reserve | 2.7% | -7.2% | 3.5% | -14.9% |
| Non-Status Indian | 2.4% | -7.4% | 2.4% | -12.3% |
| Inuit | -2.1% | 11.2% | 2.2% | -2.1% |
| Métis | 3.3% | -19.8% | 3.0% | -28.3% |
| Non-Indigenous | 1.6% | 1.5% | ||
Source: Indigenous Services Canada. Custom Tabulations, 2016 to 2021 Census of Population. |
||||
- There was a small narrowing of the gap in high school completion rates for Registered Indian men+ living off reserve (7.2%) and Non-Status Indian men+ (7.4%). Métis men+ saw a medium narrowing of the gap (19.8%), from 8.6% in 2016 to 6.9% in 2021.
- There was a small widening of the gap for Inuit men+, from 32.9% in 2016 to 36.6% in 2021.
- Between Indigenous women+ and non-Indigenous women+, there was a narrowing of gaps in the percentage of people with a high school education across all groups except Inuit women+ for whom the gap remained relatively stable.
- Métis women+ saw the largest narrowing of the gap at 28.3%, from 5.3% in 2016 to 3.7% in 2021.
- The full dataset for this figure is available in Appendix A – Table A5.7.
Education – completion of a university degree
Although not all individuals want or need a university degree to fulfill their career goals, those with a university degree still have the highest incomes in Canada. A degree can generally expand a person's employment options as well as provide advanced skills that can be assets in various domains of life. In total, there were 47,980 more Indigenous people with a university degree in 2021 than in 2016 (Table 14). For a full list of all data tables relevant to university completion, please see Appendix A, tables A6.1 to A6.7.
| 2016 | 2021 | Difference | Percentage Change | |
|---|---|---|---|---|
| Registered Indian on reserve | 7,950 | 12,935 | 4,985 | 62.7% |
| Registered Indian off reserve | 28,195 | 42,825 | 14,630 | 51.9% |
| Non-Status Indian | 12,315 | 21,515 | 9,200 | 74.7% |
| Inuit | 1,480 | 2,370 | 890 | 60.1% |
| Métis | 38,560 | 56,835 | 18,275 | 47.4% |
| Non-Indigenous | 5,312,045 | 6,916,520 | 1,604,475 | 30.2% |
Source: Indigenous Services Canada. Custom Tabulations, 2016 to 2021 Census of Population. |
||||
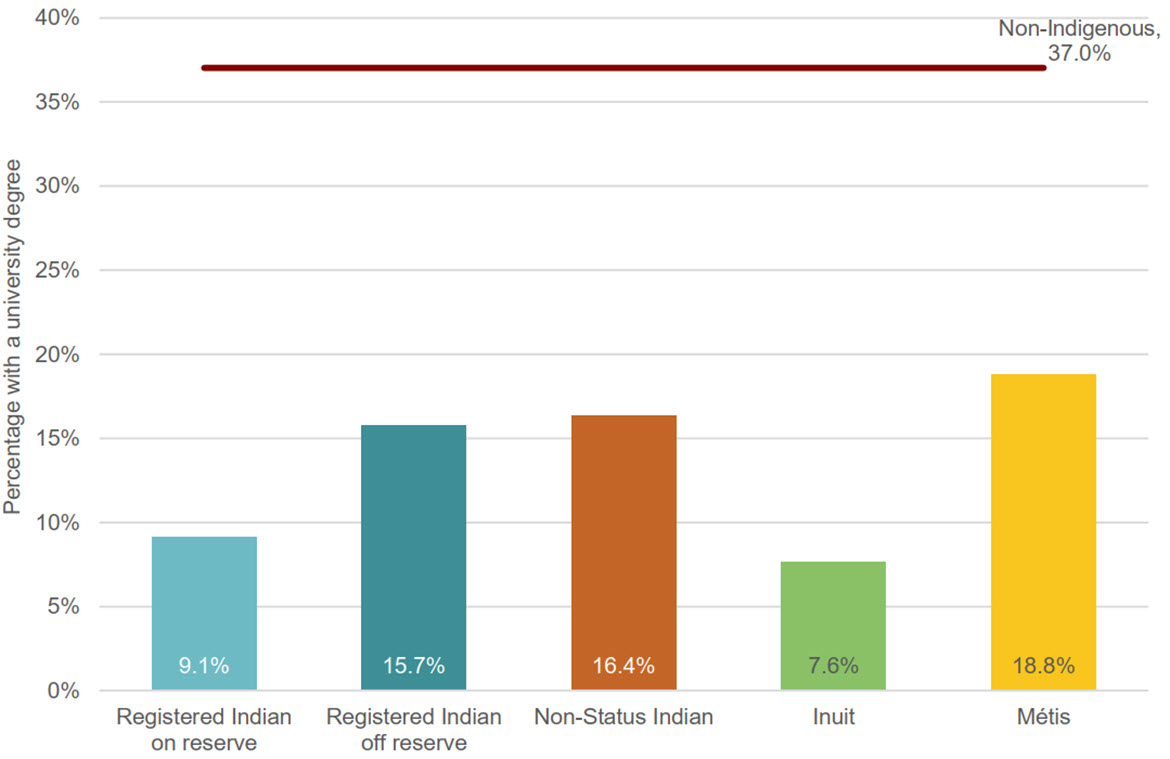
Text alternative for Figure 34: Percentage of people with a university degree, 2021, Indigenous and non-Indigenous populations, aged 25 to 64, Canada
| Registered Indian on reserve | Registered Indian off reserve | Non-Status Indian | Inuit | Métis | Non-Indigenous |
|---|---|---|---|---|---|
| 9.1% | 15.7% | 16.4% | 7.6% | 18.8% | 37.0% |
Source: Indigenous Services Canada. Custom Tabulations, 2021 Census of Population.
- The percentage of Indigenous people in the working-age population (aged 25 to 64) with a university degree was substantially lower than that of the non-Indigenous population.
- Of Registered Indians living on reserve, 9.1% had a university degree, compared to 15.7% of Registered Indians living off reserve, amounting to a gap of 27.9 percentage points.
- Non-Status Indians and Métis had similar rates of university completion at 16.4 and 18.8%, respectively, as well as comparable gaps relative to the non-Indigenous population at 20.6 and 18.2 percentage points. These were the lowest among the Indigenous groups.
- Inuit showed the lowest rate of university completion at only 7.6%, and the widest gap at 29.4 percentage points.
- The full dataset for this figure is available in Appendix A – Table A6.1.

Text alternative for Figure 35: Gap in university completion (in percentage points) between Indigenous and non-Indigenous populations, aged 25 to 34 and 25 to 64, 2021, Canada
| Registered Indian on reserve | Registered Indian off reserve | Non-Status Indian | Inuit | Métis | |||||
|---|---|---|---|---|---|---|---|---|---|
| Aged 25 to 34 | Aged 25 to 64 | Aged 25 to 34 | Aged 25 to 64 | Aged 25 to 34 | Aged 25 to 64 | Aged 25 to 34 | Aged 25 to 64 | Aged 25 to 34 | Aged 25 to 64 |
| 39.2 | 27.9 | 29.3 | 21.3 | 26.4 | 20.7 | 38.0 | 29.4 | 21.7 | 18.3 |
Source: Indigenous Services Canada. Custom Tabulations, 2021 Census of Population.
- The gaps in the percentage of Indigenous and non-Indigenous individuals having completed a university degree were larger among individuals aged 25 to 34 than among the working population as a whole (aged 25 to 64), suggesting that disparities in university completion are not poised to improve in the short term.
- The gap relative to the non-Indigenous population aged 25 to 34 was most pronounced for Registered Indians living on reserve (39.2 percentage points) and Inuit (38.0 percentage points).
- The full dataset for this figure is available in Appendix A – Table A6.2.
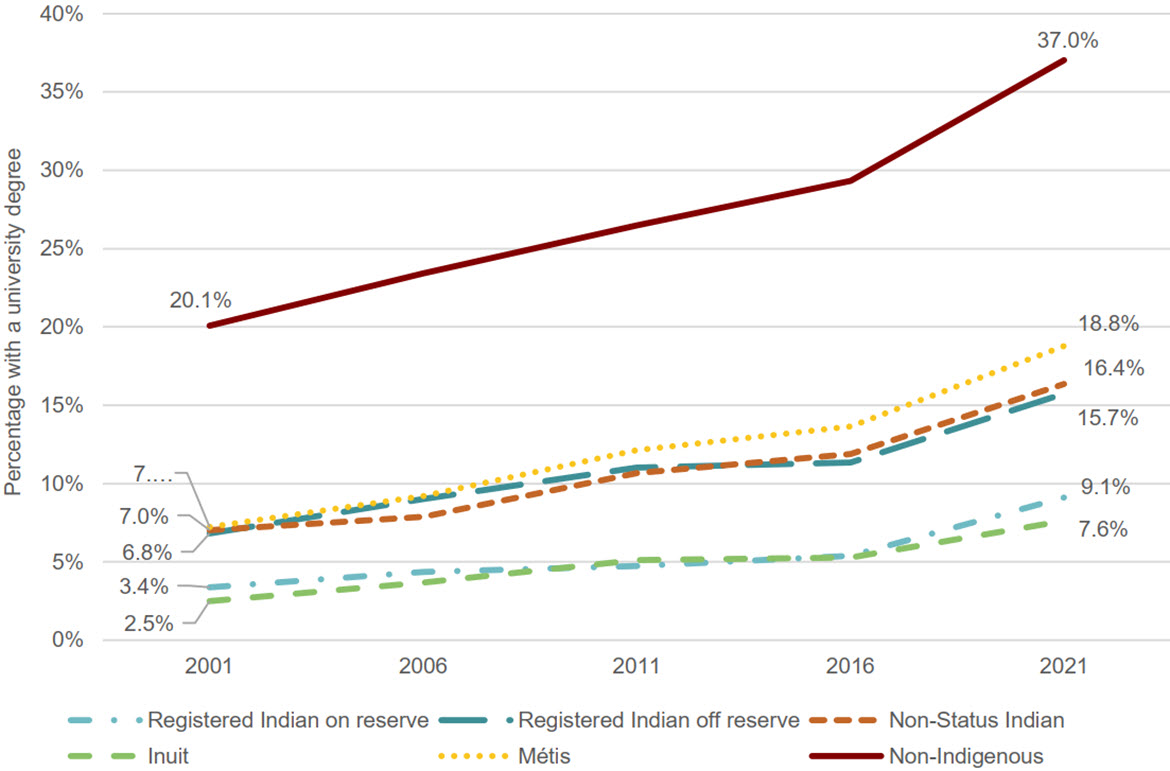
Text alternative for Figure 36: Percentage of people with a university degree, 2001 to 2021, Indigenous and non-Indigenous populations, aged 25 to 64, Canada
| Registered Indian on reserve | Registered Indian off reserve | Non-Status Indian | Inuit | Métis | Non-Indigenous | |
|---|---|---|---|---|---|---|
| 2001 | 3.4% | 6.8% | 7.0% | 2.5% | 7.2% | 20.1% |
| 2006 | 4.4% | 9.0% | 7.9% | 3.7% | 9.2% | 23.4% |
| 2011 | 4.7% | 11.0% | 10.7% | 5.1% | 12.1% | 26.5% |
| 2016 | 5.4% | 11.3% | 11.9% | 5.3% | 13.6% | 29.3% |
| 2021 | 9.1% | 15.7% | 16.4% | 7.6% | 18.8% | 37.0% |
Source: Indigenous Services Canada. Custom Tabulations, 2021 Census of Population.
- The percentage of Indigenous people with a university degree has slowly increased over the years. For example, 3.4% of Registered Indians living on reserve had a degree in 2001 compared to 9.1% in 2021.
- The gaps in university completion between the Indigenous groups and the non-Indigenous population increased from 2001 to 2021.
- For Registered Indians living on reserve, the gap widened from 16.7 percentage points in 2001 to 27.9 percentage points in 2021.
- The gaps for Registered Indians living off reserve, Non-Status Indians and Inuit followed a similar path, growing respectively from 13.3 to 21.3 percentage points, 13.1 to 20.6 percentage points and 12.9 to 18.2 percentage points during the same period.
- The largest change in gap was seen among Inuit, growing from 17.6 to 29.4 percentage points.
- The full dataset for this figure is available in Appendix A – Table A6.3.
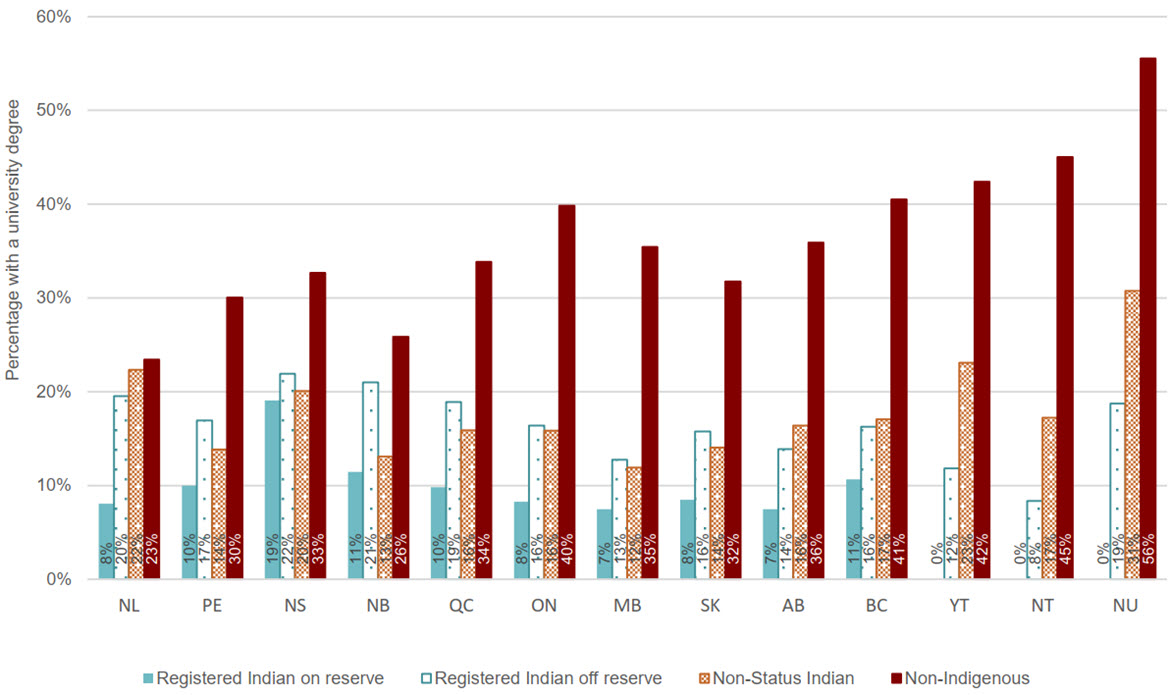
Text alternative for Figure 37: Percentage of people with a university degree, 2021, First Nations and non-Indigenous populations, aged 25 to 64, by region
| Registered Indian on reserve | Registered Indian off reserve | Non-Status Indian | Non-Indigenous | |
|---|---|---|---|---|
| Newfoundland and Labrador | 8.1% | 19.5% | 22.3% | 23.4% |
| Prince Edward Island | 10.0% | 16.9% | 13.8% | 30.0% |
| Nova Scotia | 19.1% | 21.9% | 20.1% | 32.7% |
| New Brunswick | 11.4% | 21.0% | 13.1% | 25.8% |
| Quebec | 9.8% | 18.9% | 15.9% | 33.8% |
| Ontario | 8.3% | 16.4% | 15.8% | 39.9% |
| Manitoba | 7.5% | 12.7% | 11.9% | 35.4% |
| Saskatchewan | 8.5% | 15.8% | 14.1% | 31.7% |
| Alberta | 7.5% | 13.9% | 16.4% | 35.9% |
| British Columbia | 10.7% | 16.3% | 17.1% | 40.5% |
| Yukon | 11.8% | 23.1% | 42.4% | |
| Northwest Territories | 8.4% | 17.2% | 45.0% | |
| Nunavut | 18.8% | 30.8% | 55.5% |
Source: Indigenous Services Canada. Custom Tabulations, 2021 Census of Population.
- For Registered Indians living on reserve, the largest gaps in university degree attainment compared to the non-Indigenous population were found in Ontario (31.6%), British Columbia (29.8%), Alberta (28.4%) and Manitoba (27.9%). The smallest gap was observed in Nova Scotia (13.6%).
- For Registered Indians living off reserve, the largest gaps were all found in the North: 36.7 percentage points in Nunavut, 36.6 percentage points in the Northwest Territories and 30.6 percentage points in Yukon. The smallest gap was observed in Newfoundland and Labrador, at 3.9 percentage points.
- For Non-Status Indians, the largest gaps were located in the Northwest Territories (27.8 percentage points), Nunavut (24.7 percentage points) and Ontario (24.1 percentage points), while the smallest gap was observed in Newfoundland and Labrador, at 1.1 percentage points.
- The full dataset for this figure is available in Appendix A – Table A6.4.
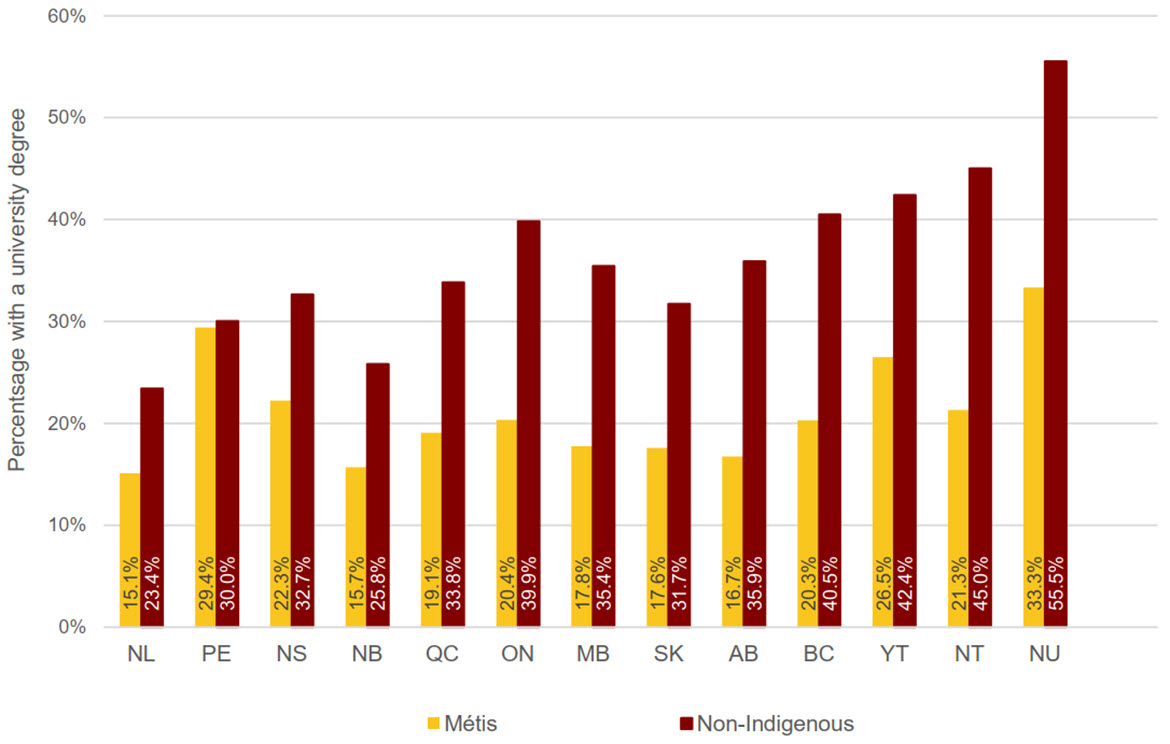
Text alternative for Figure 38: Percentage of people with a university degree, 2021, Métis and non-Indigenous populations, aged 25 to 64, by region
| Métis | Non-Indigenous | |
|---|---|---|
| Newfoundland and Labrador | 15% | 23% |
| Prince Edward Island | 29% | 30% |
| Nova Scotia | 22% | 33% |
| New Brunswick | 16% | 26% |
| Quebec | 19% | 34% |
| Ontario | 20% | 40% |
| Manitoba | 18% | 35% |
| Saskatchewan | 18% | 32% |
| Alberta | 17% | 36% |
| British Columbia | 20% | 41% |
| Yukon | 27% | 42% |
| Northwest Territories | 21% | 45% |
| Nunavut | 33% | 56% |
Source: Indigenous Services Canada. Custom Tabulations, 2021 Census of Population.
- For Métis, the largest gaps in university degree attainment compared to the non-Indigenous population were found in the Northwest Territories (23.7 percentage points), Nunavut (22.2 percentage points) and British Columbia (20.2 percentage points).
- Prince Edward Island and Newfoundland and Labrador had the smallest gap, at 0.6 percentage points and 8.3 percentage points, respectively.
- Of note, the Métis populations in Nunavut (110 people) and Prince Edward Island (770 people) are small. Therefore, the observed trends in these areas more likely result from the effects of the small population size rather than reflect robust regional differences.
- The full dataset for this figure is available in Appendix A – Table A6.5.

Text alternative for Figure 39: Percentage of people with a university degree, 2021, Inuit and non-Indigenous populations, aged 25 to 64, by region
| Nunatsiavut (Labrador) | Nunavik (Northern Quebec) | Inuvialuit Region (Northwest Territories and Yukon) | Nunavut | Outside Inuit Nunangat | |||||
|---|---|---|---|---|---|---|---|---|---|
| Inuit | Non-Indigenous | Inuit | Non-Indigenous | Inuit | Non-Indigenous | Inuit | Non-Indigenous | Inuit | Non-Indigenous |
| 7.5% | 52.6% | 2.2% | 42.1% | 4.9% | 52.8% | 4.0% | 55.5% | 15.4% | 37.0% |
Source: Indigenous Services Canada. Custom Tabulations, 2021 Census of Population.
- The percentage of Inuit aged 25 to 64 with a university degree was strikingly low within Inuit Nunangat, ranging from 2.2% in Nunavik to 7.5% in Nunatsiavut. The percentage was highest among those residing outside Inuit Nunangat, at 15.4%.
- There were substantial gaps in university completion between Inuit and the non-Indigenous population, particularly within Inuit Nunangat where nearly half of the non-Indigenous population in each region had a university degree, compared to only a very small percentage of Inuit.
- While this gap was narrower outside Inuit Nunangat (21.6 percentage points), the difference in university completion between Inuit and the non-Indigenous population remained stark.
- The full dataset for this figure is available in Appendix A – Table A6.6.
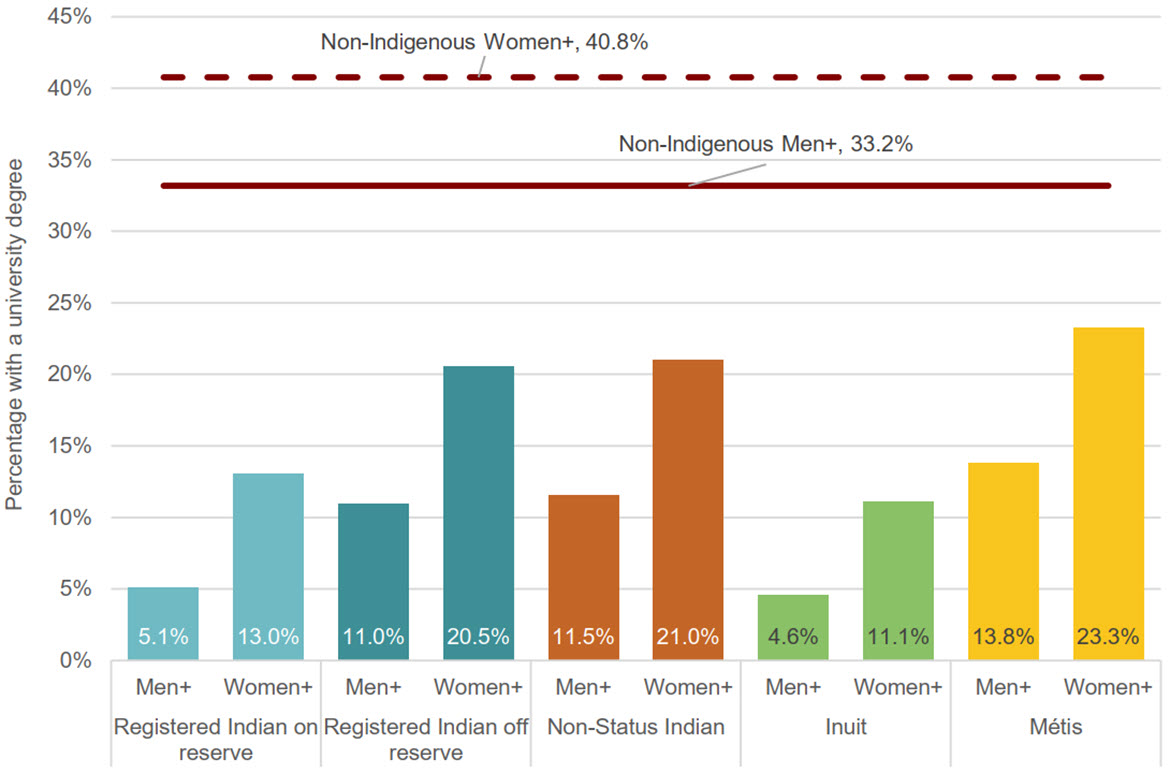
Text alternative for Figure 40: Percentage of people with a university degree, 2021, Indigenous and non-Indigenous populations, aged 25 to 64, by gender, Canada
| Men+ Percentage | Women+ Percentage | |
|---|---|---|
| Registered Indian on reserve | 5.1% | 13.0% |
| Registered Indian off reserve | 11.0% | 20.5% |
| Non-Status Indian | 11.5% | 21.0% |
| Inuit | 4.6% | 11.1% |
| Métis | 13.8% | 23.3% |
| Non-Indigenous | 33.2% | 40.8% |
Source: Indigenous Services Canada. Custom Tabulations, 2021 Census of Population.
Note: Given that the non-binary population is small, Statistics Canada produced a two-category gender variable that was applied to prevent disclosure of identifiable data for lower levels of geography when necessary. Consequently, information will be disseminated using the following categories: Men+, Women+. Individuals in the "non-binary persons" category are distributed in the other two gender categories and are denoted by the "+" symbol.
- The gaps in university completion between the Indigenous and non-Indigenous populations were similar for men+ and women+. These gaps were lowest among Métis, at 19.4 percentage points for men+ and 17.5 percentage points for women+, and highest among Inuit, at 28.6 percentage points for men+ and 29.7 percentage points for women+.
- For all Indigenous groups, university completion was higher among women+ than men+. The largest differences were found among Registered Indians off reserve (11.0% for men+ and 20.5% for women+), Non-Status Indians (11.5 for men+ and 21.0 for women+) and Métis (13.8 for men+ and 23.3 for women+). In each group, the difference in university completion rates between men+ and women+ was 9.5 percentage points. The smallest difference was found among Inuit, at 6.5 percentage points, with men+ at 4.6% and women+ at 11.1%.
- The full dataset for this figure is available in Appendix A – Table A6.7.
Measuring the gaps
| 2016 | 2021 | Five-Year Change | ||||
|---|---|---|---|---|---|---|
| Percentage | Gap | Percentage | Gap | Percentage | Percentage change in gap | |
| Registered Indian on reserve | 5.4% | -23.9% | 9.1% | -27.9% | 3.7% | 16.7% |
| Registered Indian off reserve | 11.3% | -18.0% | 15.7% | -21.3% | 4.4% | 18.3% |
| Non-Status Indian | 11.9% | -17.4% | 16.4% | -20.6% | 4.5% | 18.4% |
| Inuit | 5.3% | -24.0% | 7.6% | -29.4% | 2.3% | 22.5% |
| Métis | 13.6% | -15.7% | 18.8% | -18.2% | 5.2% | 15.9% |
| Non-Indigenous | 29.3% | 37.0% | 7.7% | |||
Source: Indigenous Services Canada. Custom Tabulations, 2016 to 2021 Census of Population. |
||||||
- There was a widening of the gap between Indigenous groups and the non-Indigenous population with regard to the percentage of people with a university degree.
- The largest widening of the gap was found among Inuit, at 22.5%, the gap having grown from 24.0 to 29.4% between 2016 and 2021.
| Men+ | Women+ | |||
|---|---|---|---|---|
| Percentage | Percentage change in gap | Percentage | Percentage change in gap | |
| Registered Indian on reserve | 2.2% | 17.1% | 5.2% | 16.3% |
| Registered Indian off reserve | 3.0% | 17.5% | 6.4% | 15.3% |
| Non-Status Indian | 2.5% | 21.2% | 6.6% | 14.5% |
| Inuit | 1.2% | 21.7% | 4.1% | 20.2% |
| Métis | 3.1% | 19.8% | 7.0% | 13.6% |
| Non-Indigenous | 6.3% | 9.1% | ||
Source: Indigenous Services Canada. Custom Tabulations, 2016 to 2021 Census of Population. |
||||
- For both Indigenous men+ and women+, the gap in university completion compared to the non-Indigenous population widened between 2016 to 2021.
- The widening of gaps among men+ were slightly larger than among women+ across all Indigenous groups.
- The largest difference in the gap between men+ and women+ was found among Non-Status Indians, at 6.7 percentage points.
- The full dataset for this figure is available in Appendix A – Table A6.7.
Housing – Crowding
The Census of Population collects data on housing suitability, which refers to whether a dwelling has enough bedrooms for the size and composition of the household based on the National Occupancy Standards. The World Health Organization identified overcrowding as a major factor in the transmission of diseases, and it has been linked to other adverse outcomes such as behavioural issues among children. While the likelihood that a person will live in a crowded dwelling is in part a function of their income or wealth, it is also impacted by the availability of housing and other aspects of local housing markets, and therefore should be measured separately. As seen in Table 17, there were 23,345 Indigenous households residing in a dwelling classified as crowded in 2021, up 125 households since 2016. For a full list of all data tables relevant to crowded housing, please see Appendix A, tables A7.1 to A7.5.
| 2016 | 2021 | Difference | Percentage Change | |
|---|---|---|---|---|
| Registered Indian on reserve | 12,160 | 10,705 | -1,455 | -12.0% |
| Registered Indian off reserve | 6,510 | 7,340 | 830 | 12.7% |
| Non-Status Indian | 1,085 | 1,235 | 150 | 13.8% |
| Inuit | 3,140 | 3,105 | -35 | -1.1% |
| Métis | 2,325 | 2,960 | 635 | 27.3% |
| Non-Indigenous | 244,630 | 328,090 | 83,460 | 34.1% |
Source: Indigenous Services Canada. Custom Tabulations, 2016 to 2021 Census of Population. |
||||
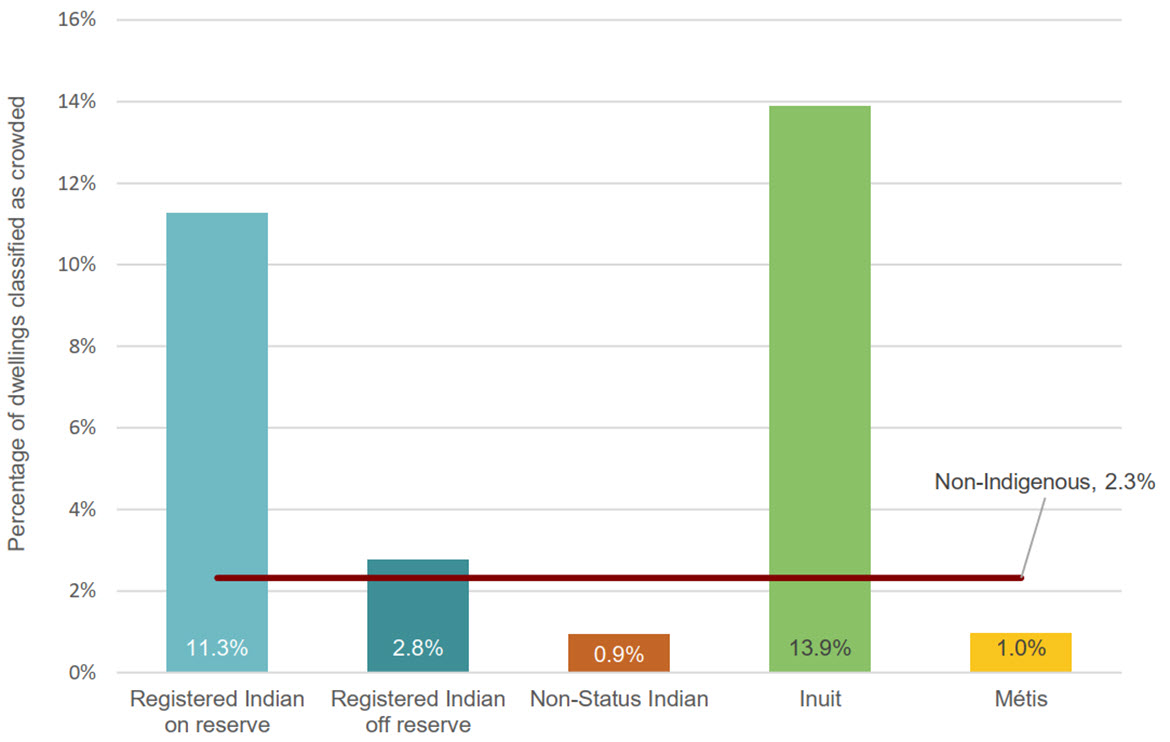
Text alternative for Figure 41: Percentage of dwellings classified as crowded, 2021, Indigenous and non-Indigenous populations, Canada
| Registered Indian on reserve | Registered Indian off reserve | Non-Status Indian | Inuit | Métis | Non-Indigenous |
|---|---|---|---|---|---|
| 11.3% | 2.8% | 0.9% | 13.9% | 1.0% | 2.3% |
Source: Indigenous Services Canada. Custom Tabulations, 2021 Census of Population.
- In 2021, crowded dwellings were relatively rare (2.3%) among the non-Indigenous population, although, as previously cited (see Figure 9), 10.7% of that population was living in a low-income situation.
- Crowded dwellings were similarly uncommon among Registered Indians living off reserve (2.8%), Non-Status Indians (0.9%) and Métis (1.0%).
- By contrast, the gaps in the proportion of crowded dwellings relative to the non-Indigenous population were substantial among Registered Indians living on reserve (11.3%, representing a difference of 9.0 percentage points) and Inuit (13.9%, representing a difference of 11.6 percentage points).
- The full dataset for this figure is available in Appendix A – Table A7.1.

Text alternative for Figure 42: Percentage of dwellings classified as crowded, 2001 to 2021, Indigenous and non-Indigenous populations, Canada
| Registered Indian on reserve | Registered Indian off reserve | Non-Status Indian | Inuit | Métis | Non-Indigenous | |
|---|---|---|---|---|---|---|
| 2001 | 13.8% | 3.8% | 1.3% | 15.3% | 1.5% | 1.3% |
| 2006 | 12.6% | 3.4% | 1.3% | 16.3% | 1.2% | 1.4% |
| 2011 | 13.1% | 3.4% | 1.4% | 15.6% | 1.3% | 1.9% |
| 2016 | 12.7% | 2.7% | 1.1% | 16.0% | 0.8% | 1.8% |
| 2021 | 11.3% | 2.8% | 0.9% | 13.9% | 1.0% | 2.3% |
Source: Indigenous Services Canada. Custom Tabulations, 2021 Census of Population.
- From 2001 to 2021, the percentage of crowded dwellings decreased slightly across all Indigenous groups. By contrast, among the non-Indigenous population, the percentage increased by 1.0 percentage point (1.3% in 2001 to 2.3% in 2021).
- Registered Indians living on reserve experienced the largest decline in overcrowding (2.5 percentage points) over this 20-year period, dropping from 13.8% in 2001 to 11.3% in 2021, followed by Inuit with a decline of 1.4 percentage points, then Registered Indians living off reserve (1.0 percentage point), Métis (0.5% points) and Non-Status Indians (0.4 percentage points).
- The percentage gaps in crowded dwellings relative to the non-Indigenous population slightly narrowed for all Indigenous groups between 2001 and 2021, ranging from a 1.4 percentage point reduction for Non-Status Indians to a 3.5 percentage point reduction for Registered Indians living on reserve.
- The full dataset for this figure is available in Appendix A – Table A7.2.
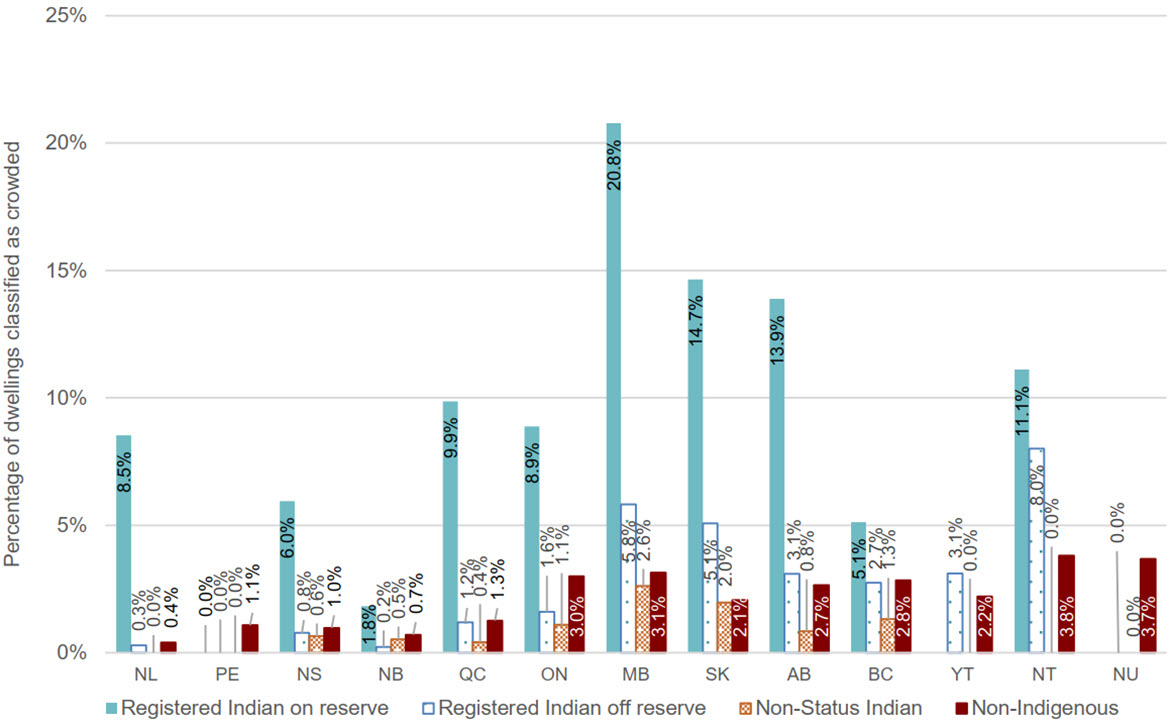
Text alternative for Figure 43: Percentage of dwellings classified as crowded, 2021, First Nations and non-Indigenous populations, by region
| Registered Indian on reserve | Registered Indian off reserve | Non-Status Indian | Non-Indigenous | |
|---|---|---|---|---|
| Newfoundland and Labrador | 8.5% | 0.3% | 0.4% | |
| Prince Edward Island | 1.1% | |||
| Nova Scotia | 6.0% | 0.8% | 0.6% | 1.0% |
| New Brunswick | 1.8% | 0.2% | 0.5% | 0.7% |
| Quebec | 9.9% | 1.2% | 0.4% | 1.3% |
| Ontario | 8.9% | 1.6% | 1.1% | 3.0% |
| Manitoba | 20.8% | 5.8% | 2.6% | 3.1% |
| Saskatchewan | 14.7% | 5.1% | 2.0% | 2.1% |
| Alberta | 13.9% | 3.1% | 0.8% | 2.7% |
| British Columbia | 5.1% | 2.7% | 1.3% | 2.8% |
| Yukon | 3.1% | 0.0% | 2.2% | |
| Northwest Territories | 11.1% | 8.0% | 0.0% | 3.8% |
| Nunavut | 0.0% | 0.0% | 3.7% |
Source: Indigenous Services Canada. Custom Tabulations, 2021 Census of Population.
- Crowding among First Nations was overwhelmingly an issue for those living on reserve. The highest percentages of First Nations dwellings on reserve that were classified as crowded were found in the Prairie provinces (20.8% in Manitoba, 14.7% in Saskatchewan and 13.9% in Alberta).
- The gaps relative to the non-Indigenous population were particularly large in the Prairie provinces (ranging from a difference of 11.2 percentage points in Alberta to 17.7 percentage points in Manitoba), in Quebec (8.6 percentage points) and in Newfoundland and Labrador (8.1 percentage points).
- Registered Indians living off reserve experienced the highest rates of crowding in Manitoba (5.8%) and Saskatchewan (5.1%). Likewise, Non-Status Indians had the highest rates of crowding in Manitoba (2.6%) and Saskatchewan (2.0%).
- The full dataset for this figure is available in Appendix A – Table A7.3.
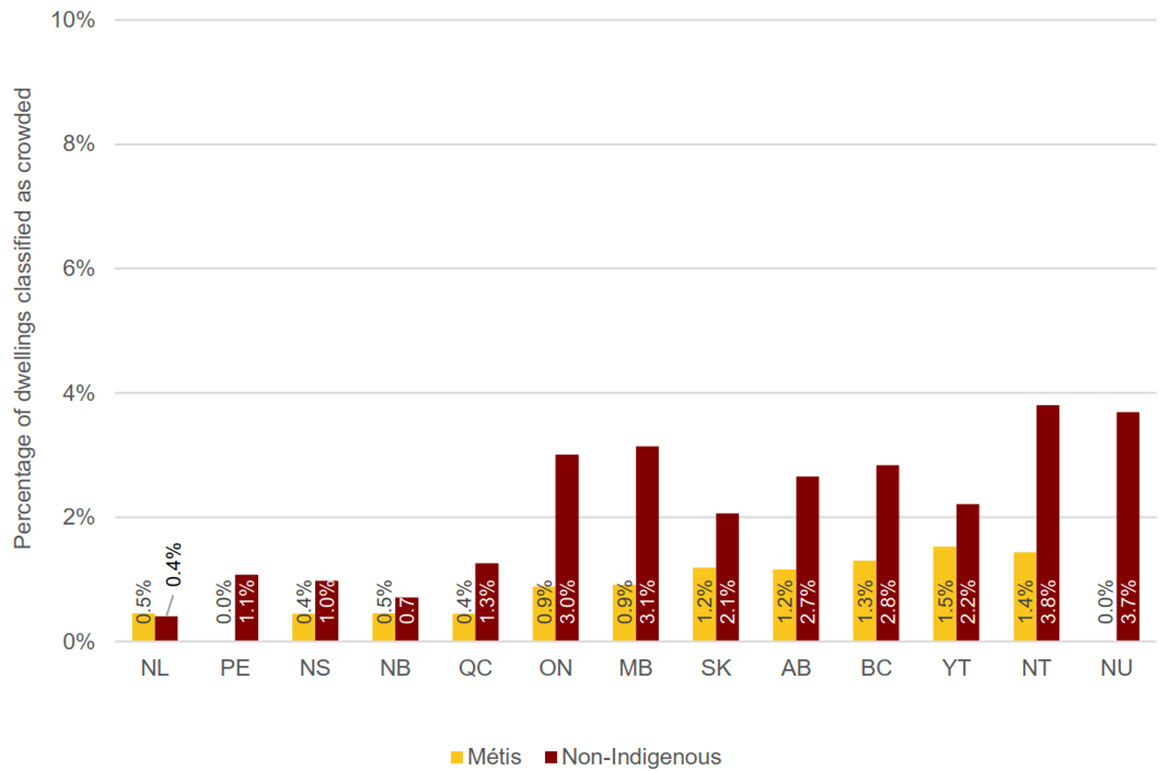
Text alternative for Figure 44: Percentage of dwellings classified as crowded, 2021, Métis and non-Indigenous populations, by region
| Métis | Non-Indigenous | |
|---|---|---|
| Newfoundland and Labrador | 0.5% | 0.4% |
| Prince Edward Island | 1.1% | |
| Nova Scotia | 0.4% | 1.0% |
| New Brunswick | 0.5% | 0.7% |
| Quebec | 0.4% | 1.3% |
| Ontario | 0.9% | 3.0% |
| Manitoba | 0.9% | 3.1% |
| Saskatchewan | 1.2% | 2.1% |
| Alberta | 1.2% | 2.7% |
| British Columbia | 1.3% | 2.8% |
| Yukon | 1.5% | 2.2% |
| Northwest Territories | 1.4% | 3.8% |
| Nunavut | 3.7% |
Source: Indigenous Services Canada. Custom Tabulations, 2021 Census of Population.
- As previously noted, the percentage of dwellings classified as crowded was slightly higher among the non-Indigenous population than Métis.
- The gaps in percentage of crowded dwellings between Métis and the non-Indigenous population were very small across the country.
- The full dataset for this figure is available in Appendix A – Table A7.4.
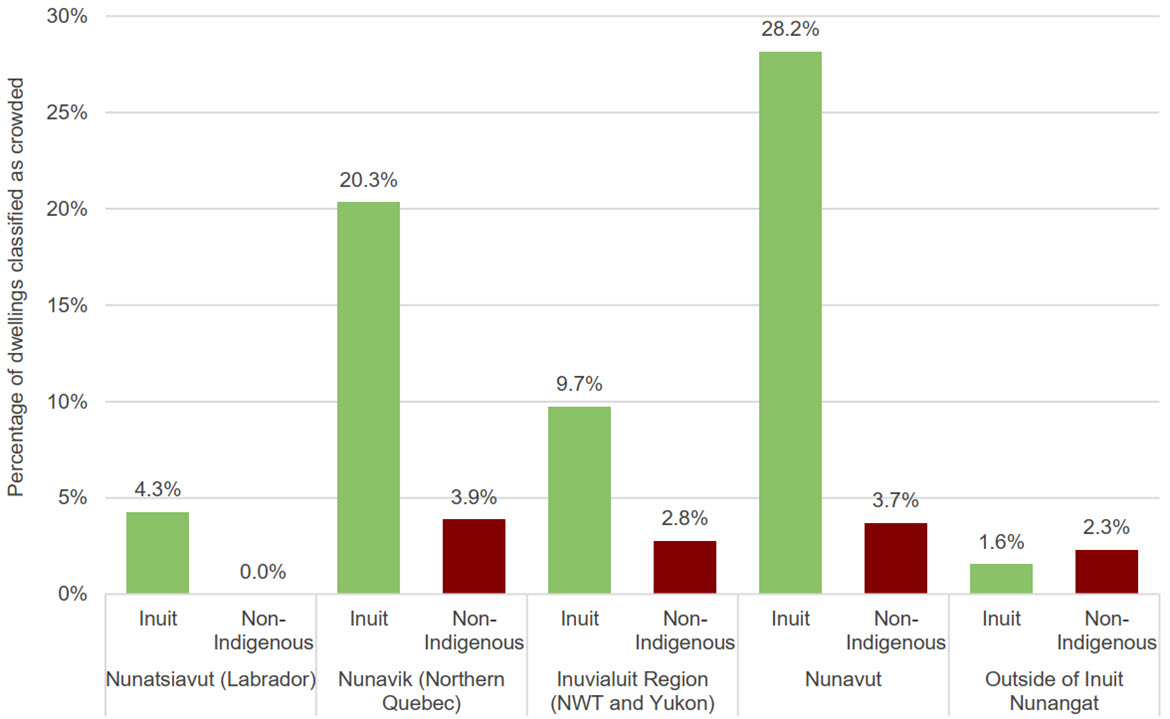
Text alternative for Figure 45: Percentage of dwellings classified as crowded, 2021, Inuit and non-Indigenous populations, by region
| Nunatsiavut (Labrador) | Nunavik (Northern Quebec) | Inuvialuit Region (Northwest Territories and Yukon) | Nunavut | Outside of Inuit Nunangat | |||||
|---|---|---|---|---|---|---|---|---|---|
| Inuit | Non-Indigenous | Inuit | Non-Indigenous | Inuit | Non-Indigenous | Inuit | Non-Indigenous | Inuit | Non-Indigenous |
| 4.3% | 0.0% | 20.3% | 3.9% | 9.7% | 2.8% | 28.2% | 3.7% | 1.6% | 2.3% |
Source: Indigenous Services Canada. Custom Tabulations, 2021 Census of Population.
- The percentage of Inuit dwellings classified as crowded varied significantly by region and by location within or outside Inuit Nunangat.
- Inside Inuit Nunangat, while crowded dwellings were rare among the non-Indigenous population, more than one-quarter of Inuit dwellings were classified as crowded in Nunavut (28.2%), and one-fifth were classified as crowded in Nunavik (20.3%). Crowding among Inuit dwellings in Inuvialuit (9.7%) and Nunatsiavut (4.3%) was also substantially higher than among the non-Indigenous population.
- Outside Inuit Nunangat, crowded dwellings were similarly uncommon for Inuit (1.6%) and the non-Indigenous population (2.3%).
- The full dataset for this figure is available in Appendix A – Table A7.5.
Measuring the gaps
| 2016 | 2021 | Five-Year Change | ||||
|---|---|---|---|---|---|---|
| Percentage | Gap | Percentage | Gap | Percentage | Percentage change in gap | |
| Registered Indian on reserve | 12.7% | 10.9% | 11.3% | 9.0% | -1.4% | -17.4% |
| Registered Indian off reserve | 2.7% | 0.9% | 2.8% | 0.5% | 0.1% | -44.4% |
| Non-Status Indian | 1.1% | -0.7% | 0.9% | -1.4% | -0.2% | 100.0% |
| Inuit | 16.0% | 14.2% | 13.9% | 11.6% | -2.1% | -18.3% |
| Métis | 0.8% | -1.0% | 1.0% | -1.3% | 0.2% | 30.0% |
| Non-Indigenous | 1.8% | 2.3% | 0.5% | |||
Source: Indigenous Services Canada. Custom Tabulations, 2016 to 2021 Census of Population. |
||||||
- For Registered Indians living on reserve and Inuit, between 2016 and 2021 there was a noticeable narrowing of the gap in the proportion of dwellings classified as crowded relative to the non-Indigenous population.
- Of note, crowding among Non-Status Indians and Métis was lower than among the non-Indigenous population in both 2016 and 2021. There is no gap for these Indigenous groups in terms of the proportion of crowded dwellings.
Housing – Dwellings in need of major repair
Similar to living in a crowded home, living in a home that is in need of major repair can have adverse impacts on a person's well-being, both directly (e.g., if mould is present) and indirectly (e.g., by creating financial or mental stress, being disruptive or depriving people of the household facilities on which they depend). As seen in Table 19, there were 108,965 Indigenous households residing in a dwelling classified as needing major repair in 2021, down 3,715 households since 2016. For a full list of all data tables relevant to dwellings in need of major repair, please see Appendix A, tables A8.1 to A8.5.
| 2016 | 2021 | Difference | Percentage Change | |
|---|---|---|---|---|
| Registered Indian on reserve | 38,325 | 32,320 | -6,005 | -15.7% |
| Registered Indian off reserve | 29,240 | 28,755 | -485 | -1.7% |
| Non-Status Indian | 12,410 | 14,225 | 1,815 | 14.6% |
| Inuit | 4,260 | 4,740 | 480 | 11.3% |
| Métis | 28,445 | 28,925 | 480 | 1.7% |
| Non-Indigenous | 806,390 | 808,915 | 2,525 | 0.3% |
Source: Indigenous Services Canada. Custom Tabulations, 2016 to 2021 Census of Population. |
||||
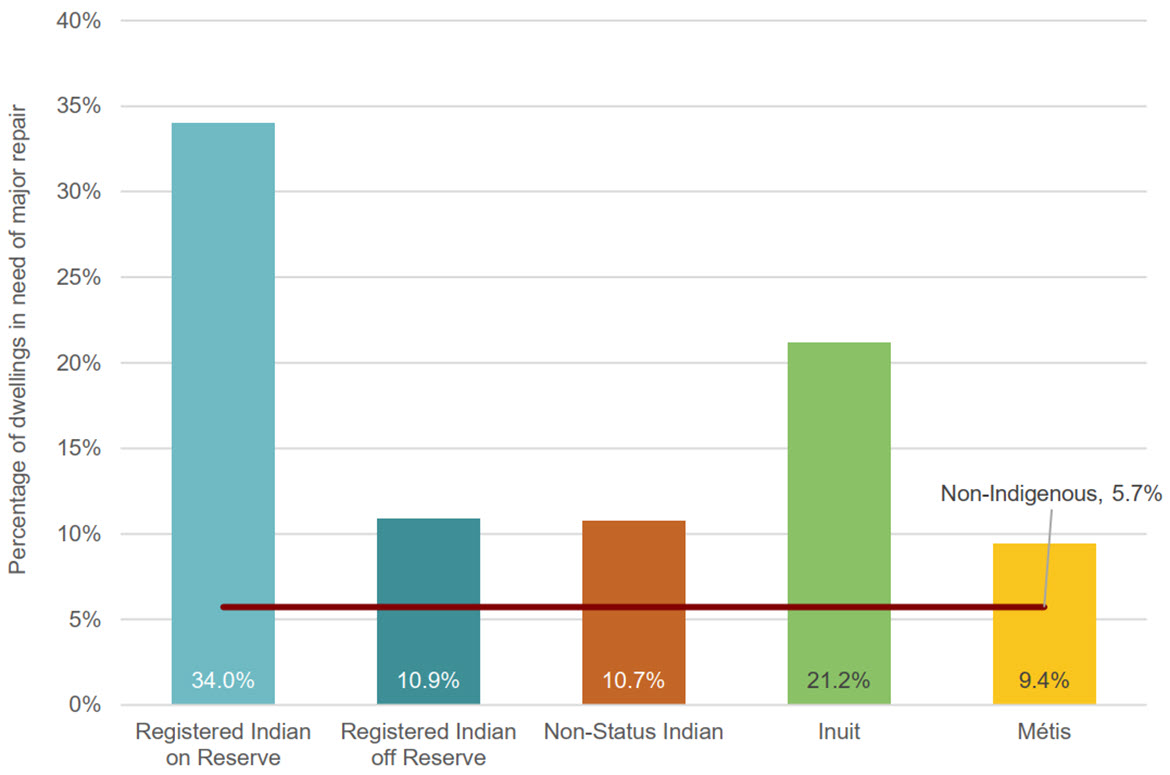
Text alternative for Figure 46: Percentage of dwellings in need of major repair, 2021, Indigenous and non-Indigenous populations, Canada
| Registered Indian on reserve | Registered Indian off reserve | Non-Status Indian | Inuit | Métis | Non-Indigenous |
|---|---|---|---|---|---|
| 34.0% | 10.9% | 10.7% | 21.2% | 9.4% | 5.7% |
Source: Indigenous Services Canada. Custom Tabulations, 2021 Census of Population.
- The percentage of dwellings in need of major repair was highest among Registered Indians living on reserve (34.0%) and lowest among Métis (9.4%).
- The gaps between Indigenous and non-Indigenous populations were substantial. These gaps were widest for Registered Indians living on reserve (28.3 percentage points) and narrowest for Métis (3.7 percentage points).
- This gap was also sizeable for Inuit at 15.5 percentage points, and similar in size for Registered Indians off reserve and Non-Status Indians at 5.2 percentage points and 5.0 percentage points, respectively.
- The full dataset for this figure is available in Appendix A – Table A8.1.

Text alternative for Figure 47: Percentage of dwellings in need of major repair, 2001 to 2021, Indigenous and non-Indigenous populations, Canada
| Registered Indian on reserve | Registered Indian off reserve | Non-Status Indian | Inuit | Métis | Non-Indigenous | |
|---|---|---|---|---|---|---|
| 2001 | 36.9% | 16.2% | 17.3% | 20.1% | 14.9% | 7.8% |
| 2006 | 42.2% | 15.4% | 14.5% | 22.4% | 12.5% | 7.0% |
| 2011 | 39.7% | 14.4% | 13.2% | 25.1% | 12.1% | 6.9% |
| 2016 | 40.0% | 12.2% | 12.3% | 21.8% | 10.3% | 6.0% |
| 2021 | 34.0% | 10.9% | 10.7% | 21.2% | 9.4% | 5.7% |
Source: Indigenous Services Canada. Custom Tabulations, 2021 Census of Population.
- Overall, there was a decline in the percentage of dwellings in need of major repair for most Indigenous groups between 2001 and 2021. Comparatively, in that same period, there was a narrowing of gaps between Indigenous groups and the non-Indigenous population, with the exception of Inuit.
- Over this 20-year period, Non-Status Indians experienced the greatest decline in the percentage of dwellings in need of major repair, from 17.3% to 10.7% (6.6 percentage points), followed by Métis (5.5 percentage points), Registered Indians living off reserve (5.3 percentage points) and Registered Indians living on reserve (2.9 percentage points). By contrast, the percentage of Inuit dwellings in need of major repair increased by 1.1 percentage points.
- The percentage of dwellings in need of major repair noticeably declined for Registered Indians living on reserve between 2016 and 2021 (6.0 percentage point reduction). Nevertheless, this group has consistently had the highest rates since 2001.
- The full dataset for this figure is available in Appendix A – Table A8.2.
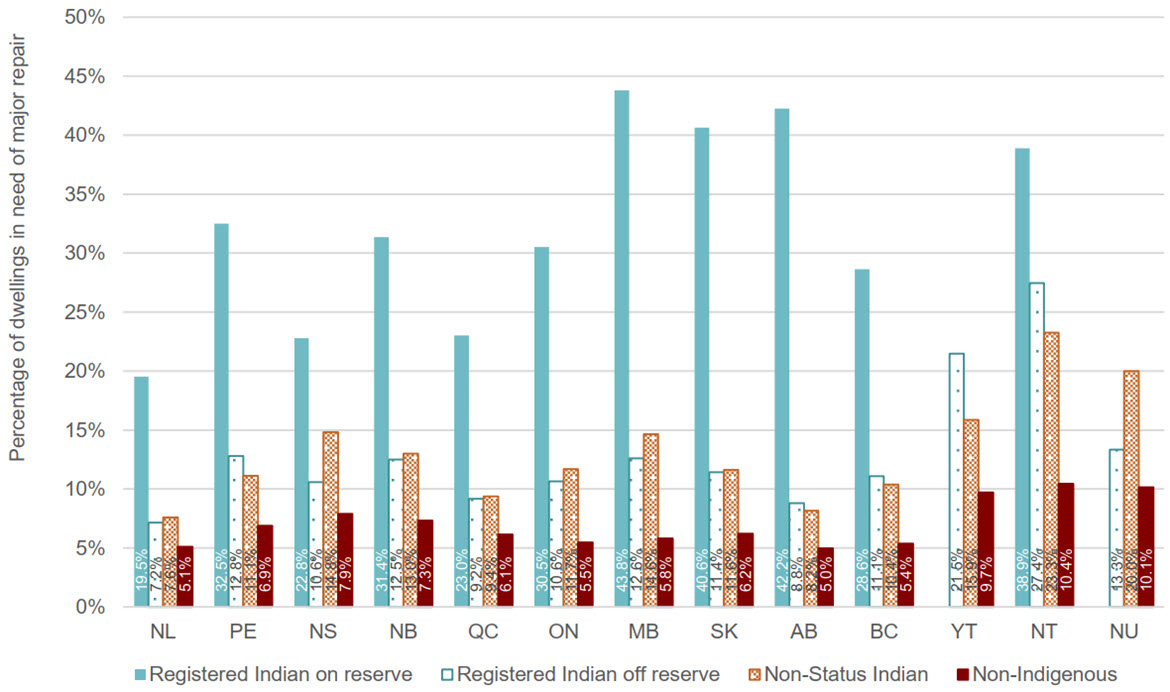
Text alternative for Figure 48: Percentage of dwellings in need of major repair, 2021, First Nations and non-Indigenous populations, by region
| Registered Indian on reserve | Registered Indian off reserve | Non-Status Indian | Non-Indigenous | |
|---|---|---|---|---|
| Newfoundland and Labrador | 19.5% | 7.2% | 7.6% | 5.1% |
| Prince Edward Island | 32.5% | 12.8% | 11.1% | 6.9% |
| Nova Scotia | 22.8% | 10.6% | 14.8% | 7.9% |
| New Brunswick | 31.4% | 12.5% | 13.0% | 7.3% |
| Quebec | 23.0% | 9.2% | 9.4% | 6.1% |
| Ontario | 30.5% | 10.6% | 11.7% | 5.5% |
| Manitoba | 43.8% | 12.6% | 14.6% | 5.8% |
| Saskatchewan | 40.6% | 11.4% | 11.6% | 6.2% |
| Alberta | 42.2% | 8.8% | 8.2% | 5.0% |
| British Columbia | 28.6% | 11.1% | 10.4% | 5.4% |
| Yukon | 21.5% | 15.9% | 9.7% | |
| Northwest Territories | 38.9% | 27.4% | 23.3% | 10.4% |
| Nunavut | 13.3% | 20.0% | 10.1% |
Source: Indigenous Services Canada. Custom Tabulations, 2021 Census of Population.
- There were considerable regional variations in the percentage of First Nations dwellings requiring major repair. These needs were highest for Registered Indians on reserve in the Prairie provinces (43.8% in Manitoba, 42.2% in Alberta and 40.6% in Saskatchewan).
- Similarly, the gaps in dwellings requiring major repair relative to the non-Indigenous population were widest for Registered Indians living on reserve in the Prairies, where the percentage of dwellings requiring major repair surpassed that of the non-Indigenous population by 38.0 percentage points in Manitoba, 37.2 percentage points in Alberta and 34.4 percentage points in Saskatchewan.
- For Registered Indians living off reserve, these gaps ranged from a low of 2.1 percentage points in Newfoundland and Labrador to a high of 17.0 percentage points in the Northwest Territories.
- Similarly, for Non-Status Indians, the gaps ranged from 2.5 percentage points in Newfoundland and Labrador to 12.9 percentage points in the Northwest Territories.
- The full dataset for this figure is available in Appendix A – Table A8.3.
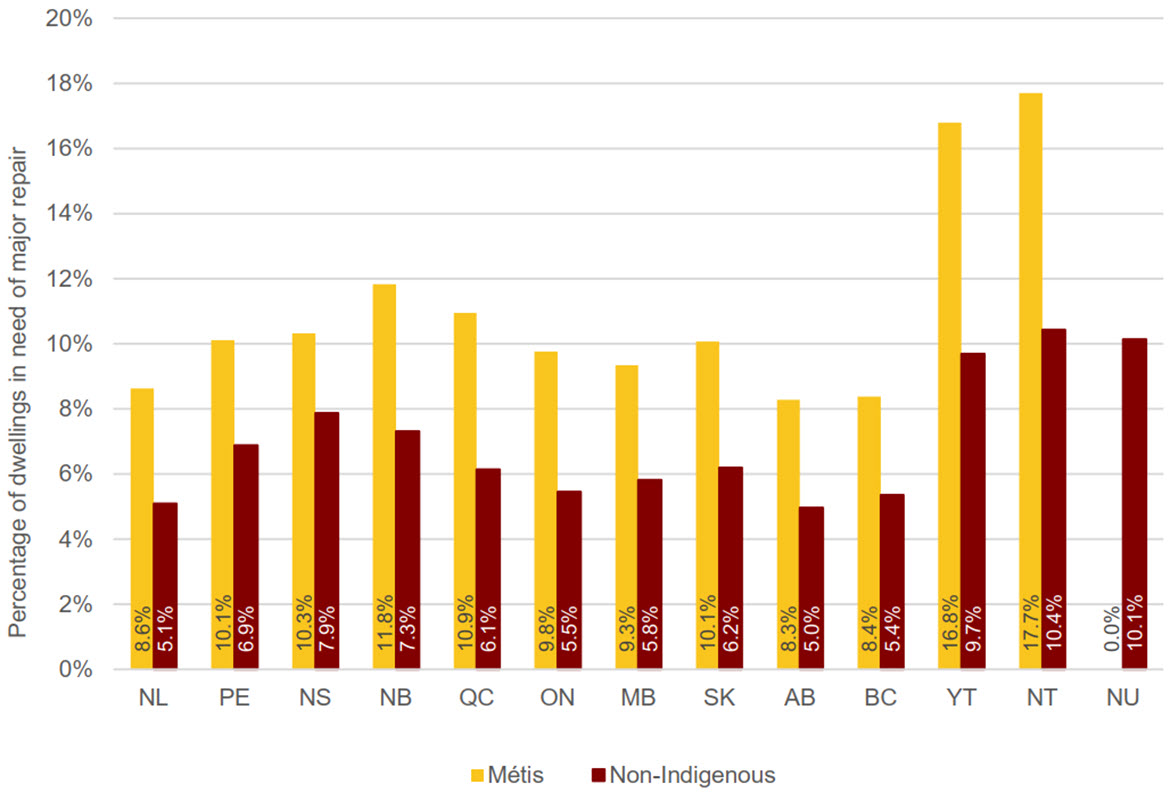
Text alternative for Figure 49: Percentage of dwellings in need of major repair, 2021, Métis and non-Indigenous populations, by region
| Métis | Non-Indigenous | |
|---|---|---|
| Newfoundland and Labrador | 8.6% | 5.1% |
| Prince Edward Island | 10.1% | 6.9% |
| Nova Scotia | 10.3% | 7.9% |
| New Brunswick | 11.8% | 7.3% |
| Quebec | 10.9% | 6.1% |
| Ontario | 9.8% | 5.5% |
| Manitoba | 9.3% | 5.8% |
| Saskatchewan | 10.1% | 6.2% |
| Alberta | 8.3% | 5.0% |
| British Columbia | 8.4% | 5.4% |
| Yukon | 16.8% | 9.7% |
| Northwest Territories | 17.7% | 10.4% |
| Nunavut | 10.1% |
Source: Indigenous Services Canada. Custom Tabulations, 2021 Census of Population.
- The percentage of Métis dwellings in need of major repair varied regionally. Percentages ranged from a low of 8.3% in Alberta to a high of 17.7% in the Northwest Territories.
- The gaps in percentage of dwellings in need of major repairs relative to the non-Indigenous population differed minimally across the provinces and territories. The gap was smallest for Métis in Nova Scotia (2.4 percentage points) and British Columbia (3.0 percentage points), and largest in the Northwest Territories (7.3 percentage points) and Yukon (7.1 percentage points).
- The full dataset for this figure is available in Appendix A – Table A8.4.
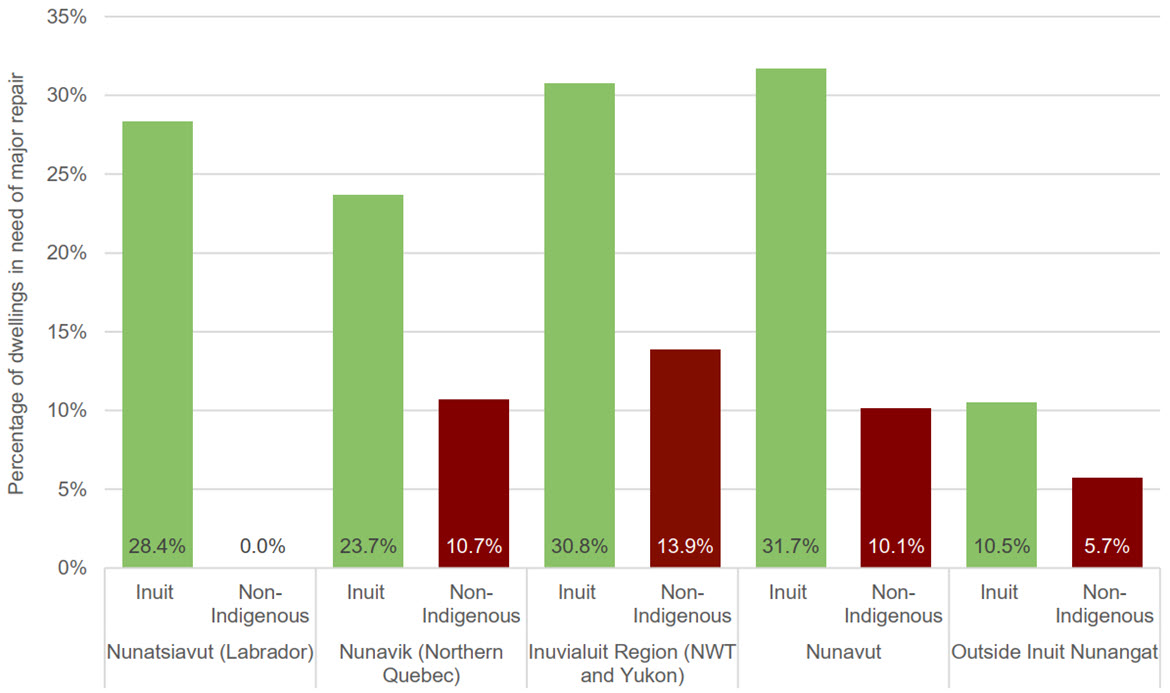
Text alternative for Figure 50: Percentage of dwellings in need of major repair, 2021, Inuit and non-Indigenous populations, by Inuit region
| Nunatsiavut (Labrador) | Nunavik (Northern Quebec) | Inuvialuit Region (Northwest Territories and Yukon) | Nunavut | Outside Inuit Nunangat | |||||
|---|---|---|---|---|---|---|---|---|---|
| Inuit | Non-Indigenous | Inuit | Non-Indigenous | Inuit | Non-Indigenous | Inuit | Non-Indigenous | Inuit | Non-Indigenous |
| 28.4% | 0.0% | 23.7% | 10.7% | 30.8% | 13.9% | 31.7% | 10.1% | 10.5% | 5.7% |
Source: Indigenous Services Canada. Custom Tabulations, 2021 Census of Population.
- In 2021, the percentage of Inuit dwellings in need of major repair was significant both within and outside Inuit Nunangat. Inside Inuit Nunangat, the percentage of Inuit dwellings requiring major repairs was substantial across all regions, ranging from 23.7% in Nunavik to 31.7% in Nunavut.
- The gaps relative to non-Indigenous dwellings in need of major repairs were sizeable. The highest gap was found in Nunatsiavut where there were no non-Indigenous dwellings in need of repair, followed by Nunavut (21.6 percentage points), Inuvialuit Region (16.9 percentage points) and Nunavik (13.0 percentage points).
- Outside Inuit Nunangat, the percentage of Inuit dwellings in need of major repair exceeded that of non-Indigenous dwellings by 4.8 percentage points. While not as large as in Inuit Nunangat, this gap does mean that Inuit dwellings were nearly twice as likely as non-Indigenous dwellings to be in need of major repairs.
- The full dataset for this figure is available in Appendix A – Table A8.5.
Measuring the gaps
| 2016 | 2021 | Five-Year Change | ||||
|---|---|---|---|---|---|---|
| Percentage | Gap | Percentage | Gap | Percentage | Percentage change in gap | |
| Registered Indian on reserve | 40.0% | 34.0% | 34.0% | 28.3% | -6.0% | -16.8% |
| Registered Indian off reserve | 12.2% | 6.2% | 10.9% | 5.2% | -1.3% | -16.1% |
| Non-Status Indian | 12.3% | 6.3% | 10.7% | 5.0% | -1.6% | -20.6% |
| Inuit | 21.8% | 15.8% | 21.2% | 15.5% | -0.6% | -1.9% |
| Métis | 10.3% | 4.3% | 9.4% | 3.7% | -0.9% | -14.0% |
| Non-Indigenous | 6.0% | 5.7% | -0.3% | |||
Source: Indigenous Services Canada. Custom Tabulations, 2016 to 2021 Census of Population. |
||||||
- Between 2016 and 2021, the percentage of dwellings in need of major repair declined in all groups except Inuit, for which the gap remained relatively unchanged.
- There was a medium narrowing of gaps for Registered Indians living on reserve, Registered Indians off reserve and Métis, with the change in gap ranging from 14.0 to 16.8%.
- There was a large narrowing of the gap for Non-Status Indians (20.6%).
Children in foster care
The Census of Population is designed to enumerate private households. Therefore, with respect to children in foster care, the census counts only those who reside in a private home. Those living in institutions, group homes or other care arrangements are not included in census counts related to children in foster care and are therefore not reflected in the data presented in this report.
Indigenous children are far more likely than non-Indigenous children to be in foster care. Although Indigenous Peoples represent only 5.0% of the Canadian population, Indigenous children make up over half (52.0%) of the children in foster care (Figure 51). From 2016 to 2021, the number of Indigenous children in foster care was relatively flat, decreasing by only 90 children in 5 years (Table 21). For a full list of all data tables relevant to children in foster care, please see Appendix A, tables A9.1 to A9.4.
| 2016 | 2021 | Difference | Percentage Change | |
|---|---|---|---|---|
| Registered Indian on reserve | 2,725 | 2,550 | -175 | -6.4% |
| Registered Indian off reserve | 9,385 | 8,860 | -525 | -5.6% |
| Non-Status Indian | 2,705 | 3,105 | 400 | 14.8% |
| Inuit | 595 | 860 | 265 | 44.5% |
| Métis | 2,000 | 1,945 | -55 | -2.8% |
| Non-Indigenous | 18,775 | 16,180 | -2,595 | -13.8% |
Source: Indigenous Services Canada. Custom Tabulations, 2016 to 2021 Census of Population. |
||||
The regional breakdowns for Inuit are not presented as the small numbers make it difficult to interpret differences in the percentage of Inuit children in foster care across Inuit regions. It is notable that the percentage of Inuit children in foster care inside Inuit Nunangat (2.0%) is lower than the percentage outside Inuit Nunangat (8.0%). However, this pattern could be misleading as some Inuit children in foster care outside Inuit Nunangat may originate from families inside Inuit Nunangat.
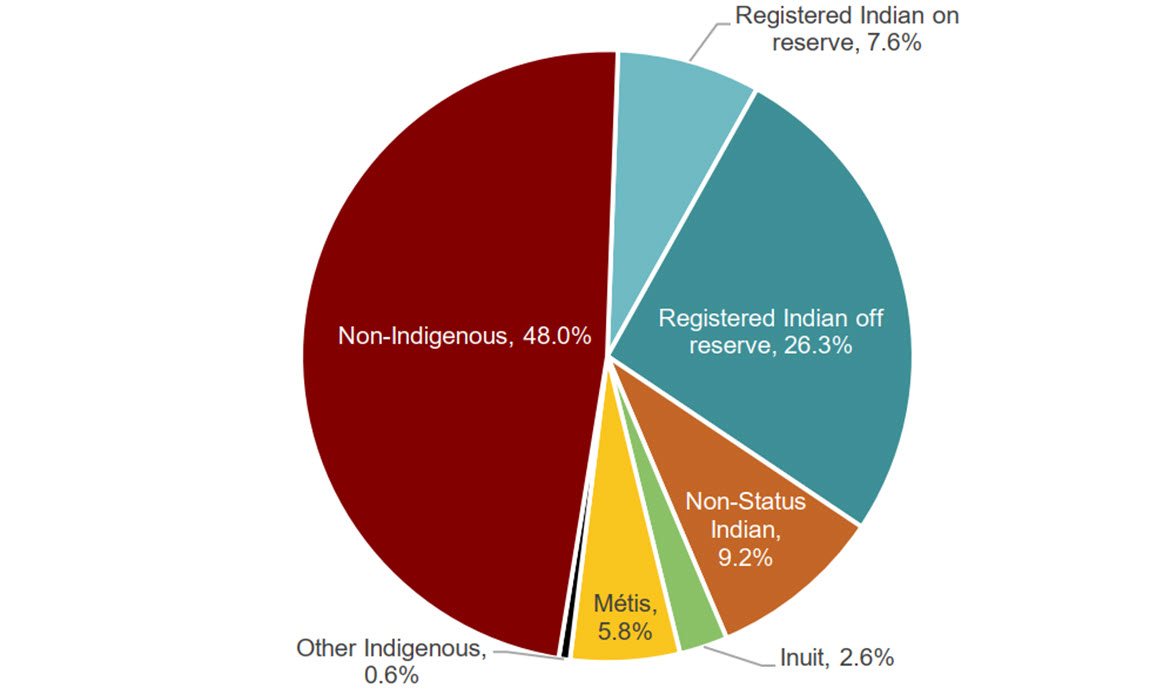
Text alternative for Figure 51: Percentage of Indigenous and non-Indigenous children comprising the total population of children aged 0 to 17 in foster care, 2021, Canada
| Registered Indian on reserve | Registered Indian off reserve | Non-Status Indian | Inuit | Métis | Other Indigenous | Non-Indigenous |
|---|---|---|---|---|---|---|
| 7.6% | 26.3% | 9.2% | 2.6% | 5.8% | 0.6% | 48.0% |
Source: Indigenous Services Canada. Custom Tabulations, 2021 Census of Population.
- Indigenous children are over-represented in foster care. Of all children aged 0 to 17 in foster care, 26.3% were Registered Indian children living off reserve, 9.2% were Non-Status Indian children, 7.6% were Registered Indian children living on reserve, 5.8% were Métis children and 2.6% were Inuit children.

Text alternative for Figure 52: Percentage of children aged 0 to 17 in foster care, 2021, Indigenous and non-Indigenous populations, Canada
| Registered Indians (total) | Registered Indian on reserve | Registered Indian off reserve | Non-Status Indian | Inuit | Métis | Non-Indigenous |
|---|---|---|---|---|---|---|
| 4.5% | 2.3% | 6.3% | 3.0% | 3.3% | 1.2% | 0.2% |
Source: Indigenous Services Canada. Custom Tabulations, 2021 Census of Population.
Note: Figure 52 includes a statistic for all Registered Indian children, in addition to the breakdown between those on and off reserve. In subsequent charts related to foster care, the breakdown is not included as it may be misleading, since Registered Indian children in foster care off reserve may come from families living on reserve.
- The percentage of Indigenous children aged 0 to 17 in foster care was significant. Registered Indians living off reserve (6.3%), Non-Status Indians (3.3%) and Inuit (3.0%) showed the highest percentage of children in foster care.
- Gaps relative to the non-Indigenous population were substantial, particularly for Registered Indian children living off reserve (6.1 percentage point difference).
- While the difference in percentage between Métis and non-Indigenous children in foster care appears smallest at 1.0 percentage points, Métis children remained six times more likely than non-Indigenous children to be in foster care.
- The full dataset for this figure is available in Appendix A – Table A9.1.
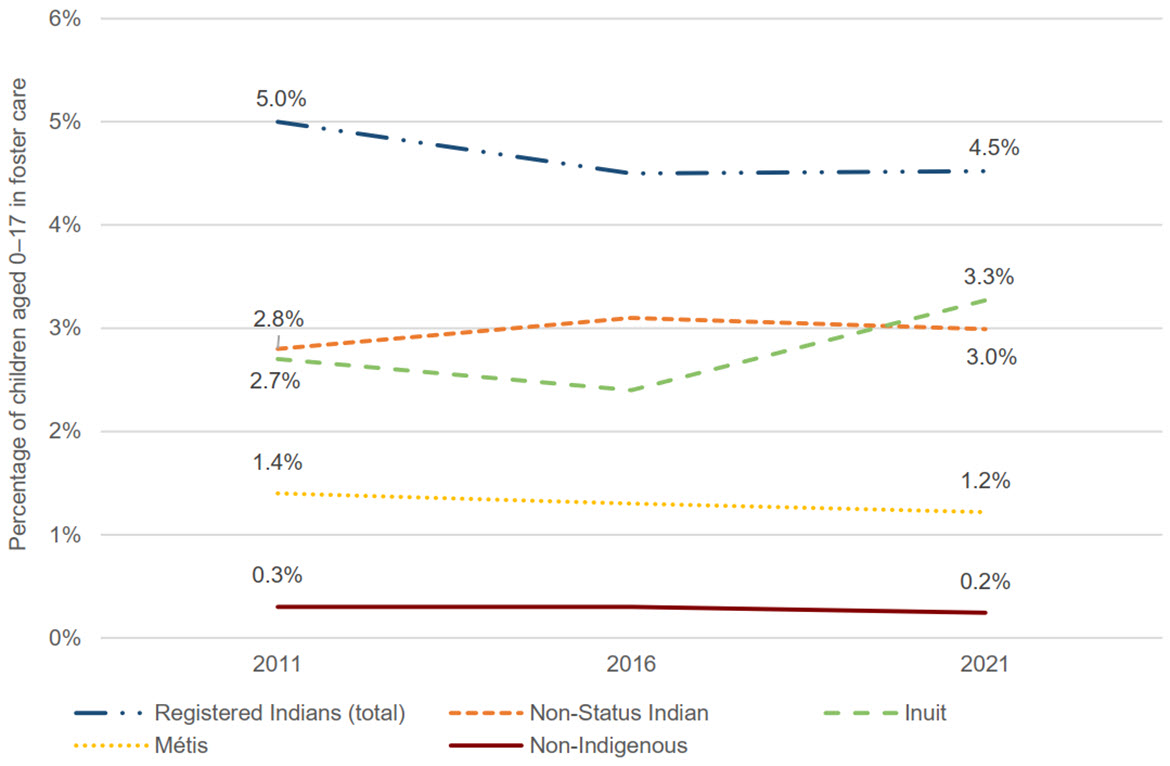
Text alternative for Figure 53: Percentage of children aged 0 to 17 in foster care, 2011 to 2021, Indigenous and non-Indigenous populations, Canada
| Registered Indians (total) | Non-Status Indian | Inuit | Métis | Non-Indigenous | |
|---|---|---|---|---|---|
| 2011 | 5.0% | 2.8% | 2.7% | 1.4% | 0.3% |
| 2016 | 4.5% | 3.1% | 2.4% | 1.3% | 0.3% |
| 2021 | 4.5% | 3.0% | 3.3% | 1.2% | 0.2% |
Source: Indigenous Services Canada. Custom Tabulations, 2021 Census of Population.
Note: Registered Indian includes both those living on and off reserve since Registered Indian children in foster care off reserve may come from families living on reserve.
- Data on foster care were first captured in the 2011 National Household Survey, which was that year's equivalent to the long-form census, and then in the 2016 and 2021 census cycles.
- Between 2011 and 2016, the percentage of children in foster care decreased for the Registered Indian (0.5 percentage points) and Métis (0.2 percentage points) groups. By contrast, the percentages for Non-Status Indians and Inuit increased by 0.2 and 0.6 percentage points, respectively.
- The full dataset for this figure is available in Appendix A – Table A9.2.
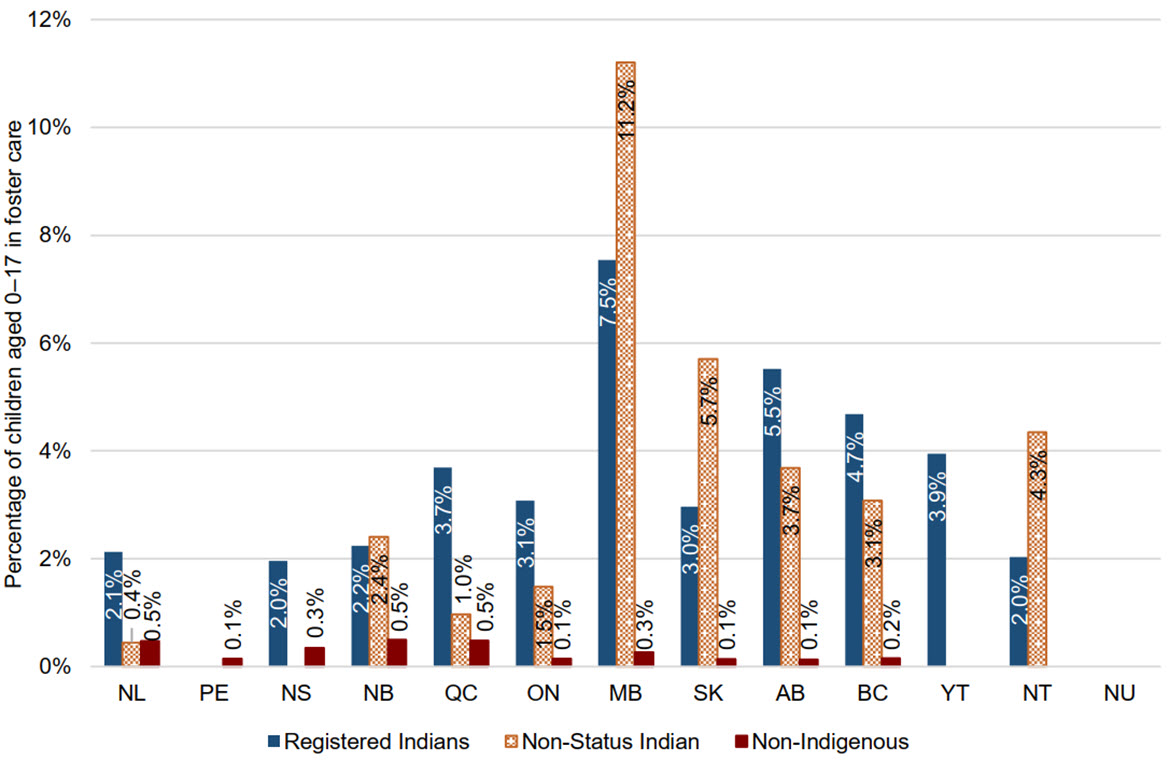
Text alternative for Figure 54: Percentage of children aged 0 to 17 in foster care, 2021, First Nations and non-Indigenous populations, by region
| Registered Indians | Non-Status Indian | Non-Indigenous | |
|---|---|---|---|
| Newfoundland and Labrador | 2.1% | 0.4% | 0.5% |
| Prince Edward Island | 0.1% | ||
| Nova Scotia | 2.0% | 0.3% | |
| New Brunswick | 2.2% | 2.4% | 0.5% |
| Quebec | 3.7% | 1.0% | 0.5% |
| Ontario | 3.1% | 1.5% | 0.1% |
| Manitoba | 7.5% | 11.2% | 0.3% |
| Saskatchewan | 3.0% | 5.7% | 0.1% |
| Alberta | 5.5% | 3.7% | 0.1% |
| British Columbia | 4.7% | 3.1% | 0.2% |
| Yukon | 3.9% | ||
| Northwest Territories | 2.0% | 4.3% | |
| Nunavut |
Source: Indigenous Services Canada. Custom Tabulations, 2021 Census of Population.
Note: Registered Indians include both those living on and off reserve since Registered Indian children in foster care off reserve may come from families living on reserve.
- There were notable regional variations in the percentage of First Nations children (Registered Indians and Non-Status Indians) aged 0 to 17 in foster care.
- The percentage of Registered Indian children in foster care was highest in Manitoba (7.5%), followed by Alberta (5.5%) and British Columbia (4.7%).
- For Non-Status Indians, the percentage was also highest in Manitoba (11.2%), followed by Saskatchewan (5.7%) and the Northwest Territories (4.3%).
- The full dataset for this figure is available in Appendix A – Table A9.3.
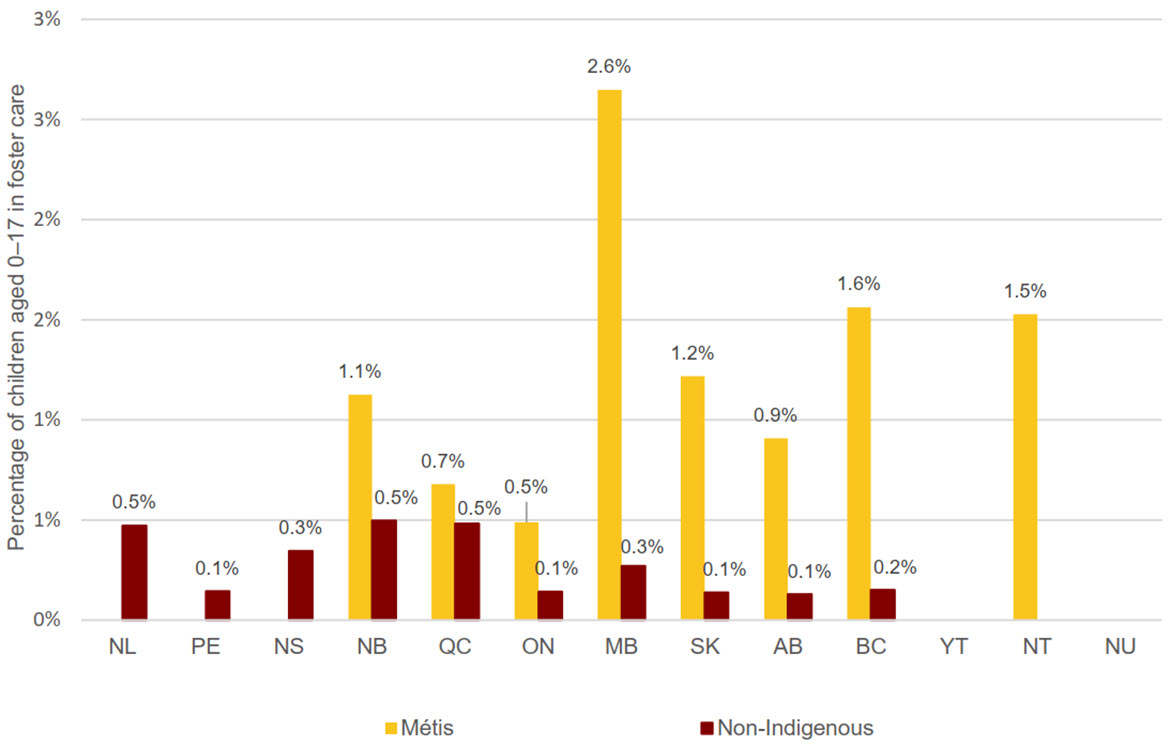
Text alternative for Figure 55: Percentage of children aged 0 to 17 in foster care, 2021, Métis and non-Indigenous populations, by region
| Métis | Non-Indigenous | |
|---|---|---|
| Newfoundland and Labrador | 0.5% | |
| Prince Edward Island | 0.1% | |
| Nova Scotia | 0.3% | |
| New Brunswick | 1.1% | 0.5% |
| Quebec | 0.7% | 0.5% |
| Ontario | 0.5% | 0.1% |
| Manitoba | 2.6% | 0.3% |
| Saskatchewan | 1.2% | 0.1% |
| Alberta | 0.9% | 0.1% |
| British Columbia | 1.6% | 0.2% |
| Yukon | ||
| Northwest Territories | 1.5% | |
| Nunavut |
Source: Indigenous Services Canada. Custom Tabulations, 2021 Census of Population.
- The percentage of Métis children in foster care differed markedly across regions, peaking in Manitoba at 2.6%.
- The full dataset for this figure is available in Appendix A – Table A9.4.
Measuring the gaps
| 2016 | 2021 | Five-Year Change | ||||
|---|---|---|---|---|---|---|
| Percentage | Gap | Percentage | Gap | Percentage | Percentage change in gap | |
| Registered Indians (total) | 4.5% | 4.2% | 4.5% | 4.3% | 0.0% | 2.4% |
| Non-Status Indian | 3.1% | 2.8% | 3.0% | 2.8% | -0.1% | 0.0% |
| Inuit | 2.4% | 2.1% | 3.3% | 3.1% | 0.9% | 47.6% |
| Métis | 1.3% | 1.0% | 1.2% | 1.0% | -0.1% | 0.0% |
| Non-Indigenous | 0.3% | 0.2% | -0.1% | |||
Source: Indigenous Services Canada. Custom Tabulations, 2016 to 2021 Census of Population. Note: Registered Indian includes both those living on and off reserve since Registered Indian children in foster care off reserve may come from families living on reserve. |
||||||
- Indigenous children in Canada continue to be overrepresented in foster care.
- The proportion of Indigenous children in foster care in 2021 remained relatively stable compared to 2016 with the exception of Inuit children.
Indigenous language knowledge
Indigenous languages have a very important role in Indigenous cultures and reflect the rich and distinct worldviews of the different Indigenous nations across the country. In 2021, there were over 70 Indigenous languages spoken in Canada. For more than 20 (28.6%) of those languages, 500 or fewer people reported speaking them as their mother tongue. In 2021, 243,155 individuals could conduct a conversation in an Indigenous language, 188,905 people reported having at least one Indigenous mother tongue and 182,925 reported speaking an Indigenous language at home on a regular basis. From 2016 to 2021, the number of individuals able to conduct a conversation in an Indigenous language dropped by over 20,000 (Table 23). This may be due in part to the 63 incompletely enumerated First Nations communities for the 2021 Census. For a full list of all data tables relevant to Indigenous language knowledge, please see Appendix A, tables A10.1 to A10.8.
| 2016 | 2021 | Difference | Percentage Change | |
|---|---|---|---|---|
| Registered Indian on reserve | 148,195 | 125,960 | -22,235 | -15.0% |
| Registered Indian off reserve | 57,395 | 57,190 | -205 | -0.4% |
| Non-Status Indian | 4,360 | 5,380 | 1,020 | 23.4% |
| Inuit | 41,710 | 40,780 | -930 | -2.2% |
| Métis | 8,460 | 7,235 | -1,225 | -14.5% |
| Non-Indigenous | 3,295 | 5,735 | 2,440 | 74.1% |
Source: Indigenous Services Canada. Custom Tabulations, 2016 to 2021 Census of Population. |
||||
Knowledge of Indigenous languages is not compared to non-Indigenous languages in this report. Instead, the report examines trends in Indigenous language use over time and whether those trends reflect Indigenous Peoples' aspirations with respect to the preservation and practice of their ancestral languages.
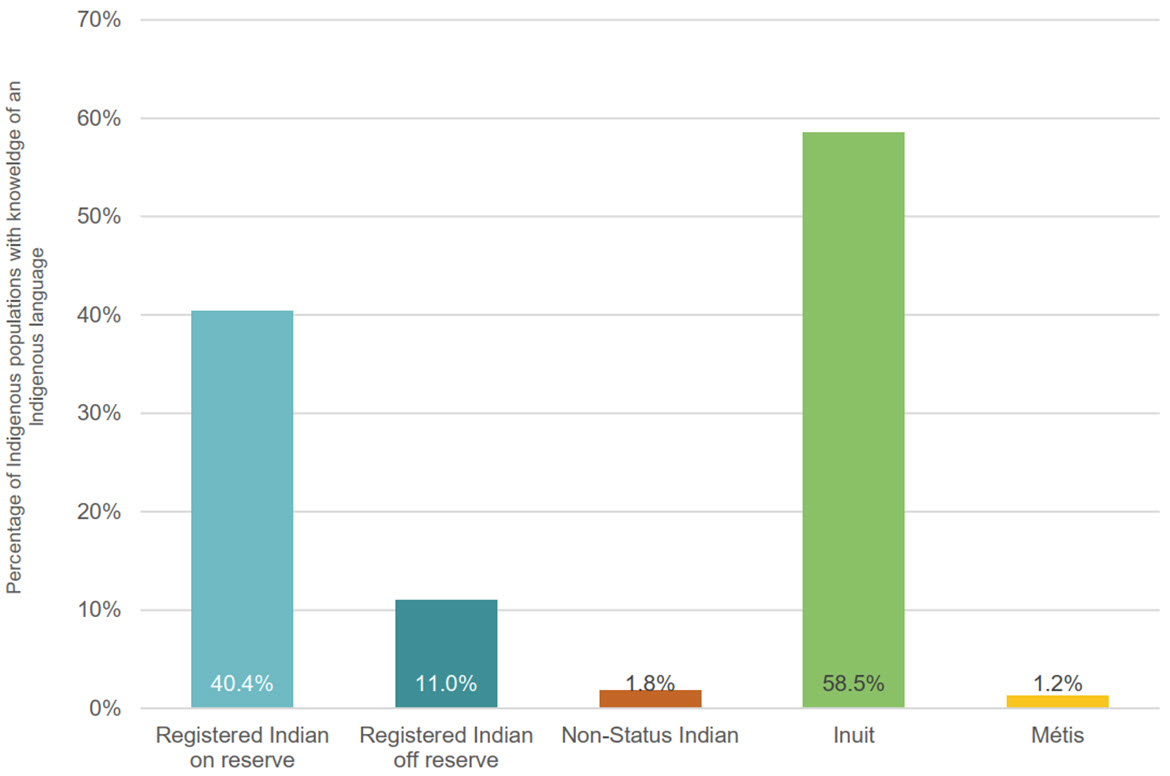
Text alternative for Figure 56: Percentage of Indigenous populations with knowledge of an Indigenous language, 2021, Canada
| Registered Indian on reserve | Registered Indian off reserve | Non-Status Indian | Inuit | Métis |
|---|---|---|---|---|
| 40.4% | 11.0% | 1.8% | 58.5% | 1.2% |
Source: Indigenous Services Canada. Custom Tabulations, 2021 Census of Population.
- In 2021, knowledge of an Indigenous language, meaning the proportion of Indigenous people who can conduct a conversation in an Indigenous language, was highest among Inuit (58.5%) and Registered Indians living on reserve (40.4%), and lowest among Métis (1.2%) and Non-Status Indians (1.8%).
- The full dataset for this figure is available in Appendix A – Table A10.1.
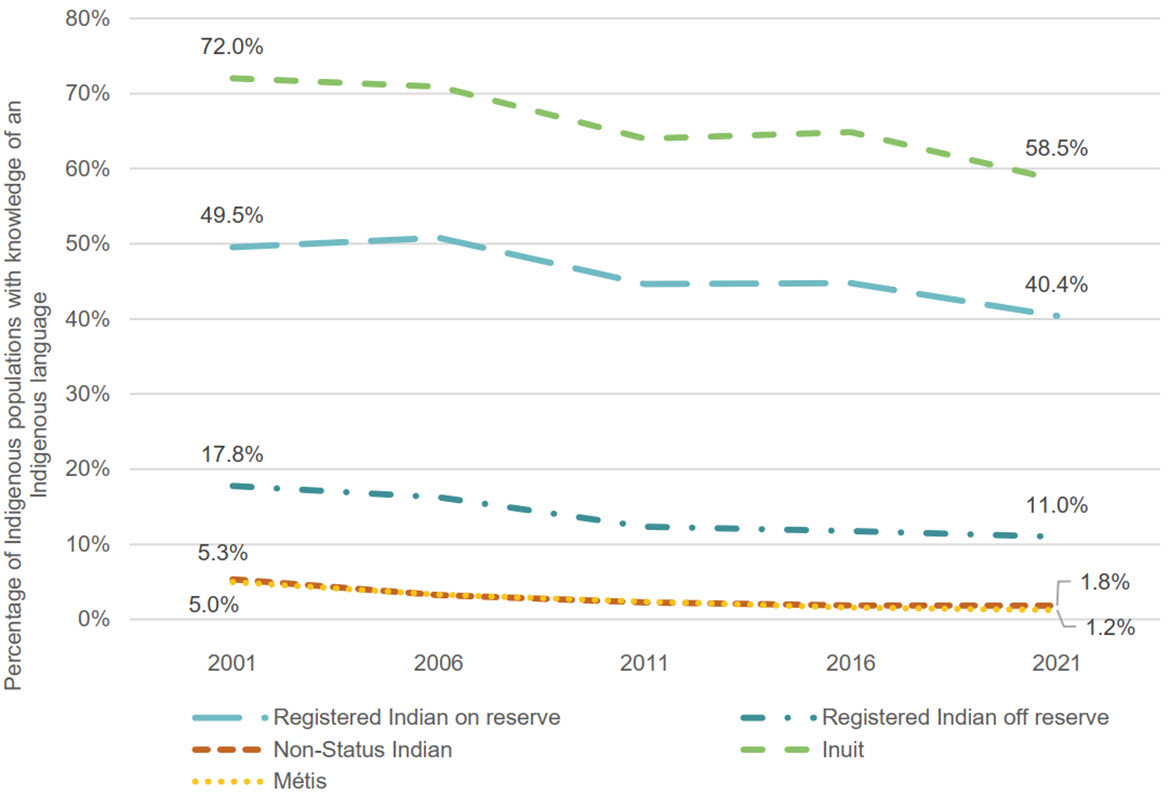
Text alternative for Figure 57: Percentage of Indigenous populations with knowledge of an Indigenous language, 2001 to 2021, Canada
| Registered Indian on reserve | Registered Indian off reserve | Non-Status Indian | Inuit | Métis | |
|---|---|---|---|---|---|
| 2001 | 49.5% | 17.8% | 5.3% | 72.0% | 5.0% |
| 2006 | 50.8% | 16.3% | 3.2% | 70.9% | 3.3% |
| 2011 | 44.6% | 12.3% | 2.2% | 64.0% | 2.4% |
| 2016 | 44.8% | 11.7% | 1.9% | 64.8% | 1.6% |
| 2021 | 40.4% | 11.0% | 1.8% | 58.5% | 1.2% |
Source: Indigenous Services Canada. Custom Tabulations, 2021 Census of Population.
- Indigenous language knowledge has progressively declined over time. Between 2001 and 2021, the proportion of Indigenous respondents self-reporting an ability to converse in an Indigenous language decreased the most among Inuit (13.5 percentage points) and Registered Indians on reserve (9.1 percentage points).
- While less dramatic in scale, the decline in Indigenous language knowledge was nonetheless considerable for Registered Indians living off reserve at 6.8 percentage points, Non-Status Indians at 3.5 percentage points and Métis at 3.8 percentage points.
- It is possible that the declines noted in 2021 were driven in part by the undercounting of First Nations reserves. Given the 63 First Nations communities (identified as Indian reserves and Indian settlements) that were incompletely enumerated in 2021 compared to 14 in 2016, Statistics Canada has urged caution when comparing the 2021 Census data to those of previous census cycles, particularly for variables that are closely tied to reserves such as Indigenous language knowledge.
- The full dataset for this figure is available in Appendix A – Table A10.2.
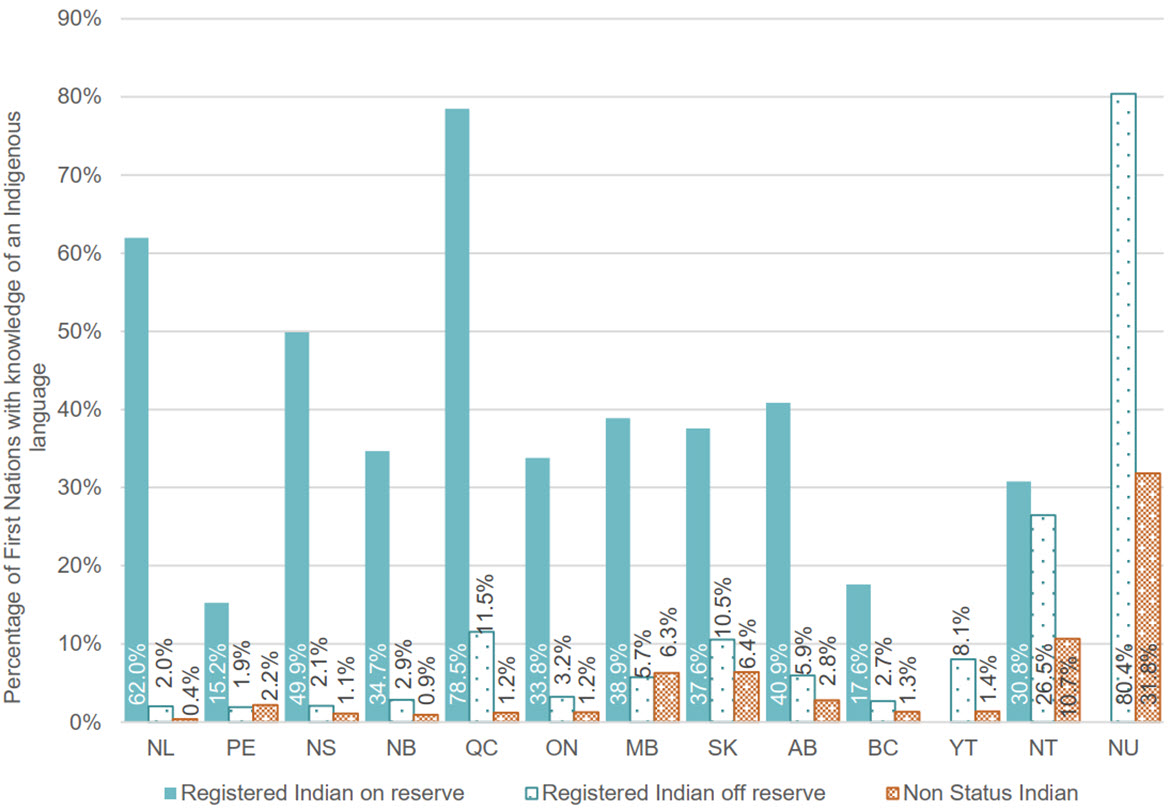
Text alternative for Figure 58: Percentage of First Nations with knowledge of an Indigenous language, 2021, by region
| Registered Indian on reserve | Registered Indian off reserve | Non-Status Indian | |
|---|---|---|---|
| Newfoundland and Labrador | 62.0% | 2.0% | 0.4% |
| Prince Edward Island | 15.2% | 1.9% | 2.2% |
| Nova Scotia | 49.9% | 2.1% | 1.1% |
| New Brunswick | 34.7% | 2.9% | 0.9% |
| Quebec | 78.5% | 11.5% | 1.2% |
| Ontario | 33.8% | 3.2% | 1.2% |
| Manitoba | 38.9% | 5.7% | 6.3% |
| Saskatchewan | 37.6% | 10.5% | 6.4% |
| Alberta | 40.9% | 5.9% | 2.8% |
| British Columbia | 17.6% | 2.7% | 1.3% |
| Yukon | 8.1% | 1.4% | |
| Northwest Territories | 30.8% | 26.5% | 10.7% |
| Nunavut | 80.4% | 31.8% |
Source: Indigenous Services Canada. Custom Tabulations, 2021 Census of Population.
- Among First Nations, the ability to conduct a conversation in an Indigenous language varied considerably across regions. Rates among Registered Indians living on reserve ranged from as low as 15.2% in Prince Edward Island to as high as 78.5% in Quebec.
- For Registered Indians living off reserve, this percentage ranged from 1.9% in Prince Edward Island to 26.5 in the Northwest Territories and 80.4 in Nunavut.
- Indigenous language knowledge among Non-Status Indians was strongest in Nunavut (31.8%) and the Northwest Territories (10.7%), and weakest among those in Newfoundland and Labrador (0.4%) and New Brunswick (0.9%).
- The full dataset for this figure is available in Appendix A – Table A10.3.
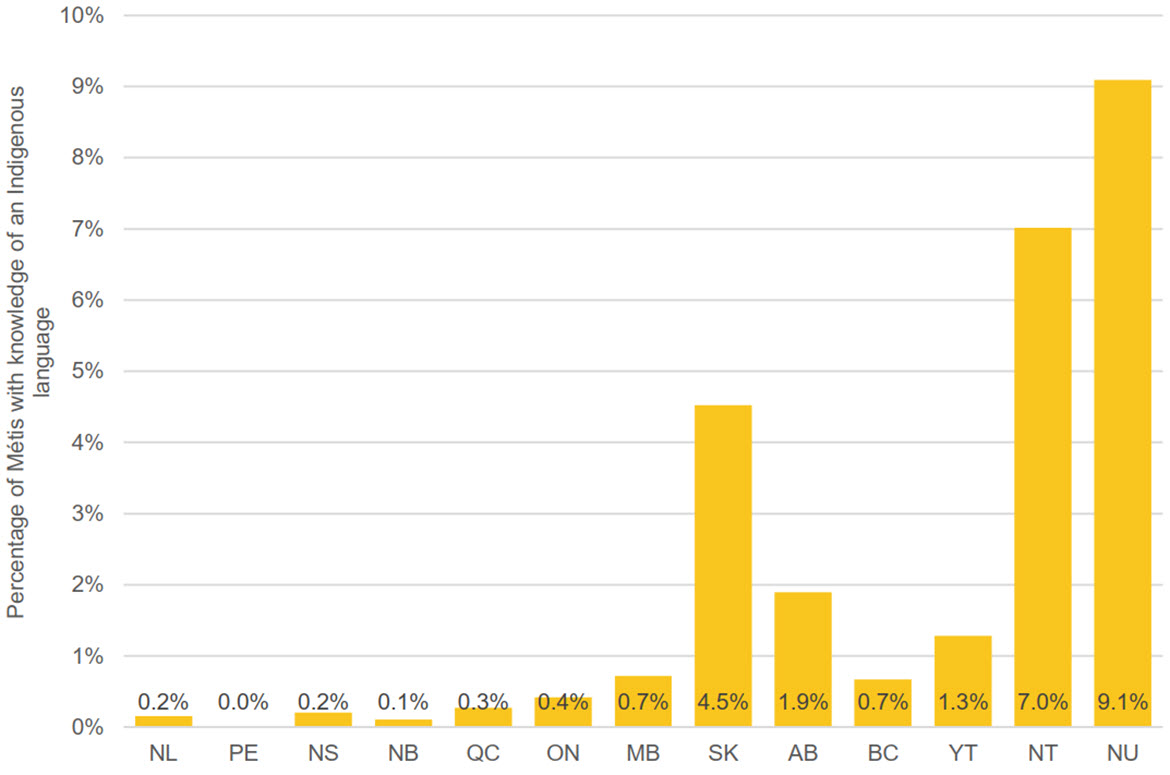
Text alternative for Figure 59: Percentage of Métis with knowledge of an Indigenous language, 2021, by region
| Métis | |
|---|---|
| Newfoundland and Labrador | 0.2% |
| Prince Edward Island | |
| Nova Scotia | 0.2% |
| New Brunswick | 0.1% |
| Quebec | 0.3% |
| Ontario | 0.4% |
| Manitoba | 0.7% |
| Saskatchewan | 4.5% |
| Alberta | 1.9% |
| British Columbia | 0.7% |
| Yukon | 1.3% |
| Northwest Territories | 7.0% |
| Nunavut | 9.1% |
Source: Indigenous Services Canada. Custom Tabulations, 2021 Census of Population.
- Indigenous language knowledge varied for Métis across Canada.
- In 2021, the highest rates were observed among the large Métis populations in Saskatchewan (4.5%) and Alberta (1.9%).
- While the Northwest Territories and Nunavut displayed the highest rates of self-reported ability to converse in an Indigenous language, it is worth emphasizing, yet again, that Métis populations in these regions were small; approximately 110 Métis resided in Nunavut, and 2,495 in the Northwest Territories.
- The full dataset for this figure is available in Appendix A – Table A10.4.
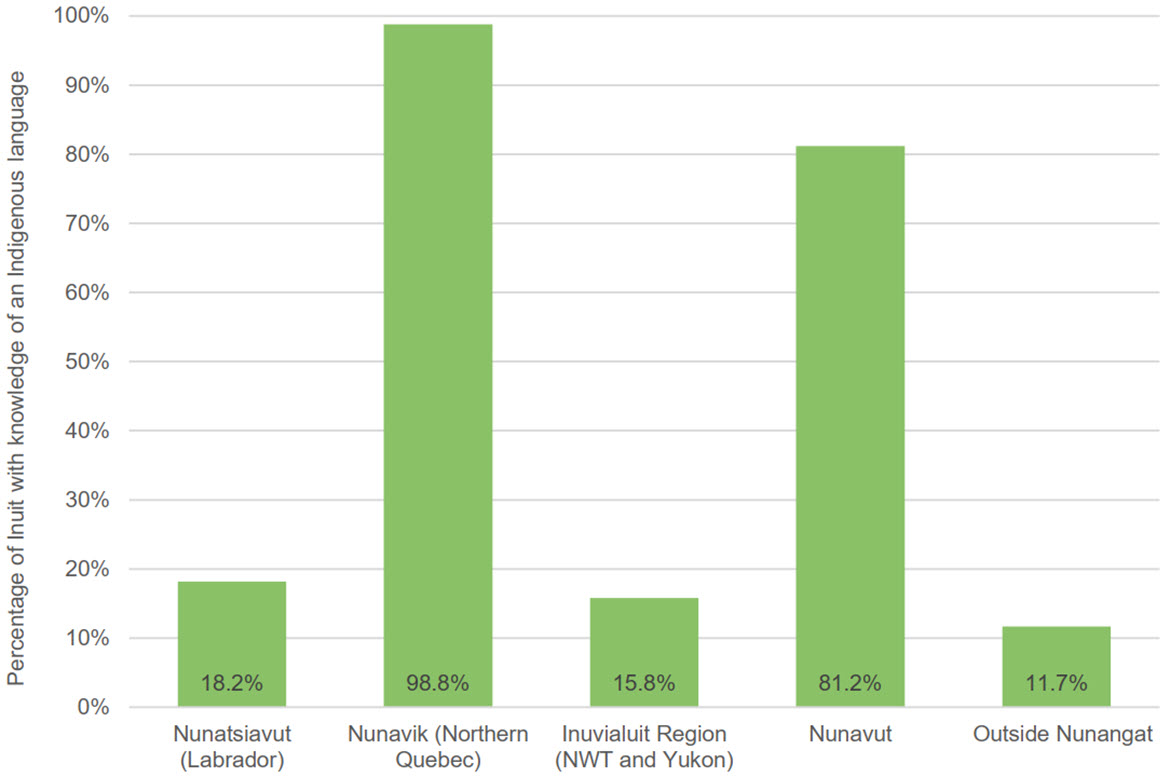
Text alternative for Figure 60: Percentage of Inuit with knowledge of an Indigenous language, 2021, by region
| Inuit | |
|---|---|
| Nunatsiavut (Labrador) | 18.2% |
| Nunavik (Northern Quebec) | 98.8% |
| Inuvialuit Region (Northwest Territories and Yukon) | 15.8% |
| Nunavut | 81.2% |
| Outside Nunangat | 11.7% |
Source: Indigenous Services Canada. Custom Tabulations, 2021 Census of Population.
- There are striking variations in Indigenous language knowledge across the four regions of Inuit Nunangat.
- In 2021, the vast majority of Inuit in Nunavik (98.8%) and Nunavut (81.2%) were able to conduct a conversation in an Indigenous language, compared to less than one-quarter of Inuit in the regions of Nunatsiavut (18.2%) and Inuvialuit (15.8%).
- Among Inuit living outside Inuit Nunangat, knowledge of an Indigenous language was comparatively lower at 11.7%.
- The full dataset for this figure is available in Appendix A – Table A10.5.

Text alternative for Figure 61: Percentage of Indigenous populations with knowledge of an Indigenous language, 2021, by gender, Canada
| Men+ Percentage | Women+ Percentage | |
|---|---|---|
| Registered Indian on reserve | 39.9% | 40.9% |
| Registered Indian off reserve | 10.1% | 11.8% |
| Non-Status Indian | 1.8% | 1.8% |
| Inuit | 58.0% | 59.0% |
| Métis | 1.1% | 1.3% |
Source: Indigenous Services Canada. Custom Tabulations, 2021 Census of Population.
Note: Given that the non-binary population is small, Statistics Canada produced a two-category gender variable that was applied to prevent disclosure of identifiable data for lower levels of geography when necessary. Consequently, information will be disseminated using the following categories: Men+, Women+. Individuals in the "non-binary persons" category are distributed in the other two gender categories and are denoted by the "+" symbol.
- The likelihood of knowing an Indigenous language was similar for men+ and women+ across all Indigenous populations.
- The full dataset for this figure is available in Appendix A – Table A10.6
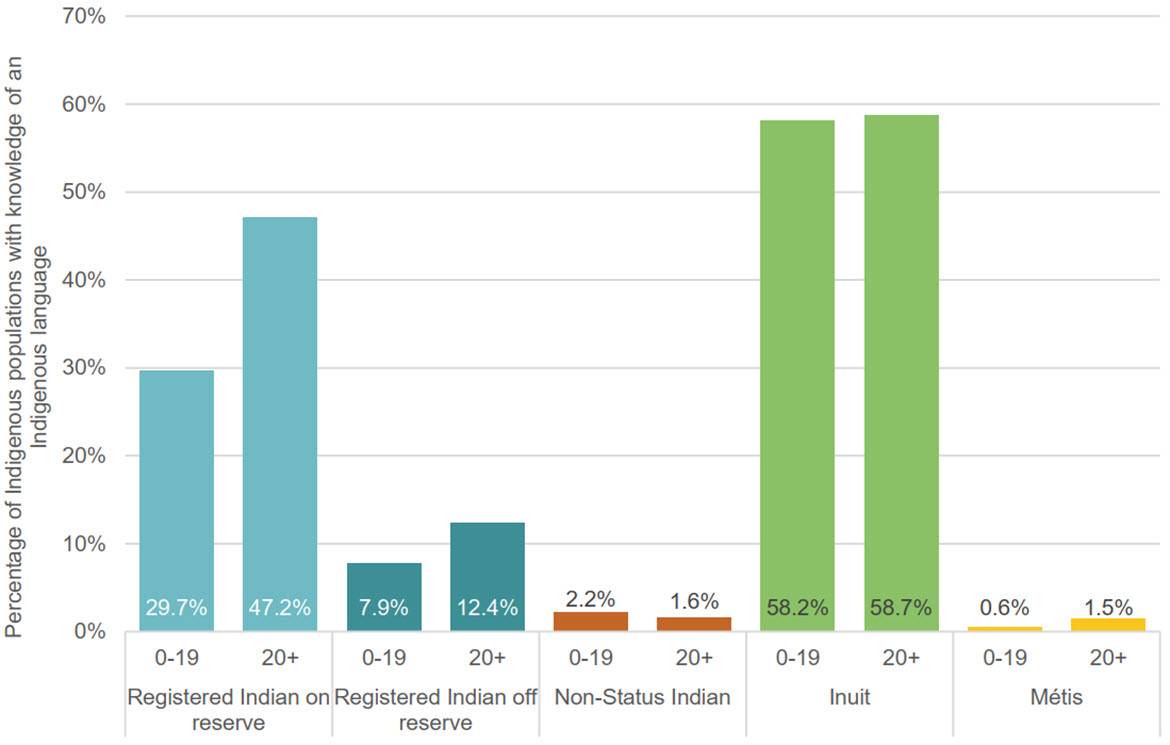
Text alternative for Figure 62: Percentage of Indigenous populations with knowledge of an Indigenous language, 2021, aged 0 to 19 and aged 20+, Canada
| Registered Indian on reserve | Registered Indian off reserve | Non-Status Indian | Inuit | Métis | |||||
|---|---|---|---|---|---|---|---|---|---|
| 0 to 19 | 20+ | 0 to 19 | 20+ | 0 to 19 | 20+ | 0 to 19 | 20+ | 0 to 19 | 20+ |
| 29.7% | 47.2% | 7.9% | 12.4% | 2.2% | 1.6% | 58.2% | 58.7% | 0.6% | 1.5% |
Source: Indigenous Services Canada. Custom Tabulations, 2021 Census of Population.
- Among Registered Indians living on reserve, those aged 0 to 19 (29.7%) were markedly less likely than their older counterparts (47.2%) to be able to conduct a conversation in an Indigenous language.
- A similar pattern was apparent among Registered Indians living off reserve, with 7.9% of those aged 0 to 19 able to conduct a conversation in an Indigenous language, compared to 12.4% of those aged 20+.
- Inuit aged 0 to 19 (58.2%) and aged 20+ (58.7%) showed similar degrees of language knowledge.
- Among Métis aged 0 to 19, the ability to conduct a conversation in an Indigenous language was below (0.6%) that of those aged 20+ (1.5%).
- By contrast, the percentage of Non-Status Indians able to conduct a conversation in an Indigenous language was slightly higher among individuals aged 0–19 (2.2%) than among those aged 20+ (1.6%).
- The full dataset for this figure is available in Appendix A – Table A10.7.
Justice – Incarceration
Disproportionate levels of incarceration can be a strong indicator that a holistic examination is needed of both crime and the institutional responses to it. The Adult Correctional Services Survey collects annual data on the delivery of adult correctional services from both the provincial/territorial and federal correctional systems. Reporting on custody admissions is limited to a pan-Indigenous identifier. In 2021, 46,633 Indigenous people were admitted to remand, custody or community sentence. From 2016 to 2021, the total number of Indigenous adult admissions decreased considerably from 74,823 to 46,633, a difference of 28,190 people (Table 24). For a full list of all data tables relevant to incarceration, please see Appendix A, tables A11.1 to A11.2.
| Indigenous | Non-Indigenous | Indigenous identity unknown | ||||
|---|---|---|---|---|---|---|
| Number | Percentage change from previous year | Number | Percentage change from previous year | Number | Percentage change from previous year | |
| 2016 / 2017 | 74,823 | 175,701 | 1,462 | |||
| 2017 / 2018 | 73,348 | -2.0% | 168,731 | -4.0% | 1,111 | -24.0% |
| 2018 / 2019 | 68,814 | -6.2% | 156,294 | -7.4% | 940 | -15.4% |
| 2019 / 2020 | 67,649 | -1.7% | 158,554 | 1.4% | 921 | -2.0% |
| 2020 / 2021 | 44,941 | -33.6% | 98,218 | -38.1% | 816 | -11.4% |
| 2021 / 2022 | 46,633 | 3.8% | 102,605 | 4.5% | 683 | -16.3% |
Source: Indigenous Services Canada. Custom Tabulations, 2016 to 2017 to 2021 to 2022 Adult Correctional Services Survey. |
||||||

Text alternative for Figure 63: Custody admissions associated with Indigenous and non-Indigenous people in 2021 to 2022 as a percentage of their respective 2021 Census populations, Canada
| Percentage | |
|---|---|
| Indigenous | 2.6% |
| Non-Indigenous | 0.3% |
Source: Indigenous Services Canada. Custom Tabulations, 2021 Census of Population and 2021 to 2022 Adult Correctional Services Survey.
- Figure 64 provides a rough estimate of the differences in incarceration rates between Indigenous and non-Indigenous populations in 2020 to 2021. Specifically, it presents the number of custody admissions associated with Indigenous and non-Indigenous populations in 2020 to 2021 as a percentage of their respective 2021 Census populations.
- Since a single person can have more than one custody admission in a year, this percentage does not represent a true rate.
- It does signal that custody admissions were far more common among Indigenous people than non-Indigenous people.
- The full dataset for this figure is available in Appendix A – Table A11.1.

Text alternative for Figure 64: Percentage of custody admissions of individuals with Indigenous and non-Indigenous identity, 2016 to 2017 to 2020 to 2021, Canada
| 2016 to 2017 | 2017 to 2018 | 2018 to 2019 | 2019 to 2020 | 2020 to 2021 | 2021 to 2022 | |
|---|---|---|---|---|---|---|
| Indigenous | 29.9% | 30.3% | 30.6% | 29.9% | 31.4% | 31.2% |
| Non-Indigenous | 70.1% | 69.7% | 69.4% | 70.1% | 68.6% | 68.8% |
Source: Indigenous Services Canada. Custom Tabulations, 2016 to 2017 to 2021 to 2022 Adult Correctional Services Survey.
- According to the 2021 Census, Indigenous people made up 5.0% of the population of Canada that year. In 2020 to 2021, however, the Adult Correctional Services Survey determined that Indigenous people were involved in 31.2% of custody admissions.
- The percentage of Indigenous adults who entered a correctional facility for remand or who were sentenced to custody or a community supervision program increased slightly from 29.9% in 2016 to 31.2% in 2021.
- The full dataset for this figure is available in Appendix A – Table A11.2.
A focus on urban settings
According to the 2021 Census, about 48.0% of Registered Indians, 75.0% of Non-Status Indians, 50.7% of Inuit, and 71.1% of Métis live in urban areas. Analyses of these data revealed that gaps between Indigenous and non-Indigenous populations living in urban settings are generally similar to those that exist between Indigenous and non-Indigenous populations overall. Employment rates provide a useful illustration.

Text alternative for Figure 65: Comparison of total and urban employment rates, 2021, Indigenous and non-Indigenous populations, aged 25 to 64, Canada
| Registered Indian off reserve | Non-Status Indian | Inuit | Métis | Non-Indigenous | |||||
|---|---|---|---|---|---|---|---|---|---|
| Urban | Total | Urban | Total | Urban | Total | Urban | Total | Urban | Total |
| 58.1% | 58.7% | 65.2% | 64.8% | 59.1% | 55.2% | 69.5% | 69.1% | 74.3% | 74.1% |
Source: Indigenous Services Canada. Custom Tabulations, 2021 Census of Population.
- Urban employment rates were almost identical to total employment rates both in the overall trends and relative to each other.
- In urban settings, the highest employment rate was among Métis (69.5%) and the lowest among Registered Indians living off reserve (58.1%).
- Urban employment rates and corresponding gaps relative to the non-Indigenous population were relatively stable for Registered Indians off reserve, Non-Status Indians and Métis when compared to overall employment trends and disparities (both in urban settings and throughout Canada).
- Among Inuit, the urban employment rate was higher than the total employment rate (59.1% compared to 55.2%).
- Accordingly, the gap in employment rate among Inuit living in urban areas relative to their non-Indigenous counterparts compared to the gap among Inuit in total was slightly smaller, at 20.5 percentage points.
- The full dataset for this figure is available in Appendix A – Tables 12.1 and 12.2.
Measuring the gaps
| 2016 | 2021 | Five-Year Change | ||||
|---|---|---|---|---|---|---|
| Percentage | Gap | Percentage | Gap | Percentage | Percentage change in gap | |
| Registered Indian off reserve | 60.0% | -16.4% | 58.1% | -16.2% | -1.9% | -1.2% |
| Non-Status Indian | 67.1% | -9.3% | 65.2% | -9.1% | -1.9% | -2.2% |
| Inuit | 60.0% | -16.4% | 59.1% | -15.2% | -0.9% | -7.3% |
| Métis | 71.4% | -5.0% | 69.5% | -4.8% | -1.9% | -4.0% |
| Non-Indigenous | 76.4% | 74.3% | -2.1% | |||
Source: Indigenous Services Canada. Custom Tabulations, 2016 to 2021 Census of Population. |
||||||
- The gap in employment rate among Indigenous people in urban areas remained relatively stable from 2016 to 2021 for Registered Indians off reserve, Non-Status Indians and Métis.
- Among Inuit, he the gap in employment rate narrowed by 7.3%, from 16.4% in 2016 to 15.2% in 2021.
Conclusions
Indigenous Peoples in Canada face significant and long-standing socio-economic gaps when compared to non-Indigenous people. These gaps have been shaped by a long history of colonialism, discrimination and marginalization, which have profoundly impacted Indigenous communities and continue to affect their lives today. This report focuses on the gaps for which the Census of Population can be used to assess the scale and scope of changes over time. The Department's 2020 Report to Parliament established baseline measures for many of these indicators and quantified the gaps between the socio-economic well-being of Indigenous Peoples and their non-Indigenous counterparts. In summary, Indigenous Peoples in Canada were found to experience significant disparities in well-being compared to non-Indigenous Canadians. Indigenous Peoples in Canada have lower median incomes and are more likely to live in poverty. They also experience significant employment disparities compared to non-Indigenous Canadians, as the unemployment rate among Indigenous people is generally higher. Indigenous Peoples in Canada experience lower levels of educational attainment compared to non-Indigenous Canadians, including lower rates of high school graduation and university education. They are more likely than non-Indigenous Canadians to experience inadequate housing conditions. In the criminal justice system, Indigenous Peoples are overrepresented in incarceration rates. Indigenous children in Canada are also vastly overrepresented in the child welfare system, accounting for a disproportionate number of children in foster care.
As seen throughout this report, progress has been made towards closing these gaps, but at times the extent of progress can be difficult to assess. Given that a 5.0-percent change would be considered a small effect size, a 12.5-percent change would be considered a medium effect size and a 20-percent change or more would be considered a large effect size, it is possible to examine all domains to determine the direction and size of the relative change in socio-economic gaps between Indigenous Peoples in Canada and the non-Indigenous population (Table 26). For a full summary of each domain, see Appendix B.
From 2015 to 2020, median individual income increased across the board. Even after accounting for inflation, income was higher for all Indigenous identities and increased at a higher rate than that of the non-Indigenous population. A large narrowing of the gap was observed for each Indigenous group, with increases ranging from $4,500 to $9,900 since 2015. Increased income meant fewer households in a low-income situation. Again, a large narrowing of the gap was observed between each Indigenous group and the non-Indigenous population. The narrowing of gaps ranged from 31.8% for Inuit to 46.5% for Non-Status Indians. The total number of Indigenous people living in a low-income situation dropped from 471,560 in 2015 to 335,560 in 2020. Overall, 136,000 fewer Indigenous people (60,190 Registered Indians living on reserve, 45,030 Registered Indians living off reserve, 8,975 Non-Status Indians, 2,840 Inuit and 18,965 Métis) were living in a low-income situation since 2015.
| Registered Indian on reserve | Registered Indian off reserve | Non-Status Indian | Inuit | Métis | |
|---|---|---|---|---|---|
| Median Individual Income (adjusted) | Large Narrowing | Large Narrowing | Large Narrowing | Large Narrowing | Large Narrowing |
| Percentage Living in a Low-Income Situation | Large Narrowing | Large Narrowing | Large Narrowing | Large Narrowing | Large Narrowing |
| Employment Rate | Small Narrowing | No change | Small Narrowing | No change | Small Narrowing |
| Median Employment Income (adjusted) | Medium Narrowing | No change | Small Widening | Large Narrowing | Large Widening |
| Percentage with at Least a High School Credential | No change | Small Narrowing | Small Narrowing | No change | Large Narrowing |
| Percentage with a University Degree | Medium Widening | Medium Widening | Medium Widening | Large Widening | Medium Widening |
| Percentage of Dwellings Classified as Crowded | Medium Narrowing | Large Narrowing | No Gap | Medium Narrowing | No Gap |
| Percentage of Dwellings in Need of Major Repair | Medium Narrowing | Medium Narrowing | Large Narrowing | No change | Medium Narrowing |
| Percentage of Children Aged 0 to 17 in Foster Care | No change | No change | No change | Large Widening | No change |
| Employment Rate (Urban Areas) | N/A | No change | No change | Small Narrowing | No change |
Source: Indigenous Services Canada. Custom Tabulations, 2016 to 2021 Census of Population. |
|||||
Since 2016, there have been slight improvements in the gaps in employment rate relative to the non-Indigenous population for Registered Indians living on reserve, Non-Status Indians and Métis. Even though the gaps remained stable for Registered Indians living off reserve and Inuit, the 2021 findings are noteworthy. Given the employment challenges presented by the COVID-19 pandemic such as lockdowns, business closures and changes in consumer habits, the fact that Indigenous people remained employed at proportionate levels to their non-Indigenous peers is an important finding. In 2016, 502,925 Indigenous people were employed, and that number rose to 538,415 in 2021; an additional 35,490 Indigenous people were working in 2021 with increases across all Indigenous groups (10,020 Registered Indians living off reserve, 16,725 Non-Status Indians, 1,040 Inuit and 10,060 Métis) with the exception of Registered Indians living on reserve, who saw a decline of 2,355 employed people. The gaps in employment income were more varied, as the gap narrowed for some groups (Registered Indians living on reserve and Inuit), one group saw no change (Registered Indians living off reserve) and for others, the gap widened (Non-Status Indians and Métis). Despite these differences, employment income was higher in 2020 for all Indigenous groups, even after accounting for inflation, with individuals bringing home an additional $800 to $4,200 per year in income. Census 2026 will be important to determine how the increased availability of government benefits during the COVID-19 pandemic impacted income and employment. Census 2026 will be crucial in helping contextualize the historic implications of the pandemic on the socio-economic well-being of all Canadians.
In total, 80,280 more Indigenous people aged 25 to 64 had a high school education in 2021 than in 2016 (925 Registered Indians living on reserve, 26,150 Registered Indians living off reserve, 25,545 Non-Status Indians, 1,730 Inuit and 25,930 Métis). For Registered Indians living off reserve, Non-Status Indians and Métis, the gaps in the proportion of those 25 to 64 years of age with at least a high school education compared to the non-Indigenous population narrowed, ranging from 10.1 to 24.6%. From 2016 to 2021, an additional 47,980 Indigenous people (4,985 Registered Indians living on reserve, 14,630 Registered Indians living off reserve, 9,200 Non-Status Indians, 890 Inuit and 18,275 Métis) obtained a university education. Despite these gains, the gaps in university completion relative to the non-Indigenous population widened for all Indigenous groups, from 15.9 to 22.9%. Education is the key to breaking the cycle of poverty. By improving education outcomes among Indigenous people, we can equip individuals with the knowledge and skills necessary to succeed in the modern economy. This can help Indigenous people secure higher-paying jobs and improve their overall economic well-being. Education is a powerful tool for promoting social inclusion and cultural revitalization. Indigenous education can help preserve and revitalize traditional cultures and languages, which are important components of Indigenous identity. This can foster a sense of belonging and pride in Indigenous communities, which can lead to improved mental health and social cohesion. Improving Indigenous education can also help address the historical injustices and traumas experienced by Indigenous Peoples.
Generally speaking, housing quality and conditions improved for Indigenous people from 2016 to 2021. The gaps in both the proportion of dwellings that were crowded and the proportion of dwellings in need of major repair generally narrowed between census cycles. However, the narrowing of the gap in the proportion of crowded dwellings was due in part to increases in crowded dwellings among the non-Indigenous population. The greatest decline in the number of crowded dwellings was found among Registered Indians living on reserve, from 12,160 crowded dwellings in 2016 to 10,705 in 2021, a difference of 1,455. From 2016 to 2021, although the non-Indigenous dwellings in need of major repair increased by 2,525, the number of Indigenous dwellings in need of major repair dropped by 3,715. This decline was driven by 6,005 fewer dwellings of Registered Indians living on reserve and 485 fewer dwellings of Registered Indians living off reserve requiring major repair.
Indigenous children continue to be overrepresented in foster care. The census data collection method identifies only children in foster care who reside in a private home. It excludes those in institutions, group homes or other care arrangements. The proportions of Registered Indian, Non-Status Indian and Métis children in foster care were actually fairly stable over the period. The proportion of Inuit children in foster care increased by almost 1.0%. In total, there were 17,410 Indigenous children in foster care in 2016 compared to 17,320 in 2021.
In addition to socio-economic gaps, declines in Indigenous language knowledge are noteworthy. In 2021, 243,155 individuals could conduct a conversation in an Indigenous language, 188,905 people reported having at least one Indigenous mother tongue and 182,925 reported speaking an Indigenous language at home at least on a regular basis. In 2021, there were over 70 Indigenous languages spoken in Canada. For more than 20 (28.6%) of those languages, 500 or fewer people reported speaking them as their mother tongue. Indigenous languages are a vital part of the country's cultural and linguistic diversity and are essential to Indigenous Peoples' identity, culture and well-being. Many of the Indigenous languages in Canada are endangered, facing the risk of extinction due to the impacts of colonialism, residential schools and ongoing discrimination. The loss of Indigenous languages has significant impacts on Indigenous Peoples' well-being, cultural identity and sense of belonging. Language loss also results in the loss of traditional knowledge and cultural practices.
Indigenous Peoples in Canada continue to be overrepresented in the criminal justice system, as both victims and offenders. From 2016 to 2021, the percentage of Indigenous adults who entered a correctional facility for remand or who were sentenced to custody or a community supervision program increased slightly from 29.9% to 31.2%. However, the total number of these admissions decreased considerably during this same period, from 74,823 in 2016 to 46,633 in 2021, a difference of 28,190 people.
Addressing socio-economic gaps between Indigenous and non-Indigenous people in areas such as income, employment, education, housing, foster care and incarceration is crucial for reconciliation. These gaps are a result of systemic barriers and inequalities that have led to the marginalization of Indigenous Peoples.
Addressing these socio-economic gaps requires a holistic approach that takes into account not only economic factors but also social, cultural and spiritual factors. This includes supporting language and cultural revitalization, improving access to education and promoting community empowerment. Further narrowing the disparities between the Indigenous and non-Indigenous populations will require additional commitments to address historical and ongoing injustices, support Indigenous self-determination and incorporate Indigenous knowledge and perspectives into policy and program development. Indigenous-led solutions and approaches are necessary to address the socio-economic gaps experienced by Indigenous Peoples in Canada.
Appendix A
Median individual income
| Income | Difference from non-Indigenous Population | |
|---|---|---|
| Registered Indian on reserve | $32,000 | -$18,400 |
| Registered Indian off reserve | $42,000 | -$8,400 |
| Non-Status Indian | $43,200 | -$7,200 |
| Inuit | $42,800 | -$7,600 |
| Métis | $48,800 | -$1,600 |
| Non-Indigenous | $50,400 | |
Source: Indigenous Services Canada. Custom Tabulations, 2021 Census of Population. |
||
| Registered Indian on reserve | Registered Indian off reserve | Non-Status Indian | Inuit | Métis | Non-Indigenous | ||||||
|---|---|---|---|---|---|---|---|---|---|---|---|
| Income | Difference from non-Indigenous Population | Income | Difference from non-Indigenous Population | Income | Difference from non-Indigenous Population | Income | Difference from non-Indigenous Population | Income | Difference from non-Indigenous Population | Income | |
| 2005 | $17,700 | -$24,100 | $27,700 | -$14,100 | $30,800 | -$11,000 | $31,000 | -$10,800 | $35,200 | -$6,600 | $41,800 |
| 2010 | $18,200 | -$26,200 | $32,300 | -$12,100 | $34,700 | -$9,600 | $34,200 | -$10,200 | $40,300 | -$4,000 | $44,400 |
| 2015 | $22,100 | -$24,500 | $35,400 | -$11,300 | $37,400 | -$9,200 | $36,000 | -$10,600 | $44,300 | -$2,300 | $46,600 |
| 2020 | $32,000 | -$18,400 | $42,000 | -$8,400 | $43,200 | -$7,200 | $42,800 | -$7,600 | $48,800 | -$1,600 | $50,400 |
Source: Indigenous Services Canada. Custom Tabulations, 2006 to 2021 Census of Population. Note: The dollar values have been adjusted for inflation and are stated in terms of their value in 2020. |
|||||||||||
| Registered Indian on reserve | Registered Indian off reserve | Non-Status Indian | Non-Indigenous | ||||
|---|---|---|---|---|---|---|---|
| Income | Difference from non-Indigenous Population | Income | Difference from non-Indigenous Population | Income | Difference from non-Indigenous Population | Income | |
| Newfoundland and Labrador | $44,800 | -$1,200 | $42,800 | -$3,200 | $43,200 | -$2,800 | $46,000 |
| Prince Edward Island | $38,400 | -$7,200 | $41,200 | -$4,400 | $34,800 | -$10,800 | $45,600 |
| Nova Scotia | $32,400 | -$13,200 | $43,600 | -$2,000 | $39,600 | -$6,000 | $45,600 |
| New Brunswick | $35,600 | -$9,600 | $40,400 | -$4,800 | $36,800 | -$8,400 | $45,200 |
| Quebec | $44,800 | -$5,200 | $46,800 | -$3,200 | $45,200 | -$4,800 | $50,000 |
| Ontario | $32,400 | -$18,000 | $44,000 | -$6,400 | $42,400 | -$8,000 | $50,400 |
| Manitoba | $28,000 | -$20,800 | $36,400 | -$12,400 | $40,000 | -$8,800 | $48,800 |
| Saskatchewan | $27,000 | -$26,600 | $39,200 | -$14,400 | $41,200 | -$12,400 | $53,600 |
| Alberta | $31,200 | -$23,200 | $42,400 | -$12,000 | $45,900 | -$8,500 | $54,400 |
| British Columbia | $32,400 | -$17,600 | $42,400 | -$7,600 | $44,000 | -$6,000 | $50,000 |
| Yukon | $50,800 | -$17,700 | $62,000 | -$6,500 | $68,500 | ||
| Northwest Territories | $39,200 | -$49,800 | $47,600 | -$41,400 | $69,000 | -$20,000 | $89,000 |
| Nunavut | $100,000 | -$16,000 | $92,000 | -$24,000 | $116,000 | ||
Source: Indigenous Services Canada. Custom Tabulations, 2021 Census of Population. |
|||||||
| Métis | Non-Indigenous | ||
|---|---|---|---|
| Income | Difference from non-Indigenous Population | Income | |
| Newfoundland and Labrador | $48,400 | $2,400 | $46,000 |
| Prince Edward Island | $51,600 | $6,000 | $45,600 |
| Nova Scotia | $44,000 | -$1,600 | $45,600 |
| New Brunswick | $40,400 | -$4,800 | $45,200 |
| Quebec | $47,600 | -$2,400 | $50,000 |
| Ontario | $49,200 | -$1,200 | $50,400 |
| Manitoba | $47,600 | -$1,200 | $48,800 |
| Saskatchewan | $49,200 | -$4,400 | $53,600 |
| Alberta | $50,800 | -$3,600 | $54,400 |
| British Columbia | $48,400 | -$1,600 | $50,000 |
| Yukon | $61,600 | -$6,900 | $68,500 |
| Northwest Territories | $79,000 | -$10,000 | $89,000 |
| Nunavut | $125,000 | $9,000 | $116,000 |
Source: Indigenous Services Canada. Custom Tabulations, 2021 Census of Population. |
|||
| Inuit | Non-Indigenous | ||
|---|---|---|---|
| Income | Difference from non-Indigenous Population | Income | |
| Nunatsiavut (Labrador) | $40,400 | -$23,200 | $63,600 |
| Nunavik (Northern Quebec) | $45,600 | -$38,400 | $84,000 |
| Inuvialuit Region (Northwest Territories and Yukon) | $41,600 | -$56,000 | $97,000 |
| Nunavut | $40,400 | -$75,600 | $116,000 |
| Outside of Inuit Nunangat | $44,000 | -$6,400 | $50,400 |
Source: Indigenous Services Canada. Custom Tabulations, 2021 Census of Population. |
|||
| Men+ | Women+ | |||
|---|---|---|---|---|
| Income | Difference from non-Indigenous Population | Income | Difference from non-Indigenous Population | |
| Registered Indian on reserve | $17,000 | -$33,500 | $23,300 | -$13,700 |
| Registered Indian off reserve | $37,900 | -$12,600 | $29,600 | -$7,400 |
| Non-Status Indian | $40,700 | -$9,800 | $30,200 | -$6,800 |
| Inuit | $32,600 | -$18,000 | $33,400 | -$3,600 |
| Métis | $50,000 | -$500 | $34,500 | -$2,500 |
| Non-Indigenous | $50,500 | $37,000 | ||
| Men+ | Women+ | |||
|---|---|---|---|---|
| Income | Difference from non-Indigenous Population | Income | Difference from non-Indigenous Population | |
| Registered Indian on reserve | $27,400 | -$29,400 | $36,800 | -$8,400 |
| Registered Indian off reserve | $44,000 | -$12,800 | $41,200 | -$4,000 |
| Non-Status Indian | $47,200 | -$9,600 | $40,800 | -$4,400 |
| Inuit | $39,600 | -$17,200 | $45,200 | $0 |
| Métis | $55,200 | -$1,600 | $44,000 | -$1,200 |
| Non-Indigenous | $56,800 | $45,200 | ||
Source: Indigenous Services Canada. Custom Tabulations, 2016 to 2021 Census of Population. Note: Given that the non-binary population is small, Statistics Canada implemented a method producing a two-category gender variable to prevent disclosure of identifiable data for lower levels of geography. Consequently, information will be disseminated using the following categories: Men+, Women+. Individuals in the "non-binary persons" category are distributed in the other two gender categories and are denoted by the "+" symbol. |
||||
Low-income measure after tax
| Percentage | Percentage Difference from non-Indigenous Population | |
|---|---|---|
| Registered Indian on reserve | 31.3% | 20.6% |
| Registered Indian off reserve | 19.8% | 9.1% |
| Non-Status Indian | 16.8% | 6.1% |
| Inuit | 16.5% | 5.8% |
| Métis | 12.6% | 1.9% |
| Non-Indigenous | 10.7% | |
Source: Indigenous Services Canada. Custom Tabulations, 2021 Census of Population. |
||
| Registered Indian on reserve | Registered Indian off reserve | Non-Status Indian | Inuit | Métis | Non-Indigenous | ||||||
|---|---|---|---|---|---|---|---|---|---|---|---|
| Percentage | Difference from non-Indigenous Population | Percentage | Difference from non-Indigenous Population | Percentage | Difference from non-Indigenous Population | Percentage | Difference from non-Indigenous Population | Percentage | Difference from non-Indigenous Population | Percentage | |
| 2005 | 50.7% | 37.1% | 36.7% | 23.1% | 27.5% | 13.9% | 26.3% | 12.7% | 21.0% | 7.4% | 13.6% |
| 2010 | 54.1% | 39.5% | 31.9% | 17.3% | 25.3% | 10.7% | 22.9% | 8.3% | 19.5% | 4.9% | 14.6% |
| 2015 | 47.7% | 33.9% | 30.3% | 16.5% | 25.2% | 11.4% | 22.3% | 8.5% | 17.3% | 3.5% | 13.8% |
| 2020 | 31.3% | 20.6% | 19.8% | 9.1% | 16.8% | 6.1% | 16.5% | 5.8% | 12.6% | 1.9% | 10.7% |
Source: Indigenous Services Canada. Custom Tabulations, 2006 to 2021 Census of Population. |
|||||||||||
| Registered Indian on reserve | Registered Indian off reserve | Non-Status Indian | Non-Indigenous | ||||
|---|---|---|---|---|---|---|---|
| Percentage | Difference from non-Indigenous Population | Percentage | Difference from non-Indigenous Population | Percentage | Difference from non-Indigenous Population | Percentage | |
| Newfoundland and Labrador | 12.4% | -2.8% | 15.9% | 0.7% | 15.0% | -0.2% | 15.2% |
| Prince Edward Island | 21.8% | 8.1% | 20.3% | 6.6% | 18.3% | 4.6% | 13.7% |
| Nova Scotia | 35.2% | 20.6% | 17.5% | 2.9% | 20.4% | 5.8% | 14.6% |
| New Brunswick | 24.0% | 10.0% | 16.3% | 2.3% | 21.1% | 7.1% | 14.0% |
| Quebec | 14.8% | 3.0% | 16.5% | 4.7% | 15.4% | 3.6% | 11.8% |
| Ontario | 33.7% | 23.8% | 16.8% | 6.9% | 16.0% | 6.1% | 9.9% |
| Manitoba | 38.5% | 27.0% | 30.6% | 19.1% | 31.0% | 19.5% | 11.5% |
| Saskatchewan | 40.9% | 30.2% | 26.6% | 15.9% | 28.8% | 18.1% | 10.7% |
| Alberta | 29.8% | 21.2% | 19.5% | 10.9% | 15.2% | 6.6% | 8.6% |
| British Columbia | 25.0% | 14.5% | 15.9% | 5.4% | 13.9% | 3.4% | 10.5% |
| Yukon | 12.9% | 6.5% | 12.7% | 6.3% | 6.4% | ||
| Northwest Territories | 18.4% | 15.5% | 11.3% | 8.4% | 6.7% | 3.8% | 2.9% |
| Nunavut | 8.0% | 4.6% | 9.1% | 5.7% | 3.4% | ||
Source: Indigenous Services Canada. Custom Tabulations, 2021 Census of Population. |
|||||||
| Métis | Non-Indigenous | ||
|---|---|---|---|
| Percentage | Difference from non-Indigenous Population | Percentage | |
| Newfoundland and Labrador | 10.2% | -5.0% | 15.2% |
| Prince Edward Island | 13.6% | -0.1% | 13.7% |
| Nova Scotia | 14.0% | -0.6% | 14.6% |
| New Brunswick | 16.4% | 2.4% | 14.0% |
| Quebec | 15.9% | 4.1% | 11.8% |
| Ontario | 11.3% | 1.4% | 9.9% |
| Manitoba | 14.5% | 3.0% | 11.5% |
| Saskatchewan | 14.5% | 3.8% | 10.7% |
| Alberta | 11.4% | 2.8% | 8.6% |
| British Columbia | 10.7% | 0.2% | 10.5% |
| Yukon | 5.1% | -1.3% | 6.4% |
| Northwest Territories | 6.8% | 3.9% | 2.9% |
| Nunavut | 3.4% | ||
Source: Indigenous Services Canada. Custom Tabulations, 2021 Census of Population. |
|||
| Inuit | Non-Indigenous | ||
|---|---|---|---|
| Percentage | Difference from non-Indigenous Population | Percentage | |
| Nunatsiavut (Labrador) | 22.2% | 8.9% | 13.3% |
| Nunavik (Northern Quebec) | 15.1% | 9.3% | 5.8% |
| Inuvialuit Region (Northwest Territories and Yukon) | 16.1% | 10.4% | 5.7% |
| Nunavut | 16.7% | 13.3% | 3.4% |
| Outside of Inuit Nunangat | 16.5% | 5.8% | 10.7% |
Source: Indigenous Services Canada. Custom Tabulations, 2021 Census of Population. |
|||
| Men+ | Women+ | |||
|---|---|---|---|---|
| Percentage | Difference from non-Indigenous Population | Percentage | Difference from non-Indigenous Population | |
| Registered Indian on reserve | 47.7% | 34.6% | 47.7% | 33.2% |
| Registered Indian off reserve | 28.4% | 15.3% | 31.9% | 17.4% |
| Non-Status Indian | 24.3% | 11.2% | 26.1% | 11.6% |
| Inuit | 22.1% | 9.0% | 22.5% | 8.0% |
| Métis | 16.0% | 2.9% | 18.5% | 4.0% |
| Non-Indigenous | 13.1% | 14.5% | ||
| Men+ | Women+ | |||
|---|---|---|---|---|
| Percentage | Difference from non-Indigenous Population | Percentage | Difference from non-Indigenous Population | |
| Registered Indian on reserve | 31.2% | 21.1% | 31.4% | 20.20% |
| Registered Indian off reserve | 18.4% | 8.3% | 21.0% | 9.80% |
| Non-Status Indian | 16.3% | 6.2% | 17.3% | 6.10% |
| Inuit | 16.1% | 6.0% | 16.8% | 5.60% |
| Métis | 11.9% | 1.8% | 13.3% | 2.10% |
| Non-Indigenous | 10.1% | 11.2% | ||
Source: Indigenous Services Canada. Custom Tabulations, 2016 to 2021 Census of Population. Note: Given that the non-binary population is small, Statistics Canada implemented a method producing a two-category gender variable to prevent disclosure of identifiable data for lower levels of geography. Consequently, information will be disseminated using the following categories: Men+, Women+. Individuals in the "non-binary persons" category are distributed in the other two gender categories and are denoted by the "+" symbol. |
||||
Employment rate
| Percentage | Difference from non-Indigenous Population | |
|---|---|---|
| Registered Indian on reserve | 47.1% | -27.0% |
| Registered Indian off reserve | 58.7% | -15.4% |
| Non-Status Indian | 64.8% | -9.3% |
| Inuit | 55.2% | -18.9% |
| Métis | 69.1% | -5.0% |
| Non-Indigenous | 74.1% | |
Source: Indigenous Services Canada. Custom Tabulations, 2021 Census of Population. |
||
| Registered Indian on reserve | Registered Indian off reserve | Non-Status Indian | Inuit | Métis | Non-Indigenous | ||||||
|---|---|---|---|---|---|---|---|---|---|---|---|
| Percentage | Difference from non-Indigenous Population | Percentage | Difference from non-Indigenous Population | Percentage | Difference from non-Indigenous Population | Percentage | Difference from non-Indigenous Population | Percentage | Difference from non-Indigenous Population | Percentage | |
| 2001 | 48.1% | -27.0% | 56.4% | -18.7% | 63.3% | -11.8% | 59.0% | -16.1% | 67.9% | -7.2% | 75.1% |
| 2006 | 50.2% | -26.1% | 61.8% | -14.5% | 67.4% | -8.9% | 59.7% | -16.6% | 71.5% | -4.8% | 76.3% |
| 2011 | 46.8% | -29.0% | 61.2% | -14.6% | 67.0% | -8.8% | 58.6% | -17.2% | 71.6% | -4.2% | 75.8% |
| 2016 | 46.9% | -29.1% | 60.2% | -15.8% | 66.1% | -9.9% | 57.4% | -18.6% | 70.4% | -5.6% | 76.0% |
| 2021 | 47.1% | -27.0% | 58.7% | -15.4% | 64.8% | -9.3% | 55.2% | -18.9% | 69.1% | -5.0% | 74.1% |
Source: Indigenous Services Canada. Custom Tabulations, 2001 to 2021 Census of Population. |
|||||||||||
| Registered Indian on reserve | Registered Indian off reserve | Non-Status Indian | Non-Indigenous | ||||
|---|---|---|---|---|---|---|---|
| Percentage | Difference from non-Indigenous Population | Percentage | Difference from non-Indigenous Population | Percentage | Difference from non-Indigenous Population | Percentage | |
| Newfoundland and Labrador | 51.2% | -13.7% | 62.9% | -2.0% | 60.0% | -4.9% | 64.9% |
| Prince Edward Island | 60.0% | -16.4% | 67.8% | -8.6% | 63.8% | -12.6% | 76.4% |
| Nova Scotia | 45.8% | -23.9% | 65.1% | -4.6% | 61.8% | -7.9% | 69.7% |
| New Brunswick | 49.4% | -22.9% | 65.3% | -7.0% | 61.8% | -10.5% | 72.3% |
| Quebec | 62.4% | -14.7% | 69.2% | -7.9% | 70.4% | -6.7% | 77.1% |
| Ontario | 51.7% | -20.2% | 60.6% | -11.3% | 61.0% | -10.9% | 71.9% |
| Manitoba | 41.6% | -36.0% | 49.3% | -28.3% | 58.9% | -18.7% | 77.6% |
| Saskatchewan | 37.1% | -41.8% | 49.3% | -29.6% | 60.6% | -18.3% | 78.9% |
| Alberta | 40.4% | -34.4% | 56.4% | -18.4% | 65.0% | -9.8% | 74.8% |
| British Columbia | 51.3% | -23.9% | 62.4% | -12.8% | 69.3% | -5.9% | 75.2% |
| Yukon | 60.9% | -22.0% | 73.6% | -9.3% | 82.9% | ||
| Northwest Territories | 45.5% | -40.6% | 58.0% | -28.1% | 72.4% | -13.7% | 86.1% |
| Nunavut | 87.5% | -2.4% | 76.9% | -13.0% | 89.9% | ||
Source: Indigenous Services Canada. Custom Tabulations, 2021 Census of Population. |
|||||||
| Métis | Non-Indigenous | ||
|---|---|---|---|
| Percentage | Percentage Difference from non-Indigenous Population | Percentage | |
| Newfoundland and Labrador | 62.7% | -2.2% | 64.9% |
| Prince Edward Island | 76.5% | 0.1% | 76.4% |
| Nova Scotia | 66.7% | -3.0% | 69.7% |
| New Brunswick | 63.0% | -9.3% | 72.3% |
| Quebec | 70.3% | -6.8% | 77.1% |
| Ontario | 66.7% | -5.2% | 71.9% |
| Manitoba | 70.8% | -6.8% | 77.6% |
| Saskatchewan | 69.5% | -9.4% | 78.9% |
| Alberta | 68.8% | -6.0% | 74.8% |
| British Columbia | 71.7% | -3.5% | 75.2% |
| Yukon | 73.5% | -9.4% | 82.9% |
| Northwest Territories | 75.4% | -10.7% | 86.1% |
| Nunavut | 94.4% | 4.5% | 89.9% |
Source: Indigenous Services Canada. Custom Tabulations, 2021 Census of Population. |
|||
| Inuit | Non-Indigenous | ||
|---|---|---|---|
| Percentage | Difference from non-Indigenous Population | Percentage | |
| Nunatsiavut (Labrador) | 51.2% | -22.5% | 73.7% |
| Nunavik (Northern Quebec) | 60.8% | -28.8% | 89.6% |
| Inuvialuit Region (Northwest Territories and Yukon) | 54.1% | -33.0% | 87.1% |
| Nunavut | 47.9% | -42.0% | 89.9% |
| Outside of Inuit Nunangat | 62.2% | -11.9% | 74.1% |
Source: Indigenous Services Canada. Custom Tabulations, 2021 Census of Population. |
|||
| Men+ | Women+ | |||
|---|---|---|---|---|
| Percentage | Difference from non-Indigenous Population | Percentage | Difference from non-Indigenous Population | |
| Registered Indian on reserve | 45.5% | -34.5% | 48.2% | -23.9% |
| Registered Indian off reserve | 63.8% | -16.2% | 57.3% | -14.8% |
| Non-Status Indian | 68.9% | -11.1% | 63.7% | -8.4% |
| Inuit | 56.9% | -23.1% | 57.8% | -14.3% |
| Métis | 72.6% | -7.4% | 68.4% | -3.7% |
| Non-Indigenous | 80.0% | 72.1% | ||
| Men+ | Women+ | |||
|---|---|---|---|---|
| Percentage | Difference from non-Indigenous Population | Percentage | Difference from non-Indigenous Population | |
| Registered Indian on reserve | 47.2% | -31.1% | 47.0% | -23.1% |
| Registered Indian off reserve | 61.7% | -16.6% | 56.2% | -13.9% |
| Non-Status Indian | 67.2% | -11.1% | 62.8% | -7.3% |
| Inuit | 54.4% | -23.9% | 55.9% | -14.2% |
| Métis | 71.7% | -6.6% | 66.8% | -3.3% |
| Non-Indigenous | 78.3% | 70.1% | ||
Source: Indigenous Services Canada. Custom Tabulations, 2016 to 2021 Census of Population. Note: Given that the non-binary population is small, Statistics Canada implemented a method producing a two-category gender variable to prevent disclosure of identifiable data for lower levels of geography. Consequently, information will be disseminated using the following categories: Men+, Women+. Individuals in the "non-binary persons" category are distributed in the other two gender categories and are denoted by the "+" symbol. |
||||
Employment income
| Income | Difference from non-Indigenous Population | |
|---|---|---|
| Registered Indian on reserve | $29,400 | -$18,200 |
| Registered Indian off reserve | $40,000 | -$7,600 |
| Non-Status Indian | $40,400 | -$7,200 |
| Inuit | $39,600 | -$8,000 |
| Métis | $45,600 | -$2,000 |
| Non-Indigenous | $47,600 | |
Source: Indigenous Services Canada. Custom Tabulations, 2021 Census of Population. |
||
| Registered Indian on reserve | Registered Indian off reserve | Non-Status Indian | Inuit | Métis | Non-Indigenous | ||||||
|---|---|---|---|---|---|---|---|---|---|---|---|
| Income | Difference from non-Indigenous Population | Income | Difference from non-Indigenous Population | Income | Difference from non-Indigenous Population | Income | Difference from non-Indigenous Population | Income | Difference from non-Indigenous Population | Income | |
| 2005 | $26,800 | -$24,600 | $38,000 | -$13,400 | $41,200 | -$10,200 | $38,800 | -$12,600 | $44,500 | -$6,900 | $51,400 |
| 2010 | $28,800 | -$21,700 | $41,500 | -$9,000 | $42,300 | -$8,200 | $38,700 | -$11,800 | $46,900 | -$3,600 | $50,500 |
| 2015 | $25,200 | -$21,000 | $38,300 | -$7,900 | $39,500 | -$6,700 | $35,600 | -$10,600 | $44,800 | -$1,400 | $46,200 |
| 2020 | $29,400 | -$18,200 | $40,000 | -$7,600 | $40,400 | -$7,200 | $39,600 | -$8,000 | $45,600 | -$2,000 | $47,600 |
Source: Indigenous Services Canada. Custom Tabulations, 2006 to 2021 Census of Population. Note: The dollar values have been adjusted for inflation and are stated in terms of their value in 2020. |
|||||||||||
| Registered Indian on reserve | Registered Indian off reserve | Non-Status Indian | Non-Indigenous | ||||
|---|---|---|---|---|---|---|---|
| Income | Difference from non-Indigenous Population | Income | Difference from non-Indigenous Population | Income | Difference from non-Indigenous Population | Income | |
| Newfoundland and Labrador | $25,600 | -$16,000 | $38,000 | -$3,600 | $38,800 | -$2,800 | $41,600 |
| Prince Edward Island | $26,800 | -$13,600 | $31,000 | -$9,400 | $28,800 | -$11,600 | $40,400 |
| Nova Scotia | $27,600 | -$15,200 | $40,800 | -$2,000 | $34,800 | -$8,000 | $42,800 |
| New Brunswick | $25,600 | -$16,000 | $33,600 | -$8,000 | $32,000 | -$9,600 | $41,600 |
| Quebec | $36,400 | -$8,800 | $41,600 | -$3,600 | $40,000 | -$5,200 | $45,200 |
| Ontario | $32,400 | -$16,800 | $43,200 | -$6,000 | $41,200 | -$8,000 | $49,200 |
| Manitoba | $24,800 | -$20,800 | $33,200 | -$12,400 | $38,800 | -$6,800 | $45,600 |
| Saskatchewan | $24,600 | -$24,600 | $34,400 | -$14,800 | $36,400 | -$12,800 | $49,200 |
| Alberta | $30,600 | -$21,800 | $40,400 | -$12,000 | $45,600 | -$6,800 | $52,400 |
| British Columbia | $30,000 | -$18,000 | $40,400 | -$7,600 | $41,200 | -$6,800 | $48,000 |
| Yukon | $48,000 | -$18,500 | $62,400 | -$4,100 | $66,500 | ||
| Northwest Territories | $19,400 | -$68,600 | $47,600 | -$40,400 | $71,000 | -$17,000 | $88,000 |
| Nunavut | $103,000 | -$11,000 | $103,000 | -$11,000 | $114,000 | ||
Source: Indigenous Services Canada. Custom Tabulations, 2021 Census of Population. |
|||||||
| Métis | Non-Indigenous | ||
|---|---|---|---|
| Income | Difference from non-Indigenous Population | Income | |
| Newfoundland and Labrador | $41,600 | $0 | $41,600 |
| Prince Edward Island | $40,000 | -$400 | $40,400 |
| Nova Scotia | $40,000 | -$2,800 | $42,800 |
| New Brunswick | $33,600 | -$8,000 | $41,600 |
| Quebec | $42,400 | -$2,800 | $45,200 |
| Ontario | $48,000 | -$1,200 | $49,200 |
| Manitoba | $44,400 | -$1,200 | $45,600 |
| Saskatchewan | $46,800 | -$2,400 | $49,200 |
| Alberta | $48,800 | -$3,600 | $52,400 |
| British Columbia | $44,800 | -$3,200 | $48,000 |
| Yukon | $60,000 | -$6,500 | $66,500 |
| Northwest Territories | $79,000 | -$9,000 | $88,000 |
| Nunavut | $124,000 | $10,000 | $114,000 |
Source: Indigenous Services Canada. Custom Tabulations, 2021 Census of Population. |
|||
| Inuit | Non-Indigenous | ||
|---|---|---|---|
| Income | Difference from non-Indigenous Population | Income | |
| Nunatsiavut (Labrador) | $36,800 | -$38,700 | $75,500 |
| Nunavik (Northern Quebec) | $34,000 | -$49,000 | $83,000 |
| Inuvialuit Region (Northwest Territories and Yukon) | $42,000 | -$56,000 | $98,000 |
| Nunavut | $37,200 | -$76,800 | $114,000 |
| Outside of Inuit Nunangat | $44,000 | -$3,600 | $47,600 |
Source: Indigenous Services Canada. Custom Tabulations, 2021 Census of Population. |
|||
| Men+ | Women+ | |||
|---|---|---|---|---|
| Income | Difference from non-Indigenous Population | Income | Difference from non-Indigenous Population | |
| Registered Indian on reserve | $22,200 | -$28,500 | $24,200 | -$11,900 |
| Registered Indian off reserve | $42,800 | -$7,900 | $30,000 | -$6,000 |
| Non-Status Indian | $44,500 | -$6,200 | $30,200 | -$5,900 |
| Inuit | $34,300 | -$16,400 | $31,100 | -$5,000 |
| Métis | $51,300 | $500 | $34,000 | -$2,100 |
| Non-Indigenous | $50,700 | $36,100 | ||
| Men+ | Women+ | |||
|---|---|---|---|---|
| Income | Difference from non-Indigenous Population | Income | Difference from non-Indigenous Population | |
| Registered Indian on reserve | $27,200 | -$28,400 | $31,400 | -$9,400 |
| Registered Indian off reserve | $45,600 | -$10,000 | $35,600 | -$5,200 |
| Non-Status Indian | $47,600 | -$8,000 | $34,800 | -$6,000 |
| Inuit | $41,200 | -$14,400 | $38,000 | -$2,800 |
| Métis | $54,800 | -$800 | $38,000 | -$2,800 |
| Non-Indigenous | $55,600 | $40,800 | ||
Source: Indigenous Services Canada. Custom Tabulations, 2016 to 2021 Census of Population. Note: The 2015 dollar values have not been adjusted for inflation. Given that the non-binary population is small, Statistics Canada implemented a method producing a two-category gender variable to prevent disclosure of identifiable data for lower levels of geography. Consequently, information will be disseminated using the following categories: Men+, Women+. Individuals in the "non-binary persons" category are distributed in the other two gender categories and are denoted by the "+" symbol. |
||||
Education – High school completion
| Percentage | Difference from non-Indigenous Population | |
|---|---|---|
| Registered Indian on reserve | 59.9% | -30.8% |
| Registered Indian off reserve | 78.2% | -12.5% |
| Non-Status Indian | 82.7% | -8.0% |
| Inuit | 56.0% | -34.7% |
| Métis | 85.5% | -5.2% |
| Non-Indigenous | 90.7% | |
Source: Indigenous Services Canada. Custom Tabulations, 2021 Census of Population. |
||
| Aged 18 to 24 | Aged 24 to 34 | Aged 35+ | Aged 25 to 64 | |
|---|---|---|---|---|
| Registered Indian on reserve | 53.3% | 58.6% | 58.2% | 59.9% |
| Registered Indian off reserve | 74.1% | 79.4% | 74.5% | 78.2% |
| Non-Status Indian | 78.0% | 83.8% | 79.2% | 82.7% |
| Inuit | 50.6% | 55.8% | 53.8% | 56.0% |
| Métis | 83.9% | 88.4% | 80.7% | 85.5% |
| Non-Indigenous | 90.2% | 93.6% | 85.5% | 90.7% |
Source: Indigenous Services Canada. Custom Tabulations, 2021 Census of Population. |
||||
| Registered Indian on reserve | Registered Indian off reserve | Non-Status Indian | Inuit | Métis | Non-Indigenous | ||||||
|---|---|---|---|---|---|---|---|---|---|---|---|
| Percentage | Difference from non-Indigenous Population | Percentage | Difference from non-Indigenous Population | Percentage | Difference from non-Indigenous Population | Percentage | Difference from non-Indigenous Population | Percentage | Difference from non-Indigenous Population | Percentage | |
| 2001 | 51.3% | -26.4% | 63.6% | -14.1% | 65.9% | -11.8% | 51.8% | -25.9% | 66.7% | -11.0% | 77.7% |
| 2006 | 50.0% | -35.2% | 68.0% | -17.2% | 71.5% | -13.7% | 48.6% | -36.6% | 74.4% | -10.8% | 85.2% |
| 2011 | 53.5% | -34.4% | 72.9% | -15.0% | 77.7% | -10.2% | 51.5% | -36.4% | 79.6% | -8.3% | 87.9% |
| 2016 | 57.0% | -32.2% | 75.0% | -14.2% | 80.3% | -8.9% | 55.9% | -33.3% | 82.3% | -6.9% | 89.2% |
| 2021 | 59.9% | -30.8% | 78.2% | -12.5% | 82.7% | -8.0% | 56.0% | -34.7% | 85.5% | -5.2% | 90.7% |
Source: Indigenous Services Canada. Custom Tabulations, 2001 to 2021 Census of Population. |
|||||||||||
| Registered Indian on reserve | Registered Indian off reserve | Non-Status Indian | Non-Indigenous | ||||
|---|---|---|---|---|---|---|---|
| Percentage | Difference from non-Indigenous Population | Percentage | Difference from non-Indigenous Population | Percentage | Difference from non-Indigenous Population | Percentage | |
| Newfoundland and Labrador | 60.1% | -27.5% | 87.3% | -0.3% | 87.2% | -0.4% | 87.6% |
| Prince Edward Island | 68.0% | -23.0% | 89.0% | -2.0% | 86.2% | -4.8% | 91.0% |
| Nova Scotia | 75.4% | -11.3% | 88.3% | 1.6% | 87.7% | 1.0% | 86.7% |
| New Brunswick | 72.6% | -13.5% | 84.3% | -1.8% | 83.4% | -2.7% | 86.1% |
| Quebec | 58.5% | -30.0% | 79.5% | -9.0% | 81.9% | -6.6% | 88.5% |
| Ontario | 62.4% | -29.0% | 82.2% | -9.2% | 83.4% | -8.0% | 91.4% |
| Manitoba | 51.3% | -39.3% | 71.4% | -19.2% | 74.9% | -15.7% | 90.6% |
| Saskatchewan | 58.5% | -33.3% | 75.5% | -16.3% | 75.9% | -15.9% | 91.8% |
| Alberta | 53.5% | -37.4% | 75.8% | -15.1% | 81.7% | -9.2% | 90.9% |
| British Columbia | 68.5% | -24.1% | 78.8% | -13.8% | 82.8% | -9.8% | 92.6% |
| Yukon | 73.4% | -20.4% | 81.3% | -12.5% | 93.8% | ||
| Northwest Territories | 31.8% | -62.4% | 59.0% | -35.2% | 77.6% | -16.6% | 94.2% |
| Nunavut | 81.3% | -13.6% | 84.6% | -10.3% | 94.9% | ||
Source: Indigenous Services Canada. Custom Tabulations, 2021 Census of Population. |
|||||||
| Métis | Non-Indigenous | ||
|---|---|---|---|
| Percentage | Difference from non-Indigenous Population | Percentage | |
| Newfoundland and Labrador | 85.9% | -1.7% | 87.6% |
| Prince Edward Island | 90.6% | -0.4% | 91.0% |
| Nova Scotia | 86.7% | 0.0% | 86.7% |
| New Brunswick | 86.1% | 0.0% | 86.1% |
| Quebec | 83.3% | -5.2% | 88.5% |
| Ontario | 88.5% | -2.9% | 91.4% |
| Manitoba | 84.1% | -6.5% | 90.6% |
| Saskatchewan | 84.8% | -7.0% | 91.8% |
| Alberta | 83.6% | -7.3% | 90.9% |
| British Columbia | 86.6% | -6.0% | 92.6% |
| Yukon | 87.9% | -5.9% | 93.8% |
| Northwest Territories | 79.8% | -14.4% | 94.2% |
| Nunavut | 88.9% | -6.0% | 94.9% |
Source: Indigenous Services Canada. Custom Tabulations, 2021 Census of Population. |
|||
| Inuit | Non-Indigenous | ||
|---|---|---|---|
| Percentage | Difference from non-Indigenous Population | Percentage | |
| Nunatsiavut (Labrador) | 67.6% | -16.6% | 84.2% |
| Nunavik (Northern Quebec) | 37.1% | -46.4% | 83.5% |
| Inuvialuit Region (Northwest Territories and Yukon) | 50.2% | -43.7% | 93.9% |
| Nunavut | 42.7% | -52.2% | 94.9% |
| Outside of Inuit Nunangat | 82.1% | -8.6% | 90.7% |
Source: Indigenous Services Canada. Custom Tabulations, 2021 Census of Population. |
|||
| Men+ | Women+ | |||
|---|---|---|---|---|
| Percentage | Difference from non-Indigenous Population | Percentage | Difference from non-Indigenous Population | |
| Registered Indian on reserve | 52.9% | -34.8% | 61.0% | -29.6% |
| Registered Indian off reserve | 72.4% | -15.3% | 77.2% | -13.4% |
| Non-Status Indian | 76.9% | -10.8% | 83.3% | -7.3% |
| Inuit | 54.8% | -32.9% | 56.8% | -33.8% |
| Métis | 79.1% | -8.6% | 85.3% | -5.3% |
| Non-Indigenous | 87.7% | 90.6% | ||
| Men+ | Women+ | |||
|---|---|---|---|---|
| Percentage | Difference from non-Indigenous Population | Percentage | Difference from non-Indigenous Population | |
| Registered Indian on reserve | 55.5% | -33.8% | 64.3% | -27.8% |
| Registered Indian off reserve | 75.1% | -14.2% | 80.7% | -11.4% |
| Non-Status Indian | 79.3% | -10.0% | 85.7% | -6.4% |
| Inuit | 52.7% | -36.6% | 59.0% | -33.1% |
| Métis | 82.4% | -6.9% | 88.3% | -3.8% |
| Non-Indigenous | 89.3% | 92.1% | ||
Source: Indigenous Services Canada. Custom Tabulations, 2016 to 2021 Census of Population. Note: The 2015 dollar values have not been adjusted for inflation. Given that the non-binary population is small, Statistics Canada implemented a method producing a two-category gender variable to prevent disclosure of identifiable data for lower levels of geography. Consequently, information will be disseminated using the following categories: Men+, Women+. Individuals in the "non-binary persons" category are distributed in the other two gender categories and are denoted by the "+" symbol. |
||||
Education – University degree
| Percentage | Difference from non-Indigenous Population | |
|---|---|---|
| Registered Indian on reserve | 9.1% | -27.9% |
| Registered Indian off reserve | 15.7% | -21.3% |
| Non-Status Indian | 16.4% | -20.6% |
| Inuit | 7.6% | -29.4% |
| Métis | 18.8% | -18.2% |
| Non-Indigenous | 37.0% | |
Source: Indigenous Services Canada. Custom Tabulations, 2021 Census of Population. |
||
| Aged 25 to 34 | Aged 25 to 64 | |
|---|---|---|
| Registered Indian on reserve | 39.2 | 27.9 |
| Registered Indian off reserve | 29.3 | 21.3 |
| Non-Status Indian | 26.4 | 20.7 |
| Inuit | 38.0 | 29.4 |
| Métis | 21.7 | 18.3 |
Source: Indigenous Services Canada. Custom Tabulations, 2021 Census of Population. |
||
| Registered Indian on reserve | Registered Indian off reserve | Non-Status Indian | Inuit | Métis | Non-Indigenous | ||||||
|---|---|---|---|---|---|---|---|---|---|---|---|
| Percentage | Difference from non-Indigenous Population | Percentage | Difference from non-Indigenous Population | Percentage | Difference from non-Indigenous Population | Percentage | Difference from non-Indigenous Population | Percentage | Difference from non-Indigenous Population | Percentage | |
| 2001 | 3.4% | -16.7% | 6.8% | -13.3% | 7.0% | -13.1% | 2.5% | -17.6% | 7.2% | -12.9% | 20.1% |
| 2006 | 4.4% | -19.0% | 9.0% | -14.4% | 7.9% | -15.5% | 3.7% | -19.7% | 9.2% | -14.2% | 23.4% |
| 2011 | 4.7% | -21.8% | 11.0% | -15.5% | 10.7% | -15.8% | 5.1% | -21.4% | 12.1% | -14.4% | 26.5% |
| 2016 | 5.4% | -23.9% | 11.3% | -18.0% | 11.9% | -17.4% | 5.3% | -24.0% | 13.6% | -15.7% | 29.3% |
| 2021 | 9.1% | -27.9% | 15.7% | -21.3% | 16.4% | -20.6% | 7.6% | -29.4% | 18.8% | -18.2% | 37.0% |
Source: Indigenous Services Canada. Custom Tabulations, 2001 to 2021 Census of Population. |
|||||||||||
| Registered Indian on reserve | Registered Indian off reserve | Non-Status Indian | Non-Indigenous | ||||
|---|---|---|---|---|---|---|---|
| Percentage | Difference from non-Indigenous Population | Percentage | Difference from non-Indigenous Population | Percentage | Difference from non-Indigenous Population | Percentage | |
| Newfoundland and Labrador | 8.1% | -15.3% | 19.5% | -3.9% | 22.3% | -1.1% | 23.4% |
| Prince Edward Island | 10.0% | -20.0% | 16.9% | -13.1% | 13.8% | -16.2% | 30.0% |
| Nova Scotia | 19.1% | -13.6% | 21.9% | -10.8% | 20.1% | -12.6% | 32.7% |
| New Brunswick | 11.4% | -14.4% | 21.0% | -4.8% | 13.1% | -12.7% | 25.8% |
| Quebec | 9.8% | -24.0% | 18.9% | -14.9% | 15.9% | -17.9% | 33.8% |
| Ontario | 8.3% | -31.6% | 16.4% | -23.5% | 15.8% | -24.1% | 39.9% |
| Manitoba | 7.5% | -27.9% | 12.7% | -22.7% | 11.9% | -23.5% | 35.4% |
| Saskatchewan | 8.5% | -23.2% | 15.8% | -15.9% | 14.1% | -17.6% | 31.7% |
| Alberta | 7.5% | -28.4% | 13.9% | -22.0% | 16.4% | -19.5% | 35.9% |
| British Columbia | 10.7% | -29.8% | 16.3% | -24.2% | 17.1% | -23.4% | 40.5% |
| Yukon | 11.8% | -30.6% | 23.1% | -19.3% | 42.4% | ||
| Northwest Territories | 8.4% | -36.6% | 17.2% | -27.8% | 45.0% | ||
| Nunavut | 18.8% | -36.7% | 30.8% | -24.7% | 55.5% | ||
Source: Indigenous Services Canada. Custom Tabulations, 2021 Census of Population. |
|||||||
| Métis | Non-Indigenous | ||
|---|---|---|---|
| Percentage | Difference from non-Indigenous Population | Percentage | |
| Newfoundland and Labrador | 15.1% | -8.3% | 23.4% |
| Prince Edward Island | 29.4% | -0.6% | 30.0% |
| Nova Scotia | 22.3% | -10.4% | 32.7% |
| New Brunswick | 15.7% | -9.3% | 25.0% |
| Quebec | 19.1% | -14.7% | 33.8% |
| Ontario | 20.4% | -19.5% | 39.9% |
| Manitoba | 17.8% | -17.6% | 35.4% |
| Saskatchewan | 17.6% | -14.1% | 31.7% |
| Alberta | 16.7% | -19.2% | 35.9% |
| British Columbia | 20.3% | -20.2% | 40.5% |
| Yukon | 26.5% | -15.9% | 42.4% |
| Northwest Territories | 21.3% | -23.7% | 45.0% |
| Nunavut | 33.3% | -22.2% | 55.5% |
Source: Indigenous Services Canada. Custom Tabulations, 2021 Census of Population. |
|||
| Inuit | Non-Indigenous | ||
|---|---|---|---|
| Percentage | Difference from non-Indigenous Population | Percentage | |
| Nunatsiavut (Labrador) | 7.5% | -45.1% | 52.6% |
| Nunavik (Northern Quebec) | 2.2% | -39.9% | 42.1% |
| Inuvialuit Region (Northwest Territories and Yukon) | 4.9% | -47.9% | 52.8% |
| Nunavut | 4.0% | -51.5% | 55.5% |
| Outside of Inuit Nunangat | 15.4% | -21.6% | 37.0% |
Source: Indigenous Services Canada. Custom Tabulations, 2021 Census of Population. |
|||
| Men+ | Women+ | |||
|---|---|---|---|---|
| Percentage | Difference from non-Indigenous Population | Percentage | Difference from non-Indigenous Population | |
| Registered Indian on reserve | 2.9% | -24.0% | 7.8% | -23.9% |
| Registered Indian off reserve | 8.0% | -18.9% | 14.1% | -17.6% |
| Non-Status Indian | 9.0% | -17.9% | 14.4% | -17.3% |
| Inuit | 3.4% | -23.5% | 7.0% | -24.7% |
| Métis | 10.7% | -16.2% | 16.3% | -15.4% |
| Non-Indigenous | 26.9% | 31.7% | ||
| Men+ | Women+ | |||
|---|---|---|---|---|
| Percentage | Difference from non-Indigenous Population | Percentage | Difference from non-Indigenous Population | |
| Registered Indian on reserve | 5.1% | -28.1% | 13.0% | -27.8% |
| Registered Indian off reserve | 11.0% | -22.2% | 20.5% | -20.3% |
| Non-Status Indian | 11.5% | -21.7% | 21.0% | -19.8% |
| Inuit | 4.6% | -28.6% | 11.1% | -29.7% |
| Métis | 13.8% | -19.4% | 23.3% | -17.5% |
| Non-Indigenous | 33.2% | 40.8% | ||
Source: Indigenous Services Canada. Custom Tabulations, 2016 to 2021 Census of Population. Note: The 2015 dollar values have not been adjusted for inflation. Given that the non-binary population is small, Statistics Canada implemented a method producing a two-category gender variable to prevent disclosure of identifiable data for lower levels of geography. Consequently, information will be disseminated using the following categories: Men+, Women+. Individuals in the "non-binary persons" category are distributed in the other two gender categories and are denoted by the "+" symbol. |
||||
Housing – Crowding
| Percentage | Difference from non-Indigenous Population | |
|---|---|---|
| Registered Indian on reserve | 11.3% | 9.0% |
| Registered Indian off reserve | 2.8% | 0.5% |
| Non-Status Indian | 0.9% | -1.4% |
| Inuit | 13.9% | 11.6% |
| Métis | 1.0% | -1.3% |
| Non-Indigenous | 2.3% | |
Source: Indigenous Services Canada. Custom Tabulations, 2021 Census of Population. |
||
| Registered Indian on reserve | Registered Indian off reserve | Non-Status Indian | Inuit | Métis | Non-Indigenous | ||||||
|---|---|---|---|---|---|---|---|---|---|---|---|
| Percentage | Difference from non-Indigenous Population | Percentage | Difference from non-Indigenous Population | Percentage | Difference from non-Indigenous Population | Percentage | Difference from non-Indigenous Population | Percentage | Difference from non-Indigenous Population | Percentage | |
| 2001 | 13.8% | 12.5% | 3.8% | 2.5% | 1.3% | 0.0% | 15.3% | 14.0% | 1.5% | 0.2% | 1.3% |
| 2006 | 12.6% | 11.2% | 3.4% | 2.0% | 1.3% | -0.1% | 16.3% | 14.9% | 1.2% | -0.2% | 1.4% |
| 2011 | 13.1% | 11.2% | 3.4% | 1.5% | 1.4% | -0.5% | 15.6% | 13.7% | 1.3% | -0.6% | 1.9% |
| 2016 | 12.7% | 10.9% | 2.7% | 0.9% | 1.1% | -0.7% | 16.0% | 14.2% | 0.8% | -1.0% | 1.8% |
| 2021 | 11.3% | 9.0% | 2.8% | 0.5% | 0.9% | -1.4% | 13.9% | 11.6% | 1.0% | -1.3% | 2.3% |
Source: Indigenous Services Canada. Custom Tabulations, 2001 to 2021 Census of Population. |
|||||||||||
| Registered Indian on reserve | Registered Indian off reserve | Non-Status Indian | Non-Indigenous | ||||
|---|---|---|---|---|---|---|---|
| Percentage | Difference from non-Indigenous Population | Percentage | Difference from non-Indigenous Population | Percentage | Difference from non-Indigenous Population | Percentage | |
| Newfoundland and Labrador | 8.5% | 8.1% | 0.3% | -0.1% | 0.4% | ||
| Prince Edward Island | 1.1% | ||||||
| Nova Scotia | 6.0% | 5.0% | 0.8% | -0.2% | 0.6% | -0.4% | 1.0% |
| New Brunswick | 1.8% | 1.1% | 0.2% | -0.5% | 0.5% | -0.2% | 0.7% |
| Quebec | 9.9% | 8.6% | 1.2% | -0.1% | 0.4% | -0.9% | 1.3% |
| Ontario | 8.9% | 5.9% | 1.6% | -1.4% | 1.1% | -1.9% | 3.0% |
| Manitoba | 20.8% | 17.7% | 5.8% | 2.7% | 2.6% | -0.5% | 3.1% |
| Saskatchewan | 14.7% | 12.6% | 5.1% | 3.0% | 2.0% | -0.1% | 2.1% |
| Alberta | 13.9% | 11.2% | 3.1% | 0.4% | 0.8% | -1.9% | 2.7% |
| British Columbia | 5.1% | 2.3% | 2.7% | -0.1% | 1.3% | -1.5% | 2.8% |
| Yukon | 3.1% | 0.9% | 2.2% | ||||
| Northwest Territories | 11.1% | 7.3% | 8.0% | 4.2% | 3.8% | ||
| Nunavut | 0.0% | -3.7% | 0.0% | -3.7% | 3.7% | ||
Source: Indigenous Services Canada. Custom Tabulations, 2021 Census of Population. |
|||||||
| Métis | Non-Indigenous | ||
|---|---|---|---|
| Percentage | Difference from non-Indigenous Population | Percentage | |
| Newfoundland and Labrador | 0.5% | 0.1% | 0.4% |
| Prince Edward Island | 1.1% | ||
| Nova Scotia | 0.4% | -0.6% | 1.0% |
| New Brunswick | 0.5% | -0.2% | 0.7% |
| Quebec | 0.4% | -0.9% | 1.3% |
| Ontario | 0.9% | -2.1% | 3.0% |
| Manitoba | 0.9% | -2.2% | 3.1% |
| Saskatchewan | 1.2% | -0.9% | 2.1% |
| Alberta | 1.2% | -1.5% | 2.7% |
| British Columbia | 1.3% | -1.5% | 2.8% |
| Yukon | 1.5% | -0.7% | 2.2% |
| Northwest Territories | 1.4% | -2.4% | 3.8% |
| Nunavut | 3.7% | ||
Source: Indigenous Services Canada. Custom Tabulations, 2021 Census of Population. |
|||
| Inuit | Non-Indigenous | ||
|---|---|---|---|
| Percentage | Difference from non-Indigenous Population | Percentage | |
| Nunatsiavut (Labrador) | 4.3% | ||
| Nunavik (Northern Quebec) | 20.3% | 16.4% | 3.9% |
| Inuvialuit Region (Northwest Territories and Yukon) | 9.7% | 6.9% | 2.8% |
| Nunavut | 28.2% | 24.5% | 3.7% |
| Outside of Inuit Nunangat | 1.6% | -0.7% | 2.3% |
Source: Indigenous Services Canada. Custom Tabulations, 2021 Census of Population. |
|||
Housing – In need of major repair
| Percentage | Difference from non-Indigenous Population | |
|---|---|---|
| Registered Indian on Reserve | 34.0% | 28.3% |
| Registered Indian off Reserve | 10.9% | 5.2% |
| Non-Status Indian | 10.7% | 5.0% |
| Inuit | 21.2% | 15.5% |
| Métis | 9.4% | 3.7% |
| Non-Indigenous | 5.7% | |
Source: Indigenous Services Canada. Custom Tabulations, 2021 Census of Population. |
||
| Registered Indian on reserve | Registered Indian off reserve | Non-Status Indian | Inuit | Métis | Non-Indigenous | ||||||
|---|---|---|---|---|---|---|---|---|---|---|---|
| Percentage | Difference from non-Indigenous Population | Percentage | Difference from non-Indigenous Population | Percentage | Difference from non-Indigenous Population | Percentage | Difference from non-Indigenous Population | Percentage | Difference from non-Indigenous Population | Percentage | |
| 2001 | 36.9% | 29.1% | 16.2% | 8.4% | 17.3% | 9.5% | 20.1% | 12.3% | 14.9% | 7.1% | 7.8% |
| 2006 | 42.2% | 35.2% | 15.4% | 8.4% | 14.5% | 7.5% | 22.4% | 15.4% | 12.5% | 5.5% | 7.0% |
| 2011 | 39.7% | 32.8% | 14.4% | 7.5% | 13.2% | 6.3% | 25.1% | 18.2% | 12.1% | 5.2% | 6.9% |
| 2016 | 40.0% | 34.0% | 12.2% | 6.2% | 12.3% | 6.3% | 21.8% | 15.8% | 10.3% | 4.3% | 6.0% |
| 2021 | 34.0% | 28.3% | 10.9% | 5.2% | 10.7% | 5.0% | 21.2% | 15.5% | 9.4% | 3.7% | 5.7% |
Source: Indigenous Services Canada. Custom Tabulations, 2001 to 2021 Census of Population. |
|||||||||||
| Registered Indian on reserve | Registered Indian off reserve | Non-Status Indian | Non-Indigenous | ||||
|---|---|---|---|---|---|---|---|
| Percentage | Difference from non-Indigenous Population | Percentage | Difference from non-Indigenous Population | Percentage | Difference from non-Indigenous Population | Percentage | |
| Newfoundland and Labrador | 19.5% | 14.4% | 7.2% | 2.1% | 7.6% | 2.5% | 5.1% |
| Prince Edward Island | 32.5% | 25.6% | 12.8% | 5.9% | 11.1% | 4.2% | 6.9% |
| Nova Scotia | 22.8% | 14.9% | 10.6% | 2.7% | 14.8% | 6.9% | 7.9% |
| New Brunswick | 31.4% | 24.1% | 12.5% | 5.2% | 13.0% | 5.7% | 7.3% |
| Quebec | 23.0% | 16.9% | 9.2% | 3.1% | 9.4% | 3.3% | 6.1% |
| Ontario | 30.5% | 25.0% | 10.6% | 5.1% | 11.7% | 6.2% | 5.5% |
| Manitoba | 43.8% | 38.0% | 12.6% | 6.8% | 14.6% | 8.8% | 5.8% |
| Saskatchewan | 40.6% | 34.4% | 11.4% | 5.2% | 11.6% | 5.4% | 6.2% |
| Alberta | 42.2% | 37.2% | 8.8% | 3.8% | 8.2% | 3.2% | 5.0% |
| British Columbia | 28.6% | 23.2% | 11.1% | 5.7% | 10.4% | 5.0% | 5.4% |
| Yukon | 21.5% | 11.8% | 15.9% | 6.2% | 9.7% | ||
| Northwest Territories | 38.9% | 28.5% | 27.4% | 17.0% | 23.3% | 12.9% | 10.4% |
| Nunavut | 13.3% | 3.2% | 20.0% | 9.9% | 10.1% | ||
Source: Indigenous Services Canada. Custom Tabulations, 2021 Census of Population. |
|||||||
| Métis | Non-Indigenous | ||
|---|---|---|---|
| Percentage | Difference from non-Indigenous Population | Percentage | |
| Newfoundland and Labrador | 8.6% | 3.5% | 5.1% |
| Prince Edward Island | 10.1% | 3.2% | 6.9% |
| Nova Scotia | 10.3% | 2.4% | 7.9% |
| New Brunswick | 11.8% | 4.5% | 7.3% |
| Quebec | 10.9% | 4.8% | 6.1% |
| Ontario | 9.8% | 4.3% | 5.5% |
| Manitoba | 9.3% | 3.5% | 5.8% |
| Saskatchewan | 10.1% | 3.9% | 6.2% |
| Alberta | 8.3% | 3.3% | 5.0% |
| British Columbia | 8.4% | 3.0% | 5.4% |
| Yukon | 16.8% | 7.1% | 9.7% |
| Northwest Territories | 17.7% | 7.3% | 10.4% |
| Nunavut | 10.1% | ||
Source: Indigenous Services Canada. Custom Tabulations, 2021 Census of Population. |
|||
| Inuit | Non-Indigenous | ||
|---|---|---|---|
| Percentage | Difference from non-Indigenous Population | Percentage | |
| Nunatsiavut (Labrador) | 28.4% | ||
| Nunavik (Northern Quebec) | 23.7% | 13.0% | 10.7% |
| Inuvialuit Region (Northwest Territories and Yukon) | 30.8% | 16.9% | 13.9% |
| Nunavut | 31.7% | 21.6% | 10.1% |
| Outside Inuit Nunangat | 10.5% | 4.8% | 5.7% |
Source: Indigenous Services Canada. Custom Tabulations, 2021 Census of Population. |
|||
Children in foster care
| Percentage | Difference from non-Indigenous Population | |
|---|---|---|
| Registered Indians (total) | 4.5% | 4.3% |
| Registered Indian on reserve | 2.3% | 2.1% |
| Registered Indian off reserve | 6.3% | 6.1% |
| Non-Status Indian | 3.0% | 2.8% |
| Inuit | 3.3% | 3.1% |
| Métis | 1.2% | 1.0% |
| Non-Indigenous | 0.2% | |
Source: Indigenous Services Canada. Custom Tabulations, 2021 Census of Population. |
||
| Registered Indians (total) | Non-Status Indian | Inuit | Métis | Non-Indigenous | |||||
|---|---|---|---|---|---|---|---|---|---|
| Percentage | Difference from non-Indigenous Population | Percentage | Difference from non-Indigenous Population | Percentage | Difference from non-Indigenous Population | Percentage | Difference from non-Indigenous Population | Percentage | |
| 2011 | 5.0% | 4.7% | 2.8% | 2.5% | 2.7% | 2.4% | 1.4% | 1.1% | 0.3% |
| 2016 | 4.5% | 4.2% | 3.1% | 2.8% | 2.4% | 2.1% | 1.3% | 1.0% | 0.3% |
| 2021 | 4.5% | 4.3% | 3.0% | 2.8% | 3.3% | 3.1% | 1.2% | 1.0% | 0.2% |
Source: Indigenous Services Canada. Custom Tabulations, 2011 to 2021 Census of Population. |
|||||||||
| Registered Indian (total) | Non-Status Indian | Non-Indigenous | |||
|---|---|---|---|---|---|
| Percentage | Difference from non-Indigenous Population | Percentage | Difference from non-Indigenous Population | Percentage | |
| Newfoundland and Labrador | 2.1% | 1.6% | 0.4% | -0.1% | 0.5% |
| Prince Edward Island | 0.4% | ||||
| Nova Scotia | 2.0% | 1.6% | 0.4% | ||
| New Brunswick | 2.2% | 1.8% | 2.4% | 2.0% | 0.4% |
| Quebec | 3.7% | 3.3% | 1.0% | 0.6% | 0.4% |
| Ontario | 3.1% | 2.9% | 1.5% | 1.3% | 0.2% |
| Manitoba | 7.5% | 7.1% | 11.2% | 10.8% | 0.4% |
| Saskatchewan | 3.0% | 2.8% | 5.7% | 5.5% | 0.2% |
| Alberta | 5.5% | 5.3% | 3.7% | 3.5% | 0.2% |
| British Columbia | 4.7% | 4.4% | 3.1% | 2.8% | 0.3% |
| Yukon | 3.9% | ||||
| Northwest Territories | 2.0% | 1.8% | 4.3% | 4.1% | 0.2% |
| Nunavut | |||||
Source: Indigenous Services Canada. Custom Tabulations, 2021 Census of Population. |
|||||
| Métis | Non-Indigenous | ||
|---|---|---|---|
| Percentage | Difference from non-Indigenous Population | Percentage | |
| Newfoundland and Labrador | 0.5% | ||
| Prince Edward Island | 0.1% | ||
| Nova Scotia | 0.3% | ||
| New Brunswick | 1.1% | 0.6% | 0.5% |
| Quebec | 0.7% | 0.2% | 0.5% |
| Ontario | 0.5% | 0.4% | 0.1% |
| Manitoba | 2.6% | 2.3% | 0.3% |
| Saskatchewan | 1.2% | 1.1% | 0.1% |
| Alberta | 0.9% | 0.8% | 0.1% |
| British Columbia | 1.6% | 1.4% | 0.2% |
| Yukon | |||
| Northwest Territories | 1.5% | ||
| Nunavut | |||
Source: Indigenous Services Canada. Custom Tabulations, 2021 Census of Population. |
|||
Indigenous languages
| Percentage | |
|---|---|
| Registered Indian on Reserve | 40.4% |
| Registered Indian off Reserve | 11.0% |
| Non-Status Indian | 1.8% |
| Inuit | 58.5% |
| Métis | 1.2% |
Source: Indigenous Services Canada. Custom Tabulations, 2021 Census of Population. |
|
| Registered Indian on reserve | Registered Indian off reserve | Non-Status Indian | Inuit | Métis | |
|---|---|---|---|---|---|
| 2001 | 49.5% | 17.8% | 5.3% | 72.0% | 5.0% |
| 2006 | 50.8% | 16.3% | 3.2% | 70.9% | 3.3% |
| 2011 | 44.6% | 12.3% | 2.2% | 64.0% | 2.4% |
| 2016 | 44.8% | 11.7% | 1.9% | 64.8% | 1.6% |
| 2021 | 40.4% | 11.0% | 1.8% | 58.5% | 1.2% |
Source: Indigenous Services Canada. Custom Tabulations, 2001 to 2021 Census of Population. |
|||||
| Registered Indian on reserve | Registered Indian off reserve | Non-Status Indian | |
|---|---|---|---|
| Newfoundland and Labrador | 62.0% | 2.0% | 0.4% |
| Prince Edward Island | 15.2% | 1.9% | 2.2% |
| Nova Scotia | 49.9% | 2.1% | 1.1% |
| New Brunswick | 34.7% | 2.9% | 0.9% |
| Quebec | 78.5% | 11.5% | 1.2% |
| Ontario | 33.8% | 3.2% | 1.2% |
| Manitoba | 38.9% | 5.7% | 6.3% |
| Saskatchewan | 37.6% | 10.5% | 6.4% |
| Alberta | 40.9% | 5.9% | 2.8% |
| British Columbia | 17.6% | 2.7% | 1.3% |
| Yukon | 8.1% | 1.4% | |
| Northwest Territories | 30.8% | 26.5% | 10.7% |
| Nunavut | 80.4% | 31.8% | |
Source: Indigenous Services Canada. Custom Tabulations, 2021 Census of Population. |
|||
| Métis | |
|---|---|
| Newfoundland and Labrador | 0.2% |
| Prince Edward Island | 0.0% |
| Nova Scotia | 0.2% |
| New Brunswick | 0.1% |
| Quebec | 0.3% |
| Ontario | 0.4% |
| Manitoba | 0.7% |
| Saskatchewan | 4.5% |
| Alberta | 1.9% |
| British Columbia | 0.7% |
| Yukon | 1.3% |
| Northwest Territories | 7.0% |
| Nunavut | 9.1% |
Source: Indigenous Services Canada. Custom Tabulations, 2021 Census of Population. |
|
| Inuit | |
|---|---|
| Nunatsiavut (Labrador) | 18.2% |
| Nunavik (Northern Quebec) | 98.8% |
| Inuvialuit Region (Northwest Territories and Yukon) | 15.8% |
| Nunavut | 81.2% |
| Outside Nunangat | 11.7% |
Source: Indigenous Services Canada. Custom Tabulations, 2021 Census of Population. |
|
| Men+ | Women+ | |
|---|---|---|
| Registered Indian on reserve | 39.9% | 40.9% |
| Registered Indian off reserve | 10.1% | 11.8% |
| Non-Status Indian | 1.8% | 1.8% |
| Inuit | 58.0% | 59.0% |
| Métis | 1.1% | 1.3% |
Source: Indigenous Services Canada. Custom Tabulations, 2021 Census of Population. Note: Given that the non-binary population is small, Statistics Canada produced a two-category gender variable that was applied to prevent disclosure of identifiable data for lower levels of geography when necessary. Consequently, information will be disseminated using the following categories: Men+, Women+. Individuals in the "non-binary persons" category are distributed in the other two gender categories and are denoted by the "+" symbol. |
||
| Aged 0 to 19 | Aged 20+ | |
|---|---|---|
| Registered Indian on reserve | 29.7% | 47.2% |
| Registered Indian off reserve | 7.9% | 12.4% |
| Non-Status Indian | 2.2% | 1.6% |
| Inuit | 58.2% | 58.7% |
| Métis | 0.6% | 1.5% |
Source: Indigenous Services Canada. Custom Tabulations, 2021 Census of Population. |
||
Incarceration
| Percentage | Difference from non-Indigenous Population | |
|---|---|---|
| Indigenous | 2.6% | 2.3% |
| Non-Indigenous | 0.3% | |
Source: Indigenous Services Canada. Custom Tabulations, 2021 Census and 2021 to 2022 Adult Correctional Services Survey. |
||
| Indigenous | Non-Indigenous | |
|---|---|---|
| 2016 to 2017 | 29.9% | 70.1% |
| 2017 to 2018 | 30.3% | 69.7% |
| 2018 to 2019 | 30.6% | 69.4% |
| 2019 to 2020 | 29.9% | 70.1% |
| 2020 to 2021 | 31.4% | 68.6% |
| 2021 to 2022 | 31.2% | 68.8% |
Source: Indigenous Services Canada. Custom Tabulations, 2016 to 2017 to 2021 to 2022 Adult Correctional Services Survey. |
||
Urban
| Registered Indian on reserve | Registered Indian off reserve | Non-Status Indian | Inuit | Métis | Non-Indigenous | |
|---|---|---|---|---|---|---|
| Employment rate | 47.1% | 58.7% | 64.8% | 55.2% | 69.1% | 74.1% |
| Difference from Non-Indigenous | -27.0% | -15.4% | -9.3% | -18.9% | -5.0% | |
Source: Indigenous Services Canada. Custom Tabulations, 2021 Census of Population. |
||||||
| Registered Indian off reserve | Non-Status Indian | Inuit | Métis | Non-Indigenous | |
|---|---|---|---|---|---|
| Employment rate | 58.1% | 65.2% | 59.1% | 69.5% | 74.3% |
| Difference from Non-Indigenous | -16.2% | -9.1% | -15.2% | -4.8% | |
Source: Indigenous Services Canada. Custom Tabulations, 2021 Census of Population. |
|||||
Appendix B
Table B1. Overview of the change in gap observed between Indigenous and non-Indigenous populations from 2016 to 2021 for all domain indicators, Canada
| Registered Indian on reserve | Registered Indian off reserve | Non-Status Indian | Inuit | Métis | Non-Indigenous | ||
|---|---|---|---|---|---|---|---|
| 2015 | Income | $22,100 | $35,400 | $37,400 | $36,000 | $44,300 | $46,600 |
| Difference non-Indigenous Population | -$24,500 | -$11,200 | -$9,200 | -$10,600 | -$2,300 | ||
| 2020 | Income | $32,000 | $42,000 | $43,200 | $42,800 | $48,800 | $50,400 |
| Difference non-Indigenous Population | -$18,400 | -$8,400 | -$7,200 | -$7,600 | -$1,600 | ||
| Five-Year Change | Income | $9,900 | $6,600 | $5,800 | $6,800 | $4,500 | $3,800 |
| Percentage Change in Gap | -24.9% | -25.0% | -21.7% | -28.3% | -30.4% | ||
| Result | Size of Change in the Gap | Large | Large | Large | Large | Large | |
| Direction of Gap | Narrowing | Narrowing | Narrowing | Narrowing | Narrowing | ||
| Registered Indian on reserve | Registered Indian off reserve | Non-Status Indian | Inuit | Métis | Non-Indigenous | ||
|---|---|---|---|---|---|---|---|
| 2015 | Percentage | 47.7% | 30.3% | 25.2% | 22.3% | 17.3% | 13.8% |
| Difference non-Indigenous Population | 33.9% | 16.5% | 11.4% | 8.5% | 3.5% | ||
| 2020 | Percentage | 31.3% | 19.8% | 16.8% | 16.5% | 12.6% | 10.7% |
| Difference non-Indigenous Population | 20.6% | 9.1% | 6.1% | 5.8% | 1.9% | ||
| Five-Year Change | Percentage | -16.4% | -10.5% | -8.4% | -5.8% | -4.7% | -3.1% |
| Percentage Change in Gap | -39.2% | -44.8% | -46.5% | -31.8% | -45.7% | ||
| Result | Size of Change in the Gap | Large | Large | Large | Large | Large | |
| Direction of Gap | Narrowing | Narrowing | Narrowing | Narrowing | Narrowing | ||
| Registered Indian on reserve | Registered Indian off reserve | Non-Status Indian | Inuit | Métis | Non-Indigenous | ||
|---|---|---|---|---|---|---|---|
| 2016 | Percentage | 46.9% | 60.2% | 66.1% | 57.4% | 70.4% | 76.0% |
| Difference non-Indigenous Population | -29.1% | -15.8% | -9.9% | -18.6% | -5.6% | ||
| 2021 | Percentage | 47.1% | 58.7% | 64.8% | 55.2% | 69.1% | 74.1% |
| Difference non-Indigenous Population | -27.0% | -15.4% | -9.3% | -18.9% | -5.0% | ||
| Five-Year Change | Percentage | 0.2% | -1.5% | -1.3% | -2.2% | -1.3% | -1.9% |
| Percentage Change in Gap | -7.2% | -2.5% | -6.1% | 1.6% | -10.7% | ||
| Result | Size of Change in the Gap | Small | No Change | Small | No Change | Small | |
| Direction of Gap | Narrowing | No Change | Narrowing | No Change | Narrowing | ||
| Registered Indian on reserve | Registered Indian off reserve | Non-Status Indian | Inuit | Métis | Non-Indigenous | ||
|---|---|---|---|---|---|---|---|
| 2015 | Income | $25,200 | $38,300 | $39,500 | $35,400 | $44,800 | $46,200 |
| Difference non-Indigenous Population | -$21,000 | -$7,900 | -$6,700 | -$10,800 | -$1,400 | ||
| 2020 | Income | $29,400 | $40,000 | $40,400 | $39,600 | $45,600 | $47,600 |
| Difference non-Indigenous Population | -$18,200 | -$7,600 | -$7,200 | -$8,000 | -$2,000 | ||
| Five-Year Change | Income | $4,200 | $1,700 | $900 | $4,200 | $800 | $1,400 |
| Percentage Change in Gap | -13.3% | -3.8% | 7.5% | -25.9% | 42.9% | ||
| Result | Size of Change in the Gap | Medium | No Change | Small | Large | Large | |
| Direction of Gap | Narrowing | No Change | Widening | Narrowing | Widening | ||
| Registered Indian on reserve | Registered Indian off reserve | Non-Status Indian | Inuit | Métis | Non-Indigenous | ||
|---|---|---|---|---|---|---|---|
| 2016 | Percentage | 57.0% | 75.0% | 80.3% | 55.9% | 82.3% | 89.2% |
| Difference non-Indigenous Population | -32.2% | -14.2% | -8.9% | -33.3% | -6.9% | ||
| 2021 | Percentage | 59.9% | 78.2% | 82.7% | 56.0% | 85.5% | 90.7% |
| Difference non-Indigenous Population | -30.8% | -12.5% | -8.0% | -34.7% | -5.2% | ||
| Five-Year Change | Percentage | 2.9% | 3.2% | 2.4% | 0.1% | 3.2% | 1.5% |
| Percentage Change in Gap | -4.3% | -12.0% | -10.1% | 4.2% | -24.6% | ||
| Result | Size of Change in the Gap | No Change | Small | Small | No Change | Large | |
| Direction of Gap | No Change | Narrowing | Narrowing | No Change | Narrowing | ||
| Registered Indian on reserve | Registered Indian off reserve | Non-Status Indian | Inuit | Métis | Non-Indigenous | ||
|---|---|---|---|---|---|---|---|
| 2016 | Percentage | 5.4% | 11.3% | 11.9% | 5.3% | 13.6% | 29.3% |
| Difference non-Indigenous Population | -23.9% | -18.0% | -17.4% | -24.0% | -15.7% | ||
| 2021 | Percentage | 9.1% | 15.7% | 16.4% | 7.6% | 18.8% | 37.0% |
| Difference non-Indigenous Population | -27.9% | -21.3% | -20.6% | -29.4% | -18.2% | ||
| Five-Year Change | Percentage | 3.7% | 4.4% | 4.5% | 2.3% | 5.2% | 7.7% |
| Percentage Change in Gap | 16.7% | 18.3% | 18.4% | 22.5% | 15.9% | ||
| Result | Size of Change in the Gap | Medium | Medium | Medium | Large | Medium | |
| Direction of Gap | Widening | Widening | Widening | Widening | Widening | ||
| Registered Indian on reserve | Registered Indian off reserve | Non-Status Indian | Inuit | Métis | Non-Indigenous | ||
|---|---|---|---|---|---|---|---|
| 2016 | Percentage | 12.7% | 2.7% | 1.1% | 16.0% | 0.8% | 1.8% |
| Difference non-Indigenous Population | 10.9% | 0.9% | -0.7% | 14.2% | -1.0% | ||
| 2021 | Percentage | 11.3% | 2.8% | 0.9% | 13.9% | 1.0% | 2.3% |
| Difference non-Indigenous Population | 9.0% | 0.5% | -1.4% | 11.6% | -1.3% | ||
| Five-Year Change | Percentage | -1.4% | 0.1% | -0.2% | -2.1% | 0.2% | 0.5% |
| Percentage Change in Gap | -17.4% | -44.4% | 100.0% | -18.3% | 30.0% | ||
| Result | Size of Change in the Gap | Medium | Large | No Gap | Medium | No Gap | |
| Direction of Gap | Narrowing | Narrowing | No Gap | Narrowing | No Gap | ||
| Registered Indian on reserve | Registered Indian off reserve | Non-Status Indian | Inuit | Métis | Non-Indigenous | ||
|---|---|---|---|---|---|---|---|
| 2016 | Percentage | 40.0% | 12.2% | 12.3% | 21.8% | 10.3% | 6.0% |
| Difference non-Indigenous Population | 34.0% | 6.2% | 6.3% | 15.8% | 4.3% | ||
| 2021 | Percentage | 34.0% | 10.9% | 10.7% | 21.2% | 9.4% | 5.7% |
| Difference non-Indigenous Population | 28.3% | 5.2% | 5.0% | 15.5% | 3.7% | ||
| Five-Year Change | Percentage | -6.0% | -1.3% | -1.6% | -0.6% | -0.9% | -0.3% |
| Percentage Change in Gap | -16.8% | -16.1% | -20.6% | -1.9% | -14.0% | ||
| Result | Size of Change in the Gap | Medium | Medium | Large | No Change | Medium | |
| Direction of Gap | Narrowing | Narrowing | Narrowing | No Change | Narrowing | ||
| Registered Indian (total) | Non-Status Indian | Inuit | Métis | Non-Indigenous | ||
|---|---|---|---|---|---|---|
| 2016 | Percentage | 4.5% | 3.1% | 2.4% | 1.3% | 0.3% |
| Difference non-Indigenous Population | 4.2% | 2.8% | 2.1% | 1.0% | ||
| 2021 | Percentage | 4.5% | 3.0% | 3.3% | 1.2% | 0.2% |
| Difference non-Indigenous Population | 4.3% | 2.8% | 3.1% | 1.0% | ||
| Five-Year Change | Percentage | 0.0% | -0.1% | 0.9% | -0.1% | -0.1% |
| Percentage Change in Gap | 2.4% | 0.0% | 47.6% | 0.0% | ||
| Result | Size of Change in the Gap | No Change | No Change | Large | No Change | |
| Direction of Gap | No Change | No Change | Widening | No Change | ||
| Registered Indian on reserve | Registered Indian off reserve | Non-Status Indian | Inuit | Métis | Non-Indigenous | ||
|---|---|---|---|---|---|---|---|
| 2016 | Percentage | N/A | 60.0% | 67.1% | 60.0% | 71.4% | 76.4% |
| Difference non-Indigenous Population | N/A | -16.4% | -9.3% | -16.4% | -5.0% | ||
| 2021 | Percentage | N/A | 58.1% | 65.2% | 59.1% | 69.5% | 74.3% |
| Difference non-Indigenous Population | N/A | -16.2% | -9.1% | -15.2% | -4.8% | ||
| Five-Year Change | Percentage | N/A | -1.9% | -1.9% | -0.9% | -1.9% | -2.1% |
| Percentage Change in Gap | N/A | -1.2% | -2.2% | -7.3% | -4.0% | ||
| Result | Size of Change in the Gap | N/A | No change | No change | Small | No change | |
| Direction of Gap | N/A | No change | No change | Narrowing | No change | ||
Source: Indigenous Services Canada. Custom Tabulations, 2016 to 2021 Census of Population.
Notes:
A % change of 5.0% would be considered a small effect size, a % change of 12.5% would be considered a medium effect size and a % change of 20.0% or more would be considered a large effect size.
The on/off reserve breakdown is not included for children in foster care as it may be misleading, since Registered Indian children in foster care off reserve may come from families living on reserve.