Kindergarten to grade 12 operating expenditures 2017 to 2018 overview
In fiscal year 2017 to 2018, Indigenous and Northern Affairs Canada (INAC), now Indigenous Services Canada (ISC), invested approximately $2 billion to support the delivery of kindergarten to grade 12 (K12) education for First Nations students ordinarily living on reserve.
On this page
Background
INAC (now ISC) updated its calculation approach for kindergarten to grade 12 operating expenditures in 2013 to 2014 to better align how it reports elementary and secondary expenditures with methods used by Statistics Canada and provincial ministries of education. There were 2 major changes to the previous methodology:
- funding for the operations and maintenance of school buildings has now been included
- funding for elementary and secondary education provided through self-government agreements has been excluded
To find out more about the updated methodology, see our kindergarten to grade 12 operating expenditures methodology webpage.
Budget 2016
Budget 2016 included substantial investments in primary and secondary education on reserve, totaling $2.6 billion over 5 years starting in 2016 to 2017. This includes funding to address immediate needs and to keep pace with cost growth over the medium term, in addition to investments in language and cultural programming, investments in literacy and numeracy programs and special needs education. In 2016 to 2017, the increased funding resulted in an overall investment of $1.94 billion.
In fiscal year 2017 to 2018 the increased funding resulted in an overall investment of $2.04 billion.
This included:
- $1.78 billion for elementary and secondary instructional services, student support services and proposal-based and targeted programs such as:
- $124 million to operate and maintain school facilities
- an estimated $143 million to support kindergarten to grade 12 teachers and staff through Band Support Funding and Employee Benefits related to education services
Student enrolment
In fiscal year 2017 to 2018, the Government of Canada's investments in kindergarten to grade 12 education supported about 107,100 First Nations students, ordinarily resident on reserve. Considering that a number of these students attended school part-time, such as many kindergarten students, 102,727 full-time equivalent (FTE) students received support.
Table 1 shows the distribution of these students by region. The number of students from communities under self-government agreements are not included in this table. Consult Enrolment to find out more.
A distribution of these students by region is given in table 1 below.
| British Columbia | Alberta | Saskatchewan | Manitoba | Ontario | Quebec | Atlantic | All provinces | % of total | |
|---|---|---|---|---|---|---|---|---|---|
| First Nation-operated schools | 4,570 | 9,846 | 16,070 | 15,667 | 12,913 | 6,333 | 1,659 | 67,056 | 65.3% |
| Provincial schools | 7,243 | 6,615 | 0 | 5,720 | 5,931 | 1,539 | 0 | 32,126 | 31.3% |
| Private and independent schools | 675 | 244 | 0 | 242 | 531 | 318 | 0 | 2,069 | 2.0% |
| Federal schools | N/A | 89 | N/A | N/A | 1,387 | N/A | N/A | 1,476 | 1.4% |
| Total FTE students | 12,488 | 16,794 | 19,609 | 21,628 | 20,761 | 8,190 | 3,258 | 102,727 | 100% |
| Note: Figures may not add up due to rounding. FTE counts do not include students under self-government agreements. | |||||||||
Per student funding
ISC provided about $19,858 per FTE student in fiscal year 2017 to 2018 for kindergarten to grade 12 education operating expenditures.
This calculation does not include the additional $200 million investment in First Nations education infrastructure for capital projects, targeted projects and salary or administration expenses on reserve.
Table 2 provides a breakdown of the FTE student enrolment by region, ISC kindergarten to grade 12 expenditures displayed as regional totals and regional per FTE student amounts. These per-student averages vary across the country. Any funding comparisons must consider the factors that influence per student funding levels in order to be meaningful. Consult Per student Kindergarten to Grade 12 operating expenditures to find out more.
| British Columbia | Alberta | Saskatchewan | Manitoba | Ontario | Quebec | Atlantic | All provinces* | |
|---|---|---|---|---|---|---|---|---|
| Total kindergarten to grade 12 operating expenditures in $ millions | $248.1 | $333.5 | $389.4 | $429.4 | $412.3 | $162.6 | $64.7 | $2,040.0 |
| Total FTE students | 12,488 | 16,794 | 19,609 | 21,628 | 20,761 | 8,190 | 3,258 | 102,727 |
| Per FTE student elementary and secondary expenditures | $19,867 | $19,858 | $19,858 | $19,854 | $19,859 | $19,854 | $19,859 | $19,858 |
| Figures might not add up due to rounding. FTE counts do not include students under self-government agreements. | ||||||||
Methods of funding
ISC provides funding to First Nations, tribal councils and regional First Nations educational service organizations who all share some responsibility for administering and delivering elementary and secondary education to students living on reserve.
These investments in First Nations education for students living on reserve are made through a number of programs that are allocated as core, proposal-based or targeted funding.
Table 3 describes the different methods of funding ISC uses to allocate funding and organizes each program with its corresponding funding method.
| Method of funding | Description | Funded program |
|---|---|---|
| Core funding | Core funding reflects the majority of investments and supports basic classroom and school operations including:
In general, regional offices allocate core funding to First Nations or organizations designated by First Nations that are responsible for managing and delivering education programs and services. Funding levels are most often formula-based and respond to:
|
|
| Proposal-based funding | Proposal-based funding supports often time-limited projects where funding levels respond to proposals submitted by First Nations, tribal councils or regional First Nations educational service organizations. | |
| Targeted funding | Targeted funding supports very specific initiatives or needs. These investments have their own program terms and conditions and often include reporting requirements. |
Description of the kindergarten to grade 12 operating expenditures 2017 to 2018
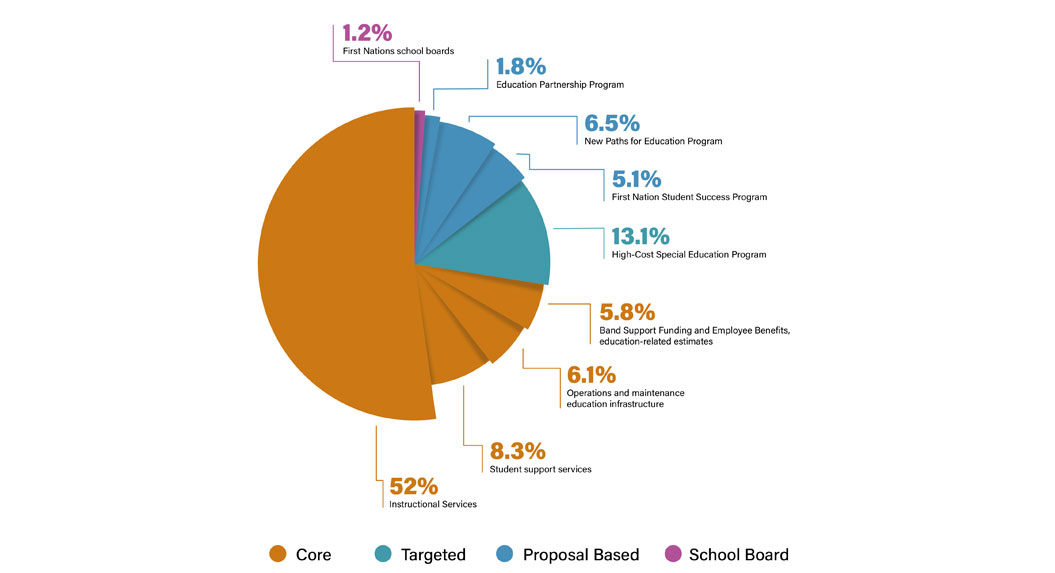
The graphic presents a percentage breakdown of kindergarten to grade 12 operating expenditures for fiscal year 2017 to 2018 by program. Programs are also grouped by whether they are allocated as core, proposal-based, targeted or school board funding.
Kindergarten to grade 12 operating expenditures for fiscal year 2017 to 2018 by program and percent share of total investments are as follows, in descending order of allocation amount:
- Instructional services provides core funding and accounts for 52% of total expenditures
- High-Cost Special Education Program provides targeted funding and accounts for 13.1% of total expenditures
- Student support services provide core funding and accounts for 8.3% of total expenditures
- Estimated proportion of employee benefits and band support funding that relates to education is provided as core funding and accounts for 5.8% of total expenditures
- Operations and maintenance of education infrastructure provides core funding and accounts for 6.1% of total expenditures
- First Nation Student Success Program provides proposal-based funding and accounts for 5.1% of total expenditures
- New Paths for Education Program provides proposal-based funding and accounts for 6.5% of total expenditures
- Education Partnerships Program provides proposal-based funding and accounts for 1.8% of total expenditures
Increases in funding
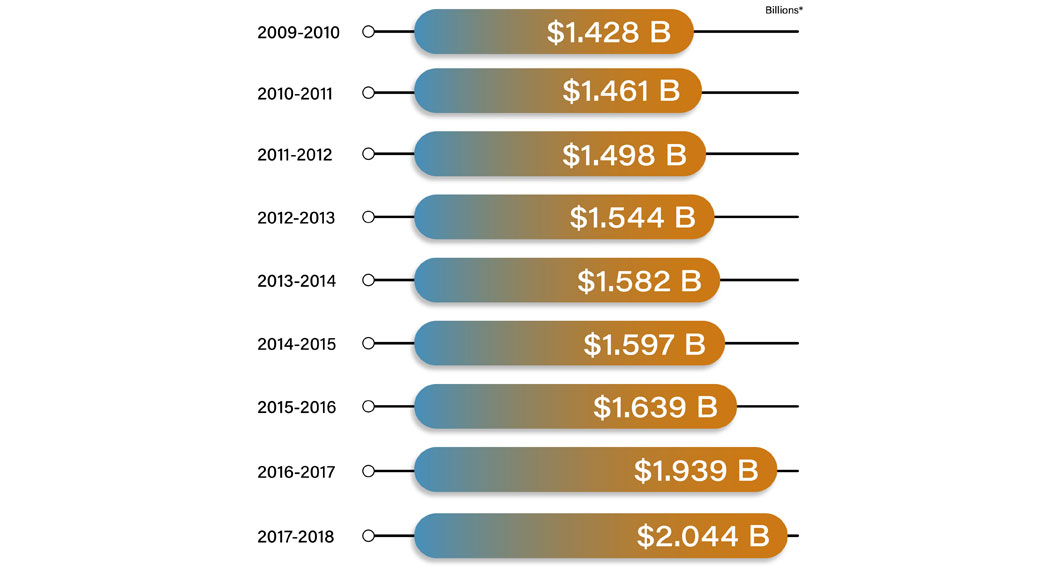
Between 2009 to 2010 and 2017 to 2018, the percentage funding increases are as follows:
- Fiscal year 2009 to 2010: investment of $1.428 billion, an increase of 4.4% from the previous year
- Fiscal year 2010 to 2011: investment of $1.461 billion, an increase of 2.3% from the previous year
- Fiscal year 2011 to 2012: investment of $1.498 billion, an increase of 2.5% from the previous year
- Fiscal year 2012 to 2013: investment of $1.544 billion, an increase of 3.1% from the previous year
- Fiscal year 2013 to 2014: investment of $1.582 billion, an increase of 2.5% from the previous year
- Fiscal year 2014 to 2015: investment of $1.597 billion, an increase of 0.94% from the previous year
- Fiscal year 2015 to 2016: investment of $1.639 billion, an increase of 2.6% from the previous year
- Fiscal year 2016 to 2017: investment of $1.939 billion, an increase of 18.3% from the previous year
- Fiscal year 2017 to 2018: investment of $2.043 billion, an increase of 5.4% from the previous year
The total increase in funding from fiscal year 2009 to 2010 to the end of fiscal year 2017 to 2018 is 42%.
To achieve meaningful gains in education outcomes for First Nations, Budget 2017 included significant funding to support the transformation of the current on-reserve education system through a respectful process of consultation and partnership with First Nations.
Definitions
Financial data: All financial data are sourced from ISC's Integrated Financial System. Amounts include expenses for teachers and staff at federally-operated schools and also reflect total expenditures transferred to First Nations and other partners for the purposes of supporting elementary and secondary education for eligible First Nations students ordinarily resident on reserve attending First Nation-operated, provincially-operated, private or independent, and federally-operated schools. Figures include funding to support:
- Instructional services
- Student support services
- New Paths for Education programming
- First Nations Student Success Program
- Education Partnerships Program
- The High-Cost Special Education Program
- Estimated amount of employee benefits and band support funding for kindergarten to grade 12 education staff
- Operation and maintenance of education facilities
Enrolment: Student numbers are derived from the ISC Nominal Roll for the 2017 to 2018 school year. The Nominal Roll, a registry of the number of students residing on reserve who attend school on and off reserve, is collected annually by First Nations and sent to ISC's regional offices. Figures for British Columbia include 30 FTEs and associated expenditures residing and attending school in Northern British Columbia but who are funded through the ISC regional office in Yukon.
Federal schools: There are 7 federally-operated schools serving First Nations in Canada. Of these 5, JC Hill Senior Elementary School, Emily C. General School, Oliver Smith-Kawenni Io Elementary School, IL Thomas Odadrihonyani'ta' School, and Jamieson Elementary School serve the Six Nations of the Grand River in Ontario, 1, Quinte Mohawk School, serves the Tyendinaga Mohawk in Ontario and 1, Legoff School, serves the Cold Lake First Nations in Alberta. Federal schools are located on reserve but are administered by the ISC regional offices in Ontario and Alberta, at the request of First Nations.
Per FTE student kindergarten to grade 12 operating expenditures: Calculations of per FTE student elementary or secondary expenditures are included for illustrative purposes only at a regional level. Calculations include those funds allocated for the maintenance of education facilities but not the construction or renovation of education facilities or funding for departmental administration and salaries with respect to education infrastructure.
Per-student funding averages vary across the country and any funding comparisons must consider factors such as the type of school or organization, for example, First Nations-operated schools, provincially-operated schools off reserve, federally-operated schools on reserve, private schools on or off reserves or First Nations education organizations, the student population and the geographic location of schools and students. All these factors influence funding levels.
The following education-related expenditures have been excluded from the per capita calculation:
- funding for First Nations education infrastructure for capital projects, targeted projects and salary or administration expenses
- FTE students or related education funding provided under comprehensive self-government arrangements
- funding for post-secondary education
- funding provided through the First Nations and Inuit Cultural Education Centres Program and the First Nations and Inuit Youth Employment Strategy
- funding provided under the James Bay and Northern Quebec Agreement and Northeastern Quebec Agreement and the Mi'kmaw Kina'matnewey Education Agreement. The FTE students associated with the education agreements are also not included in the figures provided
- ISC headquarters and ISC regional offices salaries and operations costs, with the exception of those going to support federal schools
- funding provided to support education-related activities through the Professional and Institutional Development Program or tribal council funding
All data reflects the best and most recent available at the time of publication.