This publication was prepared by the Strategic Research and Statistics Directorate of Strategic Policy and Partnerships Sector in collaboration with the Indian Registration and Integrated Program Management Directorate, Regional Operations Sector, Indigenous Services Canada.
Should you require clarification or additional population statistics, please call 1-800-567-9604, or e-mail aadnc.infopubs.aandc@canada.ca.
Introduction
The Registrar within the department of Indigenous Services Canada (ISC) is required by the Indian Act (Chapter I, Section 5 (1)) to record in the Indian Register the names of individuals who are registered under the act. The Indian Registration System (IRS) is a database which records individuals’ names and a range of non-statutory data. The Registered Indian Population by Sex and Residence describes the IRS population as recorded at December 31, 2019. Descriptive statistics are developed from the IRS that include sex, residence, registry group, responsibility centre and region.
Difference from the 2018 edition
Binche Whut’en (Band No. 730) in the British Columbia Region was constituted via a division of the Tl’azt’en Nation (Band No. 617).
Data organization
Data are organized in 2 broad sections. The first section provides summary statistics that include age and gender distribution, and residency comparisons for all regions and Canada.
The second section presents information for each registry group arranged by sex, residence, responsibility centre and region. For purposes of the Privacy Act, data in this section are collapsed into 3 columns by rolling residency fields 1 through 5 into one "On reserve and on Crown land" category. This minimizes the presence of small numbers in order to preserve privacy and data confidentiality.
Entire registry groups with total membership of less than 40 people are suppressed from the Detailed tables section and indicated by a * in every cell. Furthermore, other techniques are in place such as suppression of individual cells smaller than 10 as well as suppression of adjacent cells to guard against residual disclosure. The counts of any suppressed cells, however, are included in aggregations to district, regional and national totals.
In total, data for 11 registry groups and general lists required suppression. In terms of registry groups, 4 in British Columbia were suppressed. As for general lists, there were 2 suppressions in Ontario, 1 in Manitoba, 2 in Saskatchewan, 1 in the Yukon and 1 in the Northwest Territories.
Types of residence
There are 6 types of residence, all of which are active fields used in the Indian Register. They represent individuals registered under the Indian Act, or who are descendants of individuals registered under the Indian Act, whose residency is captured by any one of the following:
On reserve own band
On reserve other band
On Crown land own band
On Crown land other band
On Crown land no band
Off reserve
Unlike some other ISC and Crown-Indigenous Relations and Northern Affairs Canada systems, the Indian Register does not distinguish between Indian Act reserves and lands affiliated to First Nations operating under self-government agreements (SGAs). Technically, once a SGA is ratified, the lands are no longer considered Indian Reserves under the provisions of the Indian Act. Therefore, individuals in the "On reserve and on Crown land" category may reside on lands legally defined as Indian reserves, on Indian settlements usually represented by Crown Lands and on other lands affiliated to self-governing First Nations.
The "Off reserve" category represents individuals affiliated to First Nations who may reside neither on reserve nor on Crown land according to the Indian Register.
Distinction between the words "band," "registry group" and "reserve"
A band refers to a body of Indians for whose collective use and benefit lands have been set apart or money is held by the Crown, or declared to be a band for purposes of the Indian Act.
A registry group is an administrative term used in the Indian Register. For details, please refer to point 1 under Source of data.
A reserve, as defined in the Indian Act, means a tract of land, the legal title to which is vested in Her Majesty, that has been set apart by Her Majesty for the use and benefit of a band.
At December 31, 2019, there were 619 bands or 634 registry groups in Canada and 3,371 reserves, not all of which are inhabited.
Note to users
The Indian Register is meant to record individual names in accordance with specific sub-sections of the Indian Act. The Indian Register does not include all persons who are entitled to be registered according to the Indian Act, only those who have applied to be registered and whose entitlement has been verified. Therefore, data from the IRS may not fully meet the requirements of some statistical activities (for example demographic projections, migration patterns).
There is a reporting lag between the occurrence of a given life event and its being reported and recorded for updating of the Indian Register. This means that events occurring prior to December 31, 2019 may not be reflected in the Indian Register as documented on that date. The following examples illustrate this concept:
Infants entitled to be registered at birth may not be registered by the December 31st reporting date. Parents often do not report the birth until a later year. It is estimated that of all births reported in 2019, approximately 86% had actually occurred prior to 2019.
Individuals can remain on the Indian Register for some time after they are deceased. A certificate of death or a confirmation of presumed death is normally required to remove a name from the Indian Register.
Residency codes are typically updated when a life event is reported, although some bands update them more frequently. Residency remains a voluntary field in that the information is not mandatory to collect.
Source of data
Individuals are considered Registered Indians if their names appear on the Indian Register. Names are added or deleted from the Indian Register based on legal sources of information such as provincial birth or death certificates.
The addition or removal of a name to or from any part of the Indian Register is approved by the Registrar as set out in the Indian Act.
The following concepts may affect interpretation and utility
Data in the Detailed tables are presented by registry group. A registry group is an administrative term applied to a group of Indian Register individuals who have membership in a particular Indian band, or, are descendants from members of that band. A band usually relates to only 1 registry group except in the following 3 cases: Six Nations of the Grand River band in the Ontario Region consists of 13 registry groups (see the list of Canada's 25 largest bands below); Stoney band in the Alberta Region consists of 3 registry groups (Bearspaw, Chiniki and Wesley); and the Champagne and Aishihik First Nations band in the Yukon Region consists of 2 registry groups (Aishihik and Champagne). The registry groups related to these bands are noted in the Detailed tables section of this publication.
Affiliation of an individual with a particular registry group in the Indian Registration System is based on ancestry and may not equate to local band membership rules. Membership may be determined by other instruments operating outside of the Indian Act. For instance, as at December 31, 2019, 39 First Nations were part of various self-government agreements. As for Indian Act bands, they may choose to legally take control of their membership rules in accordance with Section 10 of the act. As at the 2019 year-end, 229 Indian Act bands, or about 40%, have done so.
The statistics in this publication report the number of individuals who are registered under the Indian Act. They make no statement as to whether or not the individuals are band members, only that they are affiliated to a registry group.
The "On reserve and on Crown land" category does not necessarily identify the specific geographic location of registrants. As for the "Off reserve" component, because the data are presented by affiliated registry group, the individuals may not reside in that particular region, or even inside Canada for that matter.
Administrative changes to the Indian Register in 2019
2018 groups affected by region
2019 changes by region
Quebec region
Première Nation Malecite de Viger
Première Nation Wolastoqiyik (Malécite) Wahsipekuk
Ontario region
Obashkaandagaang
Ochiichagwe'babigo'ining First Nation
Washagamis Bay
Niisaachewan Anishinaabe Nation
Saskatchewan region
Sakimay First Nations
Zagimē Anishinabek
British Columbia region
Hagwilget Village
Lake Cowichan First Nation
Leq’ a: mel First Nation
Tl'azt'en Nation; divided
Hagwilget First Nation Government
Ts'uubaa-asatx
Leq'á:mel First Nation
Tl'azt'en Nation
Binche Whut’en; new
Summary statistics
Registered Indian population by region and type of residence, December 31, 2019
Region
Number of bands
On reserve (a)
On Crown land (b)
Off reserve (c)
Total a + b + c
Atlantic
34
25,043
57
39,624
64,724
Quebec
40
57,310
1,593
32,390
91,293
Ontario *
126
96,773
1,997
119,681
218,451
Manitoba
63
93,603
1,089
68,095
162,787
Saskatchewan
70
77,334
1,553
83,315
162,202
Alberta *
45
76,525
3,220
51,952
131,697
British Columbia
199
62,535
398
85,646
148,579
Yukon *
16
555
3,431
5,577
9,563
Northwest Territories
26
393
12,419
6,847
19,659
Canada
619
490,071
25,757
493,127
1,008,955
* Consult Source of data for band / registry group affiliations
On reserve and/or on Crown land counts can include individuals living on lands affiliated with First Nations operating under self-government agreements.
Registered Indian population by type of residence for All Canada, December 31, 1992 – 2019
Year
Number of bands
On reserve (a)
On Crown land (b)
Off reserve (c)
Total a + b + c
1992
604
295,032
20,631
217,798
533,461
1993
605
305,247
21,197
226,872
553,316
1994
607
314,843
21,800
237,014
573,657
1995
608
325,453
22,466
245,131
593,050
1996
609
331,289
23,080
256,505
610,874
1997
608
341,825
23,981
261,629
627,435
1998
609
351,671
24,056
266,687
642,414
1999
610
360,707
24,071
275,112
659,890
2000
612
368,556
23,437
283,506
675,499
2001
612
373,121
23,567
293,413
690,101
2002
614
380,067
23,270
301,514
704,851
2003
614
386,605
23,066
309,825
719,496
2004
614
391,459
23,963
318,204
733,626
2005
615
397,980
24,203
326,188
748,371
2006
615
404,117
24,329
335,109
763,555
2007
615
410,889
23,697
343,464
778,050
2008
615
419,647
23,956
350,437
794,040
2009
615
427,554
24,234
357,518
809,306
2010
616
434,730
24,429
365,182
824,341
2011
617
441,891
24,706
401,609
868,206
2012
617
448,690
25,352
427,011
901,053
2013
617
455,381
25,687
438,677
919,745
2014
617
462,184
25,878
448,163
936,225
2015
618
468,762
25,959
458,322
953,043
2016
618
476,223
25,789
468,550
970,562
2017
618
483,675
25,341
478,504
987,520
2018
618
486,928
25,351
482,388
994,667
2019
619
490,071
25,757
493,127
1,008,955
On reserve and/or on Crown land counts can include individuals living on lands affiliated with First Nations operating under self-government agreements.
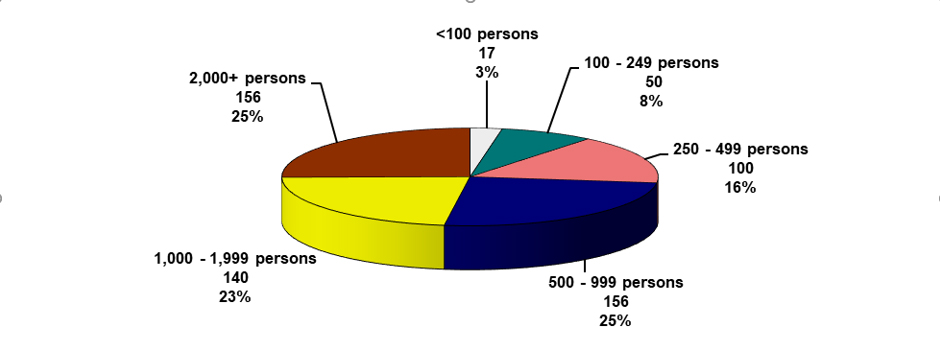
Figure 3 - Total populationDescription of Figure 3 - Total population
Total Population
Population
#
%
Less than 100 persons
17
3
100 – 249 persons
51
8
250 – 499 persons
101
16
500 – 999 persons
162
26
1,000 – 1,999 persons
142
22
2,000+ persons
161
25
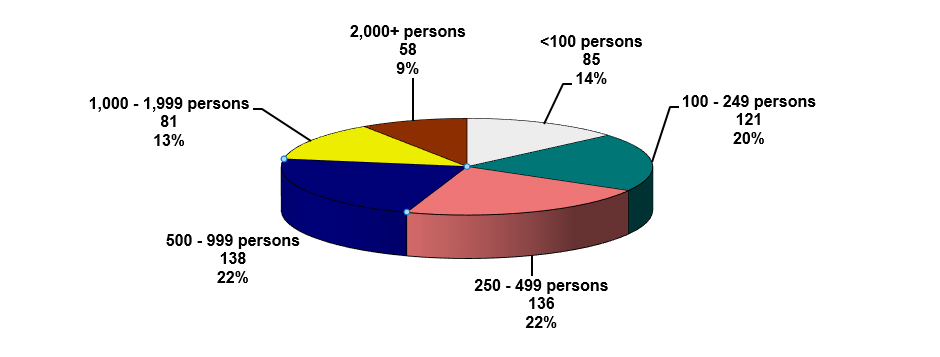
Figure 4 - On reserve and on Crown land populationDescription of Figure 4 - On reserve and on Crown land population
On reserve and on Crown land population
Population
#
%
Less than 100 persons
86
14
100 – 249 persons
124
20
250 – 499 persons
140
22
500 – 999 persons
140
22
1,000 – 1,999 persons
85
13
2,000+ persons
59
9
"On reserve and on Crown land" includes lands affiliated with First Nations operating under self-government agreements.
Registered Indian population, on and off reserve by age and sex, December 31, 2019
In the following regional tables and charts, "On reserve" includes individuals living on Crown land and on other lands affiliated with First Nations operating under self-government agreements.
Atlantic region
Registered Indian population, by type of residence, age groups and sex, December 31, 2019
Age
On reserve
Off reserve
Total - All residencies
Male
Female
Male
Female
Male
Female
#
%
#
%
#
%
#
%
#
%
#
%
0-4
891
3.5
873
3.5
380
1.0
366
0.9
1,271
2.0
1,239
1.9
5-9
1,133
4.5
1,214
4.8
943
2.4
911
2.3
2,076
3.2
2,125
3.3
10-14
1,247
5.0
1,148
4.6
1,326
3.3
1,223
3.1
2,573
4.0
2,371
3.7
15-19
1,130
4.5
1,056
4.2
1,291
3.3
1,299
3.3
2,421
3.7
2,355
3.6
20-24
1,175
4.7
1,155
4.6
1,442
3.6
1,423
3.6
2,617
4.0
2,578
4.0
25-29
1,138
4.5
1,134
4.5
1,585
4.0
1,555
3.9
2,723
4.2
2,689
4.2
30-34
996
4.0
922
3.7
1,380
3.5
1,387
3.5
2,376
3.7
2,309
3.6
35-39
801
3.2
860
3.4
1,346
3.4
1,389
3.5
2,147
3.3
2,249
3.5
40-44
757
3.0
735
2.9
1,315
3.3
1,376
3.5
2,072
3.2
2,111
3.3
45-49
743
3.0
689
2.7
1,494
3.8
1,482
3.7
2,237
3.5
2,171
3.4
50-54
708
2.8
742
3.0
1,499
3.8
1,625
4.1
2,207
3.4
2,367
3.7
55-59
603
2.4
651
2.6
1,435
3.6
1,603
4.0
2,038
3.1
2,254
3.5
60-64
471
1.9
495
2.0
1,208
3.0
1,458
3.7
1,679
2.6
1,953
3.0
65 +
687
2.7
946
3.8
2,566
6.5
3,317
8.4
3,253
5.0
4,263
6.6
All ages
12,480
49.7
12,620
50.3
19,210
48.5
20,414
51.5
31,690
49.0
33,034
51.0
Total - both sexes
25,100
39%
39,624
61%
64,724
100%
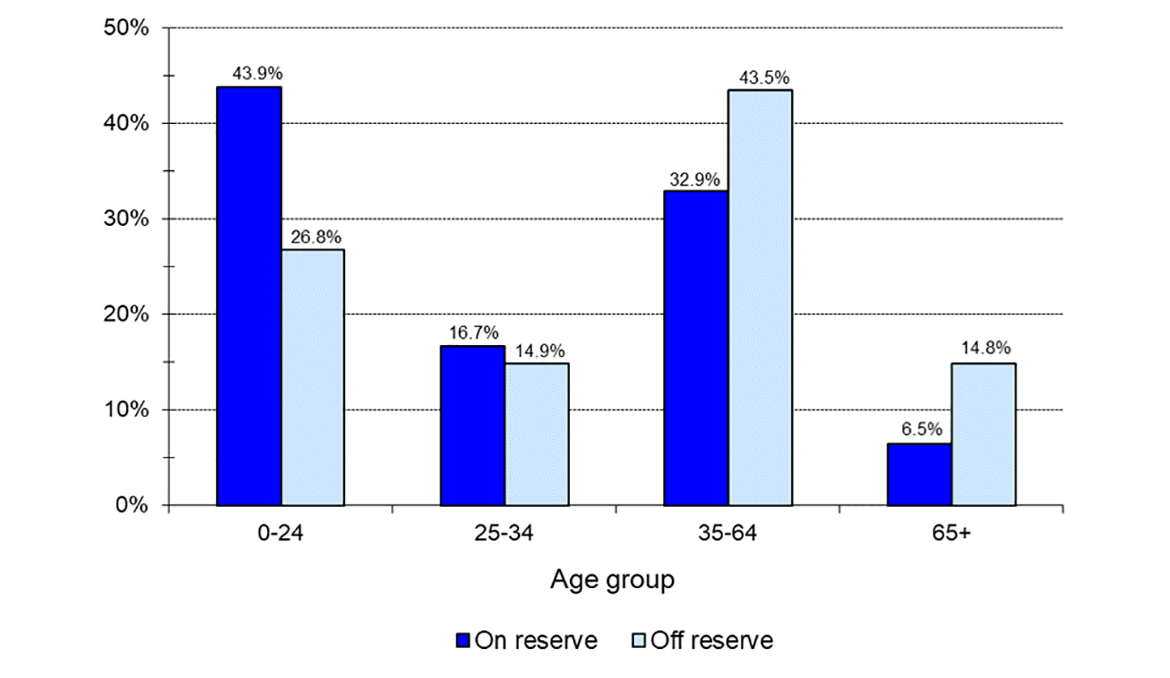
Figure 5 - Registered Indian population, by type of residence and selected age groups, December 31, 2019Description of Figure 5 - Registered Indian population, by type of residence and selected age groups, December 31, 2019
Registered Indian population, by type of residence and selected age groups, December 31, 2019
Age group
Populations
Percentages
On reserve
Off reserve
On reserve
Off reserve
0-24
11,022
10,604
43,9%
26,8%
25-34
4,190
5,907
16,7%
14,9%
35-64
8,255
17,230
32,9%
43,5%
65+
1,633
5,883
6,5%
14,8%
Figure 5
Quebec region
Registered Indian population, by type of residence, age groups and sex, December 31, 2019
Age
On reserve
Off reserve
Total - All residencies
Male
Female
Male
Female
Male
Female
#
%
#
%
#
%
#
%
#
%
#
%
0-4
1,694
2.9
1,586
2.7
362
1.1
393
1.2
2,056
2.3
1,979
2.2
5-9
2,537
4.3
2,446
4.2
706
2.2
706
2.2
3,243
3.6
3,152
3.5
10-14
2,905
4.9
2,688
4.6
877
2.7
788
2.4
3,782
4.1
3,476
3.8
15-19
2,653
4.5
2,409
4.1
916
2.8
888
2.7
3,569
3.9
3,297
3.6
20-24
2,548
4.3
2,425
4.1
1,065
3.3
1,078
3.3
3,613
4.0
3,503
3.8
25-29
2,663
4.5
2,493
4.2
1,235
3.8
1,246
3.8
3,898
4.3
3,739
4.1
30-34
2,150
3.7
2,063
3.5
1,106
3.4
1,214
3.7
3,256
3.6
3,277
3.6
35-39
1,862
3.2
1,803
3.1
1,107
3.4
1,103
3.4
2,969
3.3
2,906
3.2
40-44
1,794
3.0
1,687
2.9
1,030
3.2
1,084
3.3
2,824
3.1
2,771
3.0
45-49
1,825
3.1
1,794
3.0
1,037
3.2
1,174
3.6
2,862
3.1
2,968
3.3
50-54
1,728
2.9
1,743
3.0
1,136
3.5
1,301
4.0
2,864
3.1
3,044
3.3
55-59
1,540
2.6
1,589
2.7
1,252
3.9
1,480
4.6
2,792
3.1
3,069
3.4
60-64
1,205
2.0
1,391
2.4
1,053
3.3
1,422
4.4
2,258
2.5
2,813
3.1
65 +
2,483
4.2
3,199
5.4
2,228
6.9
3,403
10.5
4,711
5.2
6,602
7.2
All ages
29,587
50.2
29,316
49.8
15,110
46.7
17,280
53.3
44,697
49.0
46,596
51.0
Total - both sexes
58,903
65%
32,390
35%
91,293
100%
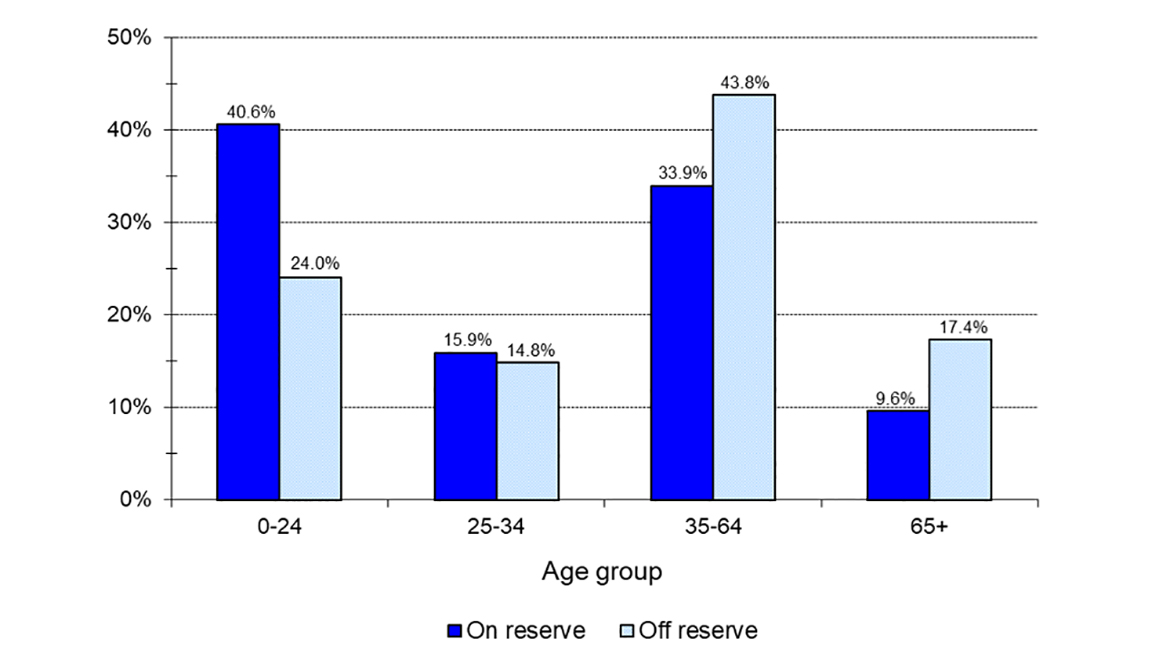
Figure 6 - Registered Indian population, by type of residence and selected age groups, December 31, 2019Description of Figure 6 - Registered Indian population, by type of residence and selected age groups, December 31, 2019
Registered Indian population, by type of residence and selected age groups, December 31, 2019
Age group
Populations
Percentages
On reserve
Off reserve
On reserve
Off reserve
0-24
23,891
7,779
40.6%
24.0%
25-34
9,369
4,801
15.9%
14.8%
35-64
19,961
14,179
33.9%
43.8%
65+
5,682
5,631
9.6%
17.4%
Ontario region
Registered Indian population, by type of residence, age groups and sex, December 31, 2019
Age
On reserve
Off reserve
Total - All residencies
Male
Female
Male
Female
Male
Female
#
%
#
%
#
%
#
%
#
%
#
%
0-4
2,359
2.4
2,209
2.2
1,530
1.3
1,394
1.2
3,889
1.8
3,603
1.6
5-9
4,189
4.2
4,077
4.1
2,992
2.5
2,914
2.4
7,181
3.3
6,991
3.2
10-14
4,508
4.6
4,317
4.4
3,577
3.0
3,468
2.9
8,085
3.7
7,785
3.6
15-19
4,375
4.4
4,114
4.2
3,830
3.2
3,789
3.2
8,205
3.8
7,903
3.6
20-24
4,462
4.5
4,196
4.2
4,516
3.8
4,423
3.7
8,978
4.1
8,619
3.9
25-29
4,385
4.4
4,366
4.4
4,974
4.2
4,777
4.0
9,359
4.3
9,143
4.2
30-34
4,036
4.1
3,717
3.8
4,385
3.7
4,507
3.8
8,421
3.9
8,224
3.8
35-39
3,379
3.4
3,249
3.3
4,009
3.3
4,359
3.6
7,388
3.4
7,608
3.5
40-44
3,055
3.1
2,861
2.9
3,891
3.3
4,148
3.5
6,946
3.2
7,009
3.2
45-49
2,816
2.9
2,740
2.8
4,175
3.5
4,432
3.7
6,991
3.2
7,172
3.3
50-54
2,891
2.9
2,722
2.8
4,201
3.5
4,657
3.9
7,092
3.2
7,379
3.4
55-59
2,750
2.8
2,767
2.8
4,187
3.5
4,939
4.1
6,937
3.2
7,706
3.5
60-64
2,309
2.3
2,388
2.4
3,292
2.8
4,288
3.6
5,601
2.6
6,676
3.1
65 +
4,299
4.4
5,234
5.3
6,935
5.8
11,092
9.3
11,234
5.1
16,326
7.5
All ages
49,813
50.4
48,957
49.6
56,494
47.2
63,187
52.8
106,307
48.7
112,144
51.3
Total - both sexes
98,770
45%
119,681
55%
218,451
100%
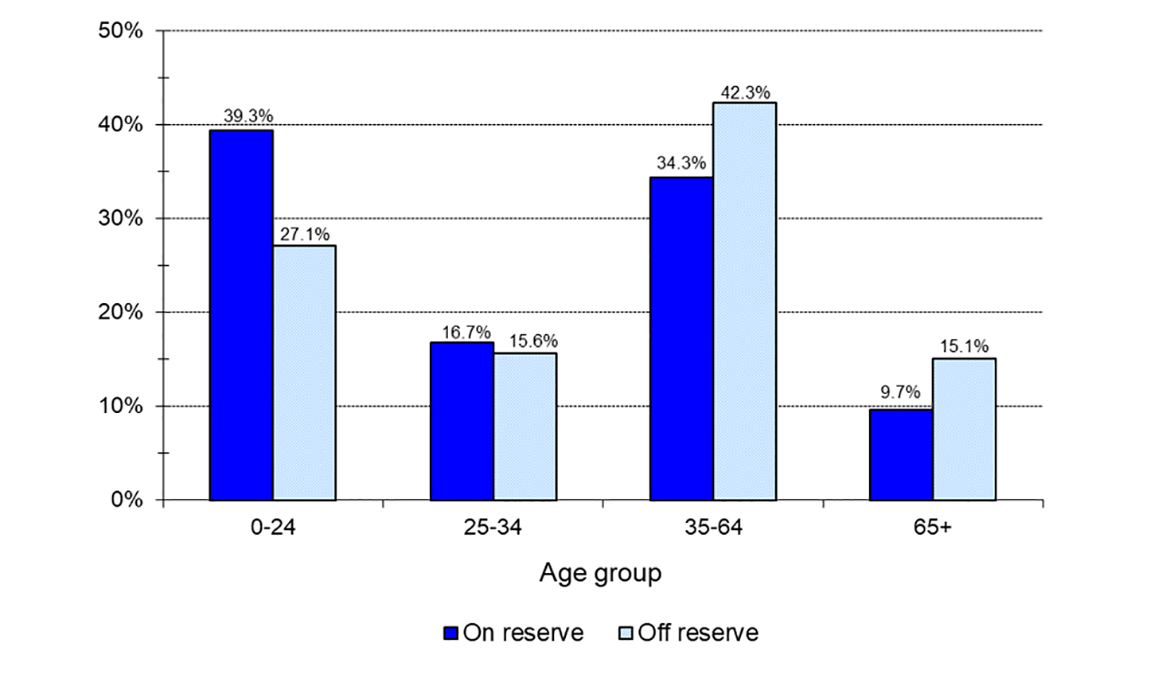
Figure 7 - Registered Indian population, by type of residence and selected age groups, December 31, 2019Description of Figure 7 - Registered Indian population, by type of residence and selected age groups, December 31, 2019
Registered Indian population, by type of residence and selected age groups, December 31, 2019
Age group
Populations
Percentages
On reserve
Off reserve
On reserve
Off reserve
0-24
38,806
32,433
39.3%
27.1%
25-34
16,504
18,643
16.7%
15.6%
35-64
33,927
50,578
34.3%
42.3%
65+
9,533
18,027
9.7%
15.1%
Manitoba region
Registered Indian population, by type of residence, age groups and sex, December 31, 2019
Age
On reserve
Off reserve
Total - All residencies
Male
Female
Male
Female
Male
Female
#
%
#
%
#
%
#
%
#
%
#
%
0-4
2,896
3.1
2,718
2.9
1,500
2.2
1,492
2.2
4,396
2.7
4,210
2.6
5-9
5,459
5.8
5,122
5.4
2,761
4.1
2,673
3.9
8,220
5.0
7,795
4.8
10-14
5,623
5.9
5,535
5.8
3,022
4.4
3,033
4.5
8,645
5.3
8,568
5.3
15-19
4,848
5.1
4,626
4.9
2,867
4.2
2,731
4.0
7,715
4.7
7,357
4.5
20-24
4,664
4.9
4,411
4.7
3,023
4.4
2,930
4.3
7,687
4.7
7,341
4.5
25-29
4,663
4.9
4,389
4.6
3,079
4.5
3,208
4.7
7,742
4.8
7,597
4.7
30-34
3,764
4.0
3,634
3.8
2,641
3.9
2,659
3.9
6,405
3.9
6,293
3.9
35-39
3,070
3.2
2,794
3.0
2,272
3.3
2,322
3.4
5,342
3.3
5,116
3.1
40-44
2,617
2.8
2,445
2.6
2,076
3.0
2,192
3.2
4,693
2.9
4,637
2.8
45-49
2,581
2.7
2,433
2.6
2,090
3.1
2,397
3.5
4,671
2.9
4,830
3.0
50-54
2,394
2.5
2,251
2.4
2,031
3.0
2,354
3.5
4,425
2.7
4,605
2.8
55-59
2,023
2.1
1,897
2.0
1,793
2.6
2,258
3.3
3,816
2.3
4,155
2.6
60-64
1,501
1.6
1,459
1.5
1,205
1.8
1,603
2.4
2,706
1.7
3,062
1.9
65 +
2,303
2.4
2,572
2.7
2,298
3.4
3,585
5.3
4,601
2.8
6,157
3.8
All Ages
48,406
51.1
46,286
48.9
32,658
48.0
35,437
52.0
81,064
49.8
81,723
50.2
Total - both sexes
94,692
58%
68,095
42%
162,787
100%
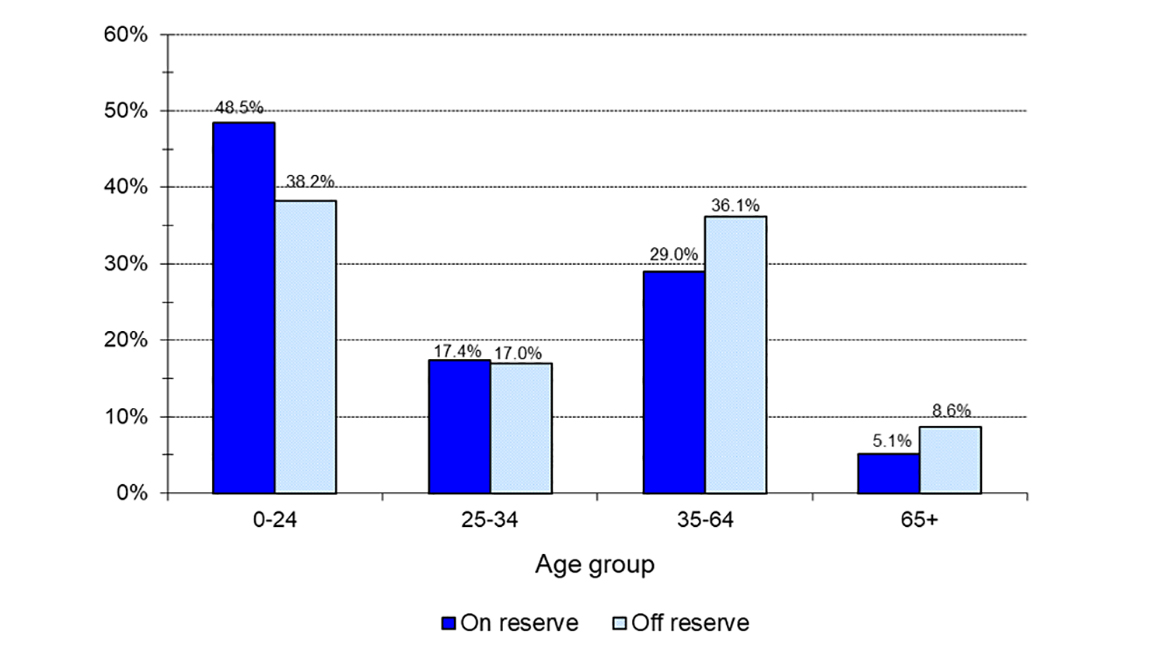
Figure 8 - Registered Indian population, by type of residence and selected age groups, December 31, 2019Description of Figure 8 - Registered Indian population, by type of residence and selected age groups, December 31, 2019
Registered Indian population, by type of residence and selected age groups, December 31, 2019
Age group
Populations
Percentages
On reserve
Off reserve
On reserve
Off reserve
0-24
45,902
26,032
48.5%
38.2%
25-34
16,450
11,587
17.4%
17.0%
35-64
27,465
24,593
29.0%
36.1%
65+
4,875
5,883
5.1%
8.6%
Saskatchewan region
Registered Indian population, by type of residence, age groups and sex, December 31, 2019
Age
On reserve
Off reserve
Total - All residencies
Male
Female
Male
Female
Male
Female
#
%
#
%
#
%
#
%
#
%
#
%
0-4
2,693
3.4
2,661
3.4
1,791
2.1
1,669
2.0
4,484
2.8
4,330
2.7
5-9
4,395
5.6
4,400
5.6
3,431
4.1
3,238
3.9
7,826
4.8
7,638
4.7
10-14
4,466
5.7
4,347
5.5
4,190
5.0
4,060
4.9
8,656
5.3
8,407
5.2
15-19
3,950
5.0
3,829
4.9
3,916
4.7
3,917
4.7
7,866
4.8
7,746
4.8
20-24
3,842
4.9
3,735
4.7
3,763
4.5
3,876
4.7
7,605
4.7
7,611
4.7
25-29
4,056
5.1
3,794
4.8
3,820
4.6
3,993
4.8
7,876
4.9
7,787
4.8
30-34
3,348
4.2
3,125
4.0
3,587
4.3
3,655
4.4
6,935
4.3
6,780
4.2
35-39
2,608
3.3
2,427
3.1
2,942
3.5
3,061
3.7
5,550
3.4
5,488
3.4
40-44
2,187
2.8
1,992
2.5
2,552
3.1
2,801
3.4
4,739
2.9
4,793
3.0
45-49
2,036
2.6
1,926
2.4
2,483
3.0
2,829
3.4
4,519
2.8
4,755
2.9
50-54
1,914
2.4
1,796
2.3
2,321
2.8
2,762
3.3
4,235
2.6
4,558
2.8
55-59
1,500
1.9
1,496
1.9
1,973
2.4
2,386
2.9
3,473
2.1
3,882
2.4
60-64
1,181
1.5
1,161
1.5
1,300
1.6
1,770
2.1
2,481
1.5
2,931
1.8
65 +
1,961
2.5
2,061
2.6
1,874
2.2
3,355
4.0
3,835
2.4
5,416
3.3
All ages
40,137
50.9
38,750
49.1
39,943
47.9
43,372
52.1
80,080
49.4
82,122
50.6
Total - both sexes
78,887
49%
83,315
51%
162,202
100%
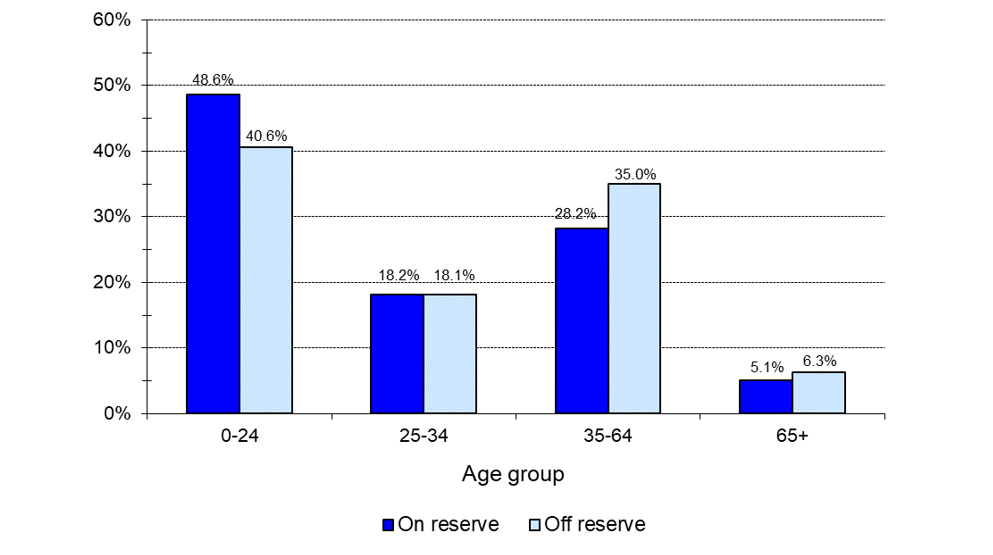
Figure 9 - Registered Indian population, by type of residence and selected age groups, December 31, 2019Description of Figure 9 - Registered Indian population, by type of residence and selected age groups, December 31, 2019
Registered Indian population, by type of residence and selected age groups, December 31, 2019
Age group
Populations
Percentages
On reserve
Off reserve
On reserve
Off reserve
0-24
38,318
33,851
48.6%
40.6%
25-34
14,323
15,055
18.2%
18.1%
35-64
22,224
29,180
28.2%
35.0%
65+
4,022
5,229
5.1%
6.3%
Alberta region
Registered Indian population, by type of residence, age groups and sex, December 31, 2019
Age
On reserve
Off reserve
Total - All residencies
Male
Female
Male
Female
Male
Female
#
%
#
%
#
%
#
%
#
%
#
%
0-4
2,706
3.4
2,580
3.2
1,038
2.0
988
1.9
3,744
2.8
3,568
2.7
5-9
4,280
5.4
4,060
5.1
2,303
4.4
2,214
4.3
6,583
5.0
6,274
4.8
10-14
4,284
5.4
4,208
5.3
2,748
5.3
2,604
5.0
7,032
5.3
6,812
5.2
15-19
4,002
5.0
3,813
4.8
2,283
4.4
2,233
4.3
6,285
4.8
6,046
4.6
20-24
4,164
5.2
3,877
4.9
2,082
4.0
2,075
4.0
6,246
4.7
5,952
4.5
25-29
4,171
5.2
3,804
4.8
2,118
4.1
2,133
4.1
6,289
4.8
5,937
4.5
30-34
3,370
4.2
3,186
4.0
1,974
3.8
2,097
4.0
5,344
4.1
5,283
4.0
35-39
2,611
3.3
2,627
3.3
1,821
3.5
1,960
3.8
4,432
3.4
4,587
3.5
40-44
2,119
2.7
2,068
2.6
1,721
3.3
1,810
3.5
3,840
2.9
3,878
2.9
45-49
1,900
2.4
1,973
2.5
1,569
3.0
1,731
3.3
3,469
2.6
3,704
2.8
50-54
1,841
2.3
1,809
2.3
1,490
2.9
1,700
3.3
3,331
2.5
3,509
2.7
55-59
1,585
2.0
1,711
2.1
1,265
2.4
1,546
3.0
2,850
2.2
3,257
2.5
60-64
1,221
1.5
1,290
1.6
875
1.7
1,197
2.3
2,096
1.6
2,487
1.9
65 +
2,075
2.6
2,410
3.0
1,566
3.0
2,811
5.4
3,641
2.8
5,221
4.0
All ages
40,329
50.6
39,416
49.4
24,853
47.8
27,099
52.2
65,182
49.5
66,515
50.5
Total - both sexes
79,745
61%
51,952
39%
131,697
100%
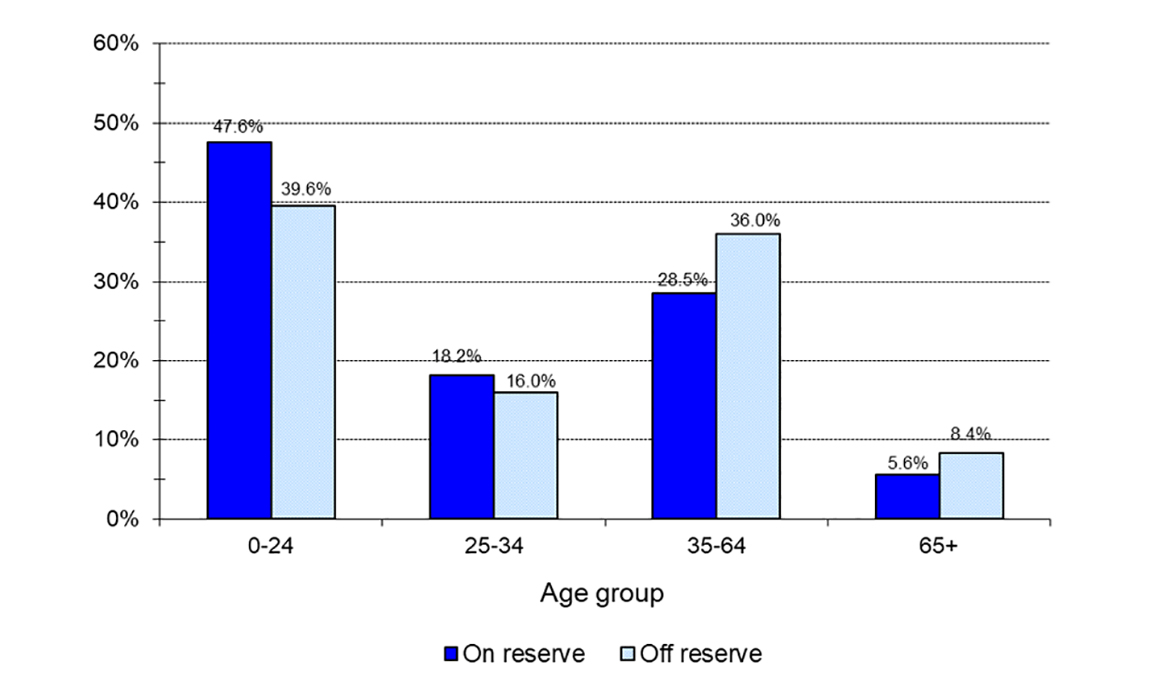
Figure 10 - Registered Indian population, by type of residence and selected age groups, December 31, 2019Description of Figure 10 - Registered Indian population, by type of residence and selected age groups, December 31, 2019
Registered Indian population, by type of residence and selected age groups, December 31, 2019
Age group
Populations
Percentages
On reserve
Off reserve
On reserve
Off reserve
0-24
37,974
20,568
47.6%
39.6%
25-34
14,531
8,322
18.2%
16.0%
35-64
22,755
18,685
28.5%
36.0%
65+
4,485
4,377
5.6%
8.4%
British Columbia region
Registered Indian population, by type of residence, age groups and sex, December 31, 2019
Age
On reserve
Off reserve
Total - All residencies
Male
Female
Male
Female
Male
Female
#
%
#
%
#
%
#
%
#
%
#
%
0-4
1,147
1.8
1,070
1.7
1,128
1.3
1,069
1.2
2,275
1.5
2,139
1.4
5-9
2,209
3.5
2,121
3.4
2,702
3.2
2,566
3.0
4,911
3.3
4,687
3.2
10-14
2,783
4.4
2,570
4.1
3,185
3.7
3,093
3.6
5,968
4.0
5,663
3.8
15-19
2,525
4.0
2,423
3.9
3,140
3.7
3,104
3.6
5,665
3.8
5,527
3.7
20-24
2,644
4.2
2,378
3.8
3,406
4.0
3,365
3.9
6,050
4.1
5,743
3.9
25-29
2,908
4.6
2,610
4.1
3,694
4.3
3,629
4.2
6,602
4.4
6,239
4.2
30-34
2,674
4.2
2,315
3.7
3,618
4.2
3,612
4.2
6,292
4.2
5,927
4.0
35-39
2,231
3.5
1,986
3.2
3,247
3.8
3,344
3.9
5,478
3.7
5,330
3.6
40-44
2,016
3.2
1,738
2.8
2,831
3.3
3,094
3.6
4,847
3.3
4,832
3.3
45-49
1,910
3.0
1,767
2.8
2,998
3.5
3,168
3.7
4,908
3.3
4,935
3.3
50-54
1,977
3.1
1,857
3.0
2,769
3.2
3,198
3.7
4,746
3.2
5,055
3.4
55-59
2,118
3.4
2,102
3.3
2,698
3.2
3,283
3.8
4,816
3.2
5,385
3.6
60-64
1,776
2.8
1,767
2.8
1,937
2.3
2,666
3.1
3,713
2.5
4,433
3.0
65 +
3,556
5.7
3,755
6.0
3,454
4.0
5,648
6.6
7,010
4.7
9,403
6.3
All ages
32,474
51.6
30,459
48.4
40,807
47.6
44,839
52.4
73,281
49.3
75,298
50.7
Total - both sexes
62,933
42%
85,646
58%
148,579
100%
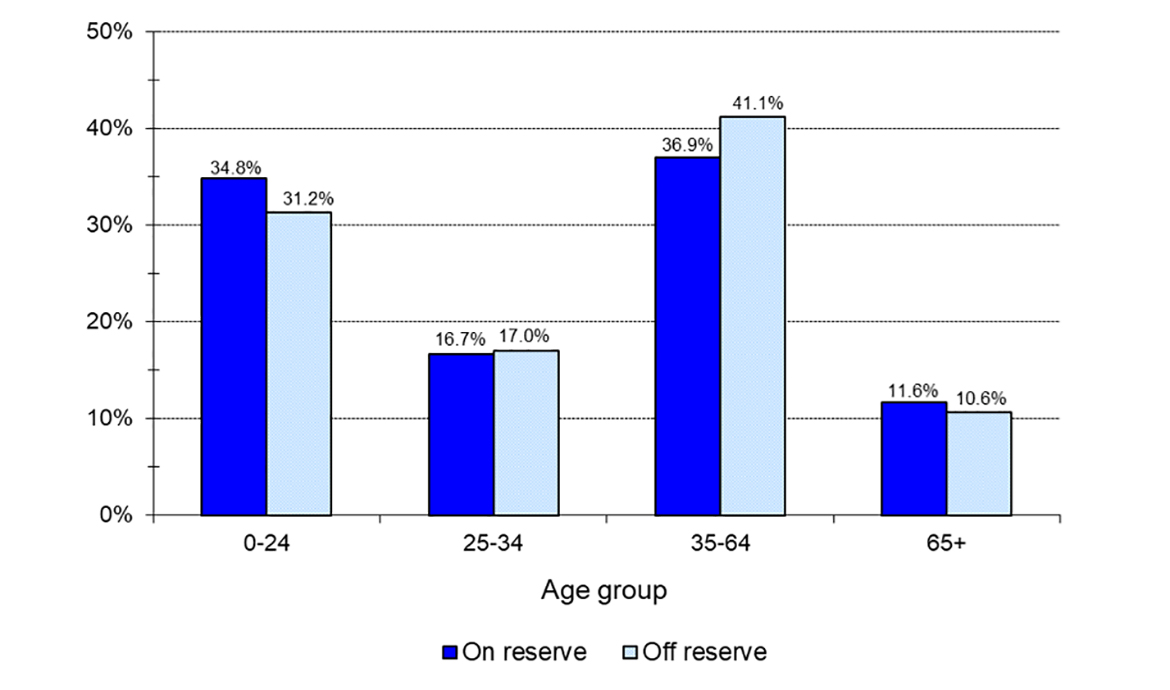
Figure 11 - Registered Indian population, by type of residence and selected age groups, December 31, 2019Description of Figure 11 - Registered Indian population, by type of residence and selected age groups, December 31, 2019
Registered Indian population, by type of residence and selected age groups, December 31, 2019
Age group
Populations
Percentages
On reserve
Off reserve
On reserve
Off reserve
0-24
21,870
26,758
34.8%
31.2%
25-34
10,507
14,553
16.7%
17.0%
35-64
23,245
35,233
36.9%
41.1%
65+
7,311
9,102
11.6%
10.6%
Yukon region
Registered Indian population, by type of residence, age groups and sex, December 31, 2019
Age
On reserve
Off reserve
Total - All residencies
Male
Female
Male
Female
Male
Female
#
%
#
%
#
%
#
%
#
%
#
%
0-4
56
1.4
70
1.8
62
1.1
56
1.0
118
1.2
126
1.3
5-9
117
2.9
92
2.3
142
2.5
123
2.2
259
2.7
215
2.2
10-14
134
3.4
99
2.5
164
2.9
162
2.9
298
3.1
261
2.7
15-19
144
3.6
137
3.4
214
3.8
185
3.3
358
3.7
322
3.4
20-24
165
4.1
149
3.7
217
3.9
230
4.1
382
4.0
379
4.0
25-29
192
4.8
182
4.6
222
4.0
219
3.9
414
4.3
401
4.2
30-34
146
3.7
144
3.6
220
3.9
231
4.1
366
3.8
375
3.9
35-39
125
3.1
137
3.4
233
4.2
222
4.0
358
3.7
359
3.8
40-44
141
3.5
103
2.6
183
3.3
183
3.3
324
3.4
286
3.0
45-49
144
3.6
135
3.4
219
3.9
197
3.5
363
3.8
332
3.5
50-54
172
4.3
120
3.0
233
4.2
233
4.2
405
4.2
353
3.7
55-59
211
5.3
142
3.6
187
3.4
266
4.8
398
4.2
408
4.3
60-64
125
3.1
113
2.8
138
2.5
212
3.8
263
2.8
325
3.4
65 +
246
6.2
245
6.1
197
3.5
427
7.7
443
4.6
672
7.0
All ages
2,118
53.1
1,868
46.9
2,631
47.2
2,946
52.8
4,749
49.7
4,814
50.3
Total - both sexes
3,986
42%
5,577
58%
9,563
100%
Figure 12 - Registered Indian population, by type of residence and selected age groups, December 31, 2019Description of Figure 12 - Registered Indian population, by type of residence and selected age groups, December 31, 2019
Registered Indian population, by type of residence and selected age groups, December 31, 2019
Age group
Populations
Percentages
On reserve
Off reserve
On reserve
Off reserve
0-24
1,163
1,555
29.2%
27.9%
25-34
664
892
16.7%
16.0%
35-64
1,668
2,506
41.8%
44.9%
65+
491
624
12.3%
11.2%
Northwest Territories region
Registered Indian population, by type of residence, age groups and sex, December 31, 2019
Age
On reserve
Off reserve
Total - All residencies
Male
Female
Male
Female
Male
Female
#
%
#
%
#
%
#
%
#
%
#
%
0-4
307
2.4
290
2.3
97
1.4
92
1.3
404
2.1
382
1.9
5-9
482
3.8
461
3.6
215
3.1
196
2.9
697
3.5
657
3.3
10-14
589
4.6
519
4.1
247
3.6
228
3.3
836
4.3
747
3.8
15-19
340
2.7
373
2.9
393
5.7
448
6.5
733
3.7
821
4.2
20-24
575
4.5
549
4.3
254
3.7
262
3.8
829
4.2
811
4.1
25-29
661
5.2
665
5.2
283
4.1
277
4.0
944
4.8
942
4.8
30-34
596
4.7
552
4.3
238
3.5
242
3.5
834
4.2
794
4.0
35-39
488
3.8
428
3.3
236
3.4
264
3.9
724
3.7
692
3.5
40-44
352
2.7
404
3.2
219
3.2
255
3.7
571
2.9
659
3.4
45-49
434
3.4
382
3.0
260
3.8
280
4.1
694
3.5
662
3.4
50-54
449
3.5
422
3.3
243
3.5
261
3.8
692
3.5
683
3.5
55-59
369
2.9
386
3.0
187
2.7
229
3.3
556
2.8
615
3.1
60-64
248
1.9
299
2.3
118
1.7
181
2.6
366
1.9
480
2.4
65 +
578
4.5
614
4.8
229
3.3
413
6.0
807
4.1
1,027
5.2
All ages
6,468
50.5
6,344
49.5
3,219
47.0
3,628
53.0
9,687
49.3
9,972
50.7
Total - both sexes
12,812
65%
6,847
35%
19,659
100%
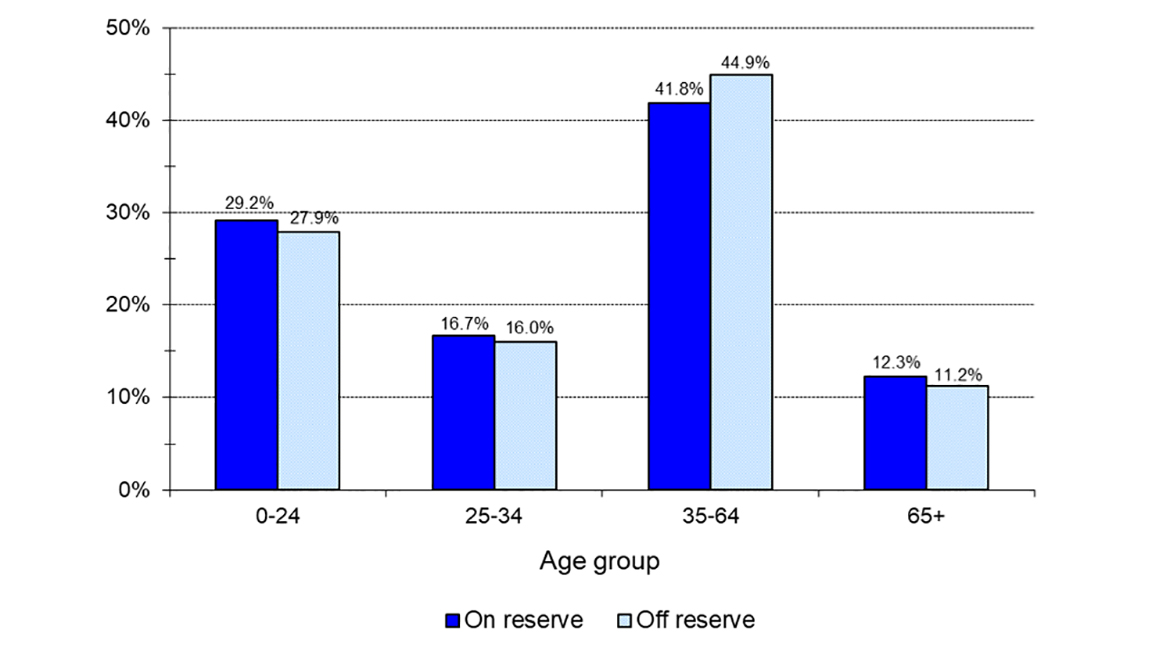
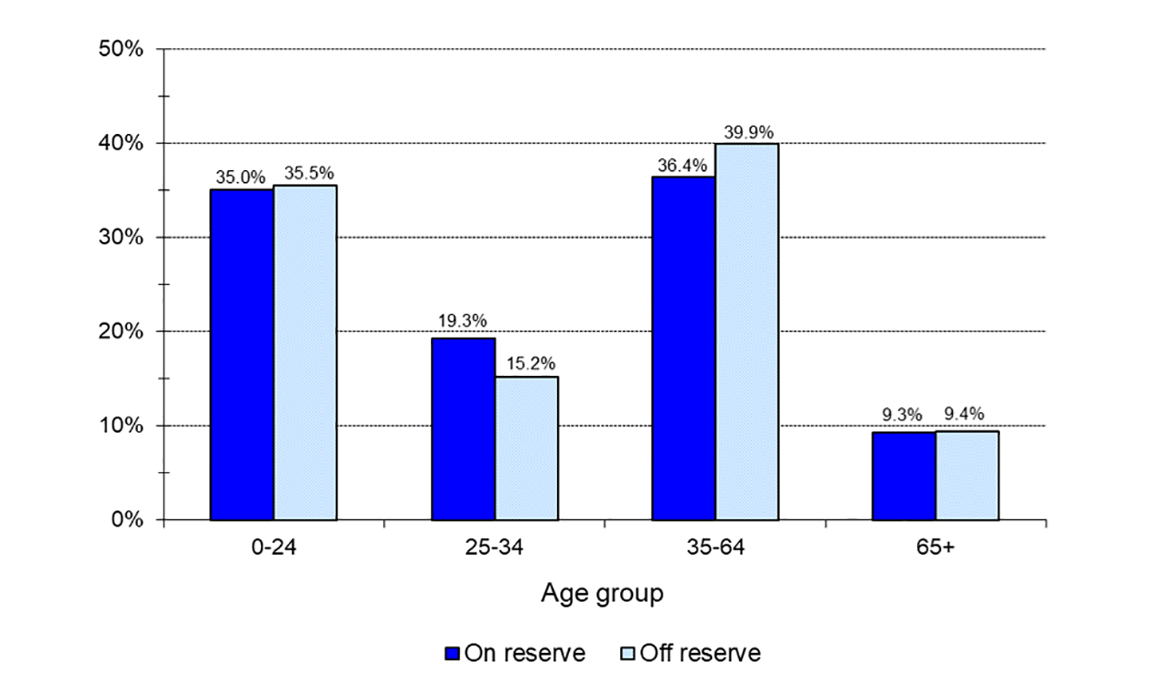
Figure 13 - Registered Indian population, by type of residence and selected age groups, December 31, 2019Description of Figure 13 - Registered Indian population, by type of residence and selected age groups, December 31, 2019
Registered Indian population, by type of residence and selected age groups, December 31, 2019
Age group
Populations
Percentages
On reserve
Off reserve
On reserve
Off reserve
0-24
4,485
2,432
35.0%
35.5%
25-34
2,474
1,040
19.3%
15.2%
35-64
4,661
2,733
36.4%
39.9%
65+
1,192
642
9.3%
9.4%
Canada, all regions
Registered Indian population, by type of residence, age groups and sex, December 31, 2019
Age
On reserve
Off reserve
Total - All residencies
Male
Female
Male
Female
Male
Female
#
%
#
%
#
%
#
%
#
%
#
%
0-4
14,749
2.9
14,057
2.7
7,888
1.6
7,519
1.5
22,637
2.2
21,576
2.1
5-9
24,801
4.8
23,993
4.7
16,195
3.3
15,541
3.2
40,996
4.1
39,534
3.9
10-14
26,539
5.1
25,431
4.9
19,336
3.9
18,659
3.8
45,875
4.5
44,090
4.4
15-19
23,967
4.6
22,780
4.4
18,850
3.8
18,594
3.8
42,817
4.2
41,374
4.1
20-24
24,239
4.7
22,875
4.4
19,768
4.0
19,662
4.0
44,007
4.4
42,537
4.2
25-29
24,837
4.8
23,437
4.5
21,010
4.3
21,037
4.3
45,847
4.5
44,474
4.4
30-34
21,080
4.1
19,658
3.8
19,149
3.9
19,604
4.0
40,229
4.0
39,262
3.9
35-39
17,175
3.3
16,311
3.2
17,213
3.5
18,024
3.7
34,388
3.4
34,335
3.4
40-44
15,038
2.9
14,033
2.7
15,818
3.2
16,943
3.4
30,856
3.1
30,976
3.1
45-49
14,389
2.8
13,839
2.7
16,325
3.3
17,690
3.6
30,714
3.0
31,529
3.1
50-54
14,074
2.7
13,462
2.6
15,923
3.2
18,091
3.7
29,997
3.0
31,553
3.1
55-59
12,699
2.5
12,741
2.5
14,977
3.0
17,990
3.6
27,676
2.7
30,731
3.0
60-64
10,037
1.9
10,363
2.0
11,126
2.3
14,797
3.0
21,163
2.1
25,160
2.5
65 +
18,188
3.5
21,036
4.1
21,347
4.3
34,051
6.9
39,535
3.9
55,087
5.5
All ages
261,812
50.8
254,016
49.2
234,925
47.6
258,202
52.4
496,737
49.2
512,218
50.8
Total - both sexes
515,828
51%
493,127
49%
1,008,955
100%
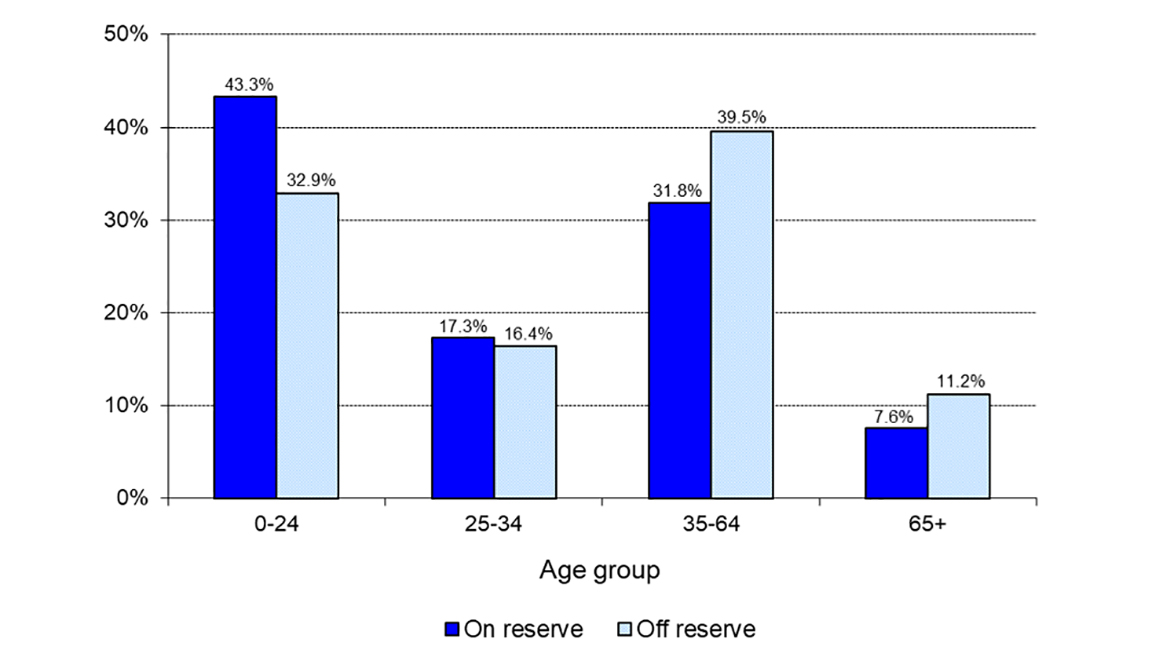
Figure 14 - Registered Indian population, by type of residence and selected age groups, December 31, 2019Description of Figure 14 - Registered Indian population, by type of residence and selected age groups, December 31, 2019
Registered Indian population, by type of residence and selected age groups, December 31, 2019
Age group
Populations
Percentages
On reserve
Off reserve
On reserve
Off reserve
0-24
223,431
162,012
43.3%
32.9%
25-34
89,012
80,800
17.3%
16.4%
35-64
164,161
194,917
31.8%
39.5%
65+
39,224
55,398
7.6%
11.2%
Detailed tables
Registered Indian population by sex and type of residence
by group, responsibility centre and region 2019
Region 2 - Atlantic
Abegweit (001)
Gender
Total (a + b)
On reserve and on Crown land (includes lands affiliated with First Nations operating under self-government agreements) (a)
Off reserve (b)
Total
387
232
155
Male
188
119
69
Female
199
113
86
Acadia (018)
Gender
Total (a + b)
On reserve and on Crown land (includes lands affiliated with First Nations operating under self-government agreements) (a)
Off reserve (b)
Total
1,653
244
1,409
Male
808
115
693
Female
845
129
716
Annapolis Valley (020)
Gender
Total (a + b)
On reserve and on Crown land (includes lands affiliated with First Nations operating under self-government agreements) (a)
Off reserve (b)
Total
301
123
178
Male
139
68
71
Female
162
55
107
Bear River (021)
Gender
Total (a + b)
On reserve and on Crown land (includes lands affiliated with First Nations operating under self-government agreements) (a)
Off reserve (b)
Total
351
114
237
Male
164
50
114
Female
187
64
123
Buctouche MicMac (004)
Gender
Total (a + b)
On reserve and on Crown land (includes lands affiliated with First Nations operating under self-government agreements) (a)
Off reserve (b)
Total
126
84
42
Male
70
51
19
Female
56
33
23
Eel Ground (007)
Gender
Total (a + b)
On reserve and on Crown land (includes lands affiliated with First Nations operating under self-government agreements) (a)
Off reserve (b)
Total
1,068
597
471
Male
527
295
232
Female
541
302
239
Eel River Bar First Nation (008)
Gender
Total (a + b)
On reserve and on Crown land (includes lands affiliated with First Nations operating under self-government agreements) (a)
Off reserve (b)
Total
766
361
405
Male
362
172
190
Female
404
189
215
Elsipogtog First Nation (003)
Gender
Total (a + b)
On reserve and on Crown land (includes lands affiliated with First Nations operating under self-government agreements) (a)
Off reserve (b)
Total
3,451
2,693
758
Male
1,716
1,375
341
Female
1,735
1,318
417
Esgenoopetitj First Nation (005)
Gender
Total (a + b)
On reserve and on Crown land (includes lands affiliated with First Nations operating under self-government agreements) (a)
Off reserve (b)
Total
1,940
1,386
554
Male
944
691
253
Female
996
695
301
Eskasoni (023)
Gender
Total (a + b)
On reserve and on Crown land (includes lands affiliated with First Nations operating under self-government agreements) (a)
Off reserve (b)
Total
4,615
3,960
655
Male
2,255
1,953
302
Female
2,360
2,007
353
Fort Folly (009)
Gender
Total (a + b)
On reserve and on Crown land (includes lands affiliated with First Nations operating under self-government agreements) (a)
Off reserve (b)
Total
133
36
97
Male
57
11
46
Female
76
25
51
Glooscap First Nation (030)
Gender
Total (a + b)
On reserve and on Crown land (includes lands affiliated with First Nations operating under self-government agreements) (a)
Off reserve (b)
Total
391
98
293
Male
174
32
142
Female
217
66
151
Indian Island (010)
Gender
Total (a + b)
On reserve and on Crown land (includes lands affiliated with First Nations operating under self-government agreements) (a)
Off reserve (b)
Total
206
111
95
Male
94
53
41
Female
112
58
54
Kingsclear (011)
Gender
Total (a + b)
On reserve and on Crown land (includes lands affiliated with First Nations operating under self-government agreements) (a)
Off reserve (b)
Total
1,053
742
311
Male
488
343
145
Female
565
399
166
Lennox Island (002)
Gender
Total (a + b)
On reserve and on Crown land (includes lands affiliated with First Nations operating under self-government agreements) (a)
Off reserve (b)
Total
995
403
592
Male
466
202
264
Female
529
201
328
Madawaska Maliseet First Nation (006)
Gender
Total (a + b)
On reserve and on Crown land (includes lands affiliated with First Nations operating under self-government agreements) (a)
Off reserve (b)
Total
374
154
220
Male
191
80
111
Female
183
74
109
Membertou (026)
Gender
Total (a + b)
On reserve and on Crown land (includes lands affiliated with First Nations operating under self-government agreements) (a)
Off reserve (b)
Total
1,571
984
587
Male
798
501
297
Female
773
483
290
Metepenagiag Mi'kmaq Nation (014)
Gender
Total (a + b)
On reserve and on Crown land (includes lands affiliated with First Nations operating under self-government agreements) (a)
Off reserve (b)
Total
696
472
224
Male
336
237
99
Female
360
235
125
Miawpukek (047)
Gender
Total (a + b)
On reserve and on Crown land (includes lands affiliated with First Nations operating under self-government agreements) (a)
Off reserve (b)
Total
3,057
834
2,223
Male
1,555
447
1,108
Female
1,502
387
1,115
Millbrook (027)
Gender
Total (a + b)
On reserve and on Crown land (includes lands affiliated with First Nations operating under self-government agreements) (a)
Off reserve (b)
Total
1,963
950
1,013
Male
964
473
491
Female
999
477
522
Mushuau Innu First Nation (032)
Gender
Total (a + b)
On reserve and on Crown land (includes lands affiliated with First Nations operating under self-government agreements) (a)
Off reserve (b)
Total
1,076
994
82
Male
516
482
34
Female
560
512
48
Oromocto First Nation (012)
Gender
Total (a + b)
On reserve and on Crown land (includes lands affiliated with First Nations operating under self-government agreements) (a)
Off reserve (b)
Total
743
332
411
Male
356
172
184
Female
387
160
227
Pabineau (013)
Gender
Total (a + b)
On reserve and on Crown land (includes lands affiliated with First Nations operating under self-government agreements) (a)
Off reserve (b)
Total
326
106
220
Male
171
58
113
Female
155
48
107
Paqtnkek Mi'kmaw Nation (019)
Gender
Total (a + b)
On reserve and on Crown land (includes lands affiliated with First Nations operating under self-government agreements) (a)
Off reserve (b)
Total
598
455
143
Male
269
207
62
Female
329
248
81
Pictou Landing (024)
Gender
Total (a + b)
On reserve and on Crown land (includes lands affiliated with First Nations operating under self-government agreements) (a)
Off reserve (b)
Total
671
512
159
Male
334
251
83
Female
337
261
76
Potlotek First Nation (022)
Gender
Total (a + b)
On reserve and on Crown land (includes lands affiliated with First Nations operating under self-government agreements) (a)
Off reserve (b)
Total
770
623
147
Male
381
316
65
Female
389
307
82
Qalipu Mi'kmaq First Nation (034)
Gender
Total (a + b)
On reserve and on Crown land (includes lands affiliated with First Nations operating under self-government agreements) (a)
Off reserve (b)
Total
22,970
13
22,957
Male
11,357
*
*
Female
11,613
*
*
* Data Suppressed due to low counts
Saint Mary's (015)
Gender
Total (a + b)
On reserve and on Crown land (includes lands affiliated with First Nations operating under self-government agreements) (a)
Off reserve (b)
Total
1,961
926
1,035
Male
918
446
472
Female
1,043
480
563
Sheshatshiu Innu First Nation (033)
Gender
Total (a + b)
On reserve and on Crown land (includes lands affiliated with First Nations operating under self-government agreements) (a)
Off reserve (b)
Total
1,803
1,624
179
Male
888
820
68
Female
915
804
111
Sipekne'katik (025)
Gender
Total (a + b)
On reserve and on Crown land (includes lands affiliated with First Nations operating under self-government agreements) (a)
Off reserve (b)
Total
2,761
1,399
1,362
Male
1,314
663
651
Female
1,447
736
711
Tobique (016)
Gender
Total (a + b)
On reserve and on Crown land (includes lands affiliated with First Nations operating under self-government agreements) (a)
Off reserve (b)
Total
2,544
1,589
955
Male
1,244
790
454
Female
1,300
799
501
Wagmatcook (028)
Gender
Total (a + b)
On reserve and on Crown land (includes lands affiliated with First Nations operating under self-government agreements) (a)
Off reserve (b)
Total
898
705
193
Male
434
352
82
Female
464
353
111
We'koqma'q First Nation (029)
Gender
Total (a + b)
On reserve and on Crown land (includes lands affiliated with First Nations operating under self-government agreements) (a)
Off reserve (b)
Total
1,026
944
82
Male
503
469
34
Female
523
475
48
Woodstock (017)
Gender
Total (a + b)
On reserve and on Crown land (includes lands affiliated with First Nations operating under self-government agreements) (a)
Off reserve (b)
Total
1,122
300
822
Male
537
179
358
Female
585
121
464
General list - Atlantic region (810)
Gender
Total (a + b)
On reserve and on Crown land (includes lands affiliated with First Nations operating under self-government agreements) (a)
Off reserve (b)
Total
358
0
358
Male
172
0
172
Female
186
0
186
Atlantic region - 2
Gender
Total (a + b)
On reserve and on Crown land (includes lands affiliated with First Nations operating under self-government agreements) (a)
Off reserve (b)
Total
64,724
25,100
39,624
Male
31,690
12,480
19,210
Female
33,034
12,620
20,414
Region 3 - Quebec
Quebec District
Algonquins of Barriere Lake (074)
Gender
Total (a + b)
On reserve and on Crown land (includes lands affiliated with First Nations operating under self-government agreements) (a)
Off reserve (b)
Total
794
622
172
Male
397
316
81
Female
397
306
91
Bande des Innus de Pessamit (085)
Gender
Total (a + b)
On reserve and on Crown land (includes lands affiliated with First Nations operating under self-government agreements) (a)
Off reserve (b)
Total
4,020
2,906
1,114
Male
1,903
1,404
499
Female
2,117
1,502
615
Communauté anicinape de Kitcisakik (062)
Gender
Total (a + b)
On reserve and on Crown land (includes lands affiliated with First Nations operating under self-government agreements) (a)
Off reserve (b)
Total
519
405
114
Male
257
202
55
Female
262
203
59
Conseil de la Première Nation Abitibiwinni (055)
Gender
Total (a + b)
On reserve and on Crown land (includes lands affiliated with First Nations operating under self-government agreements) (a)
Off reserve (b)
Total
1,080
617
463
Male
516
284
232
Female
564
333
231
Cree Nation of Chisasibi (058)
Gender
Total (a + b)
On reserve and on Crown land (includes lands affiliated with First Nations operating under self-government agreements) (a)
Off reserve (b)
Total
4,798
4,622
176
Male
2,395
2,323
72
Female
2,403
2,299
104
Cree Nation of Mistissini (075)
Gender
Total (a + b)
On reserve and on Crown land (includes lands affiliated with First Nations operating under self-government agreements) (a)
Off reserve (b)
Total
4,119
3,872
247
Male
2,047
1,931
116
Female
2,072
1,941
131
Cree Nation of Nemaska (059)
Gender
Total (a + b)
On reserve and on Crown land (includes lands affiliated with First Nations operating under self-government agreements) (a)
Off reserve (b)
Total
829
805
24
Male
416
*
*
Female
413
*
*
* Data Suppressed due to low counts
Cree Nation of Wemindji (060)
Gender
Total (a + b)
On reserve and on Crown land (includes lands affiliated with First Nations operating under self-government agreements) (a)
Off reserve (b)
Total
1,651
1,511
140
Male
804
742
62
Female
847
769
78
Eagle Village First Nation - Kipawa (065)
Gender
Total (a + b)
On reserve and on Crown land (includes lands affiliated with First Nations operating under self-government agreements) (a)
Off reserve (b)
Total
1,038
295
743
Male
507
149
358
Female
531
146
385
Eastmain (057)
Gender
Total (a + b)
On reserve and on Crown land (includes lands affiliated with First Nations operating under self-government agreements) (a)
Off reserve (b)
Total
923
874
49
Male
470
449
21
Female
453
425
28
Innu Takuaikan Uashat Mak Mani-Utenam (080)
Gender
Total (a + b)
On reserve and on Crown land (includes lands affiliated with First Nations operating under self-government agreements) (a)
Off reserve (b)
Total
4,782
3,659
1,123
Male
2,352
1,822
530
Female
2,430
1,837
593
Innue Essipit (086)
Gender
Total (a + b)
On reserve and on Crown land (includes lands affiliated with First Nations operating under self-government agreements) (a)
Off reserve (b)
Total
832
206
626
Male
403
110
293
Female
429
96
333
Kitigan Zibi Anishinabeg (073)
Gender
Total (a + b)
On reserve and on Crown land (includes lands affiliated with First Nations operating under self-government agreements) (a)
Off reserve (b)
Total
3,490
1,647
1,843
Male
1,664
824
840
Female
1,826
823
1,003
La Nation Innu Matimekush-Lac John (087)
Gender
Total (a + b)
On reserve and on Crown land (includes lands affiliated with First Nations operating under self-government agreements) (a)
Off reserve (b)
Total
1,037
910
127
Male
520
453
67
Female
517
457
60
La Nation Micmac de Gespeg (053)
Gender
Total (a + b)
On reserve and on Crown land (includes lands affiliated with First Nations operating under self-government agreements) (a)
Off reserve (b)
Total
1,036
0
1,036
Male
505
0
505
Female
531
0
531
Les Innus de Ekuanitshit (082)
Gender
Total (a + b)
On reserve and on Crown land (includes lands affiliated with First Nations operating under self-government agreements) (a)
Off reserve (b)
Total
680
639
41
Male
323
303
20
Female
357
336
21
Listuguj Mi'gmaq Government (051)
Gender
Total (a + b)
On reserve and on Crown land (includes lands affiliated with First Nations operating under self-government agreements) (a)
Off reserve (b)
Total
4,129
2,129
2,000
Male
1,976
1,077
899
Female
2,153
1,052
1,101
Long Point First Nation (067)
Gender
Total (a + b)
On reserve and on Crown land (includes lands affiliated with First Nations operating under self-government agreements) (a)
Off reserve (b)
Total
919
520
399
Male
452
261
191
Female
467
259
208
Micmacs of Gesgapegiag (052)
Gender
Total (a + b)
On reserve and on Crown land (includes lands affiliated with First Nations operating under self-government agreements) (a)
Off reserve (b)
Total
1,578
721
857
Male
774
379
395
Female
804
342
462
Montagnais de Pakua Shipi (088)
Gender
Total (a + b)
On reserve and on Crown land (includes lands affiliated with First Nations operating under self-government agreements) (a)
Off reserve (b)
Total
394
*
*
Male
206
*
*
Female
188
*
*
* Data Suppressed due to low counts
Montagnais de Unamen Shipu (084)
Gender
Total (a + b)
On reserve and on Crown land (includes lands affiliated with First Nations operating under self-government agreements) (a)
Off reserve (b)
Total
1,226
1,168
58
Male
628
599
29
Female
598
569
29
Naskapi Nation of Kawawachikamach (081)
Gender
Total (a + b)
On reserve and on Crown land (includes lands affiliated with First Nations operating under self-government agreements) (a)
Off reserve (b)
Total
796
725
71
Male
401
368
33
Female
395
357
38
Nation Anishnabe du Lac Simon (063)
Gender
Total (a + b)
On reserve and on Crown land (includes lands affiliated with First Nations operating under self-government agreements) (a)
Off reserve (b)
Total
2,255
1,831
424
Male
1,123
927
196
Female
1,132
904
228
Nation Huronne Wendat (050)
Gender
Total (a + b)
On reserve and on Crown land (includes lands affiliated with First Nations operating under self-government agreements) (a)
Off reserve (b)
Total
4,124
1,503
2,621
Male
1,954
734
1,220
Female
2,170
769
1,401
Odanak (072)
Gender
Total (a + b)
On reserve and on Crown land (includes lands affiliated with First Nations operating under self-government agreements) (a)
Off reserve (b)
Total
2,580
294
2,286
Male
1,204
144
1,060
Female
1,376
150
1,226
Oujé-Bougoumou Cree Nation (089)
Gender
Total (a + b)
On reserve and on Crown land (includes lands affiliated with First Nations operating under self-government agreements) (a)
Off reserve (b)
Total
936
808
128
Male
459
408
51
Female
477
400
77
Première Nation de Whapmagoostui (095)
Gender
Total (a + b)
On reserve and on Crown land (includes lands affiliated with First Nations operating under self-government agreements) (a)
Off reserve (b)
Total
1,023
939
84
Male
525
480
45
Female
498
459
39
Première Nation des Abénakis de Wôlinak (071)
Gender
Total (a + b)
On reserve and on Crown land (includes lands affiliated with First Nations operating under self-government agreements) (a)
Off reserve (b)
Total
507
110
397
Male
226
45
181
Female
281
65
216
Première Nation des Innus de Nutashkuan (083)
Gender
Total (a + b)
On reserve and on Crown land (includes lands affiliated with First Nations operating under self-government agreements) (a)
Off reserve (b)
Total
1,217
1,115
102
Male
617
579
38
Female
600
536
64
Première Nation Wolastoqiyik (Malécite) Wahsipekuk (054)
Gender
Total (a + b)
On reserve and on Crown land (includes lands affiliated with First Nations operating under self-government agreements) (a)
Off reserve (b)
Total
1,244
*
*
Male
602
*
*
Female
642
0
642
* Data Suppressed due to low counts
The Crees of the Waskaganish First Nation (061)
Gender
Total (a + b)
On reserve and on Crown land (includes lands affiliated with First Nations operating under self-government agreements) (a)
Off reserve (b)
Total
2,908
2,449
459
Male
1,458
1,227
231
Female
1,450
1,222
228
Timiskaming First Nation (064)
Gender
Total (a + b)
On reserve and on Crown land (includes lands affiliated with First Nations operating under self-government agreements) (a)
Off reserve (b)
Total
2,270
661
1,609
Male
1,060
333
727
Female
1,210
328
882
Waswanipi (056)
Gender
Total (a + b)
On reserve and on Crown land (includes lands affiliated with First Nations operating under self-government agreements) (a)
Off reserve (b)
Total
2,287
1,805
482
Male
1,156
948
208
Female
1,131
857
274
Wolf Lake (068)
Gender
Total (a + b)
On reserve and on Crown land (includes lands affiliated with First Nations operating under self-government agreements) (a)
Off reserve (b)
Total
242
*
*
Male
120
*
*
Female
122
*
*
* Data Suppressed due to low counts
General list - Quebec region - Quebec District (816)
Gender
Total (a + b)
On reserve and on Crown land (includes lands affiliated with First Nations operating under self-government agreements) (a)
Off reserve (b)
Total
187
0
187
Male
90
0
90
Female
97
0
97
Responsibility Centre Quebec District
Gender
Total (a + b)
On reserve and on Crown land (includes lands affiliated with First Nations operating under self-government agreements) (a)
Off reserve (b)
Total
62,450
40,760
21,690
Male
30,510
20,428
10,082
Female
31,940
20,332
11,608
Montreal District
Mohawks of Kahnawá:ke (070)
Gender
Total (a + b)
On reserve and on Crown land (includes lands affiliated with First Nations operating under self-government agreements) (a)
Off reserve (b)
Total
11,129
7,960
3,169
Male
5,387
3,914
1,473
Female
5,742
4,046
1,696
Mohawks of Kanesatake (069)
Gender
Total (a + b)
On reserve and on Crown land (includes lands affiliated with First Nations operating under self-government agreements) (a)
Off reserve (b)
Total
2,613
1,404
1,209
Male
1,220
661
559
Female
1,393
743
650
Responsibility Centre Montreal District
Gender
Total (a + b)
On reserve and on Crown land (includes lands affiliated with First Nations operating under self-government agreements) (a)
Off reserve (b)
Total
13,742
9,364
4,378
Male
6,607
4,575
2,032
Female
7,135
4,789
2,346
Pointe-Bleue District
Atikamekw d'Opitciwan (079)
Gender
Total (a + b)
On reserve and on Crown land (includes lands affiliated with First Nations operating under self-government agreements) (a)
Off reserve (b)
Total
3,104
2,538
566
Male
1,658
1,398
260
Female
1,446
1,140
306
Conseil des Atikamekw de Wemotaci (077)
Gender
Total (a + b)
On reserve and on Crown land (includes lands affiliated with First Nations operating under self-government agreements) (a)
Off reserve (b)
Total
2,020
1,534
486
Male
1,027
791
236
Female
993
743
250
Les Atikamekw de Manawan (078)
Gender
Total (a + b)
On reserve and on Crown land (includes lands affiliated with First Nations operating under self-government agreements) (a)
Off reserve (b)
Total
3,024
2,586
438
Male
1,502
1,317
185
Female
1,522
1,269
253
Première Nation des Pekuakamiulnuatsh (076)
Gender
Total (a + b)
On reserve and on Crown land (includes lands affiliated with First Nations operating under self-government agreements) (a)
Off reserve (b)
Total
6,953
2,121
4,832
Male
3,393
1,078
2,315
Female
3,560
1,043
2,517
Responsibility Centre Pointe-Bleue District
Gender
Total (a + b)
On reserve and on Crown land (includes lands affiliated with First Nations operating under self-government agreements) (a)
Off reserve (b)
Total
15,101
8,779
6,322
Male
7,580
4,584
2,996
Female
7,521
4,195
3,326
Quebec region - 3
Gender
Total (a + b)
On reserve and on Crown land (includes lands affiliated with First Nations operating under self-government agreements) (a)
Off reserve (b)
Total
91,293
58,903
32,390
Male
44,697
29,587
15,110
Female
46,596
29,316
17,280
Region 4 - Ontario
Sudbury District
Atikameksheng Anishnawbek (224)
Gender
Total (a + b)
On reserve and on Crown land (includes lands affiliated with First Nations operating under self-government agreements) (a)
Off reserve (b)
Total
1,318
434
884
Male
623
209
414
Female
695
225
470
Aundeck-Omni-Kaning (180)
Gender
Total (a + b)
On reserve and on Crown land (includes lands affiliated with First Nations operating under self-government agreements) (a)
Off reserve (b)
Total
863
388
475
Male
421
205
216
Female
442
183
259
Batchewana First Nation (198)
Gender
Total (a + b)
On reserve and on Crown land (includes lands affiliated with First Nations operating under self-government agreements) (a)
Off reserve (b)
Total
2,993
847
2,146
Male
1,402
410
992
Female
1,591
437
1,154
Dokis (218)
Gender
Total (a + b)
On reserve and on Crown land (includes lands affiliated with First Nations operating under self-government agreements) (a)
Off reserve (b)
Total
1,265
206
1,059
Male
636
108
528
Female
629
98
531
Garden River First Nation (199)
Gender
Total (a + b)
On reserve and on Crown land (includes lands affiliated with First Nations operating under self-government agreements) (a)
Off reserve (b)
Total
3,055
1,353
1,702
Male
1,457
675
782
Female
1,598
678
920
Henvey Inlet First Nation (231)
Gender
Total (a + b)
On reserve and on Crown land (includes lands affiliated with First Nations operating under self-government agreements) (a)
Off reserve (b)
Total
893
196
697
Male
449
100
349
Female
444
96
348
Magnetawan (174)
Gender
Total (a + b)
On reserve and on Crown land (includes lands affiliated with First Nations operating under self-government agreements) (a)
Off reserve (b)
Total
275
81
194
Male
135
47
88
Female
140
34
106
M'Chigeeng First Nation (181)
Gender
Total (a + b)
On reserve and on Crown land (includes lands affiliated with First Nations operating under self-government agreements) (a)
Off reserve (b)
Total
2,643
977
1,666
Male
1,281
495
786
Female
1,362
482
880
Mississauga (200)
Gender
Total (a + b)
On reserve and on Crown land (includes lands affiliated with First Nations operating under self-government agreements) (a)
Off reserve (b)
Total
1,376
397
979
Male
669
191
478
Female
707
206
501
Nipissing First Nation (220)
Gender
Total (a + b)
On reserve and on Crown land (includes lands affiliated with First Nations operating under self-government agreements) (a)
Off reserve (b)
Total
2,849
1,015
1,834
Male
1,376
513
863
Female
1,473
502
971
Sagamok Anishnawbek (179)
Gender
Total (a + b)
On reserve and on Crown land (includes lands affiliated with First Nations operating under self-government agreements) (a)
Off reserve (b)
Total
3,038
1,636
1,402
Male
1,498
852
646
Female
1,540
784
756
Serpent River (201)
Gender
Total (a + b)
On reserve and on Crown land (includes lands affiliated with First Nations operating under self-government agreements) (a)
Off reserve (b)
Total
1,450
403
1,047
Male
685
192
493
Female
765
211
554
Shawanaga First Nation (137)
Gender
Total (a + b)
On reserve and on Crown land (includes lands affiliated with First Nations operating under self-government agreements) (a)
Off reserve (b)
Total
692
185
507
Male
320
85
235
Female
372
100
272
Sheguiandah (176)
Gender
Total (a + b)
On reserve and on Crown land (includes lands affiliated with First Nations operating under self-government agreements) (a)
Off reserve (b)
Total
444
182
262
Male
213
92
121
Female
231
90
141
Sheshegwaning (178)
Gender
Total (a + b)
On reserve and on Crown land (includes lands affiliated with First Nations operating under self-government agreements) (a)
Off reserve (b)
Total
446
122
324
Male
211
56
155
Female
235
66
169
Temagami First Nation (222)
Gender
Total (a + b)
On reserve and on Crown land (includes lands affiliated with First Nations operating under self-government agreements) (a)
Off reserve (b)
Total
904
274
630
Male
437
142
295
Female
467
132
335
Thessalon (202)
Gender
Total (a + b)
On reserve and on Crown land (includes lands affiliated with First Nations operating under self-government agreements) (a)
Off reserve (b)
Total
829
115
714
Male
394
61
333
Female
435
54
381
Wahnapitae (232)
Gender
Total (a + b)
On reserve and on Crown land (includes lands affiliated with First Nations operating under self-government agreements) (a)
Off reserve (b)
Total
543
59
484
Male
248
32
216
Female
295
27
268
Whitefish River (230)
Gender
Total (a + b)
On reserve and on Crown land (includes lands affiliated with First Nations operating under self-government agreements) (a)
Off reserve (b)
Total
1,396
449
947
Male
676
224
452
Female
720
225
495
Wikwemikong (175)
Gender
Total (a + b)
On reserve and on Crown land (includes lands affiliated with First Nations operating under self-government agreements) (a)
Off reserve (b)
Total
8,313
3,292
5,021
Male
3,961
1,645
2,316
Female
4,352
1,647
2,705
Zhiibaahaasing First Nation (173)
Gender
Total (a + b)
On reserve and on Crown land (includes lands affiliated with First Nations operating under self-government agreements) (a)
Off reserve (b)
Total
177
66
111
Male
85
33
52
Female
92
33
59
General list - Ontario region - Sudbury District (817)
Gender
Total (a + b)
On reserve and on Crown land (includes lands affiliated with First Nations operating under self-government agreements) (a)
Off reserve (b)
Total
395
0
395
Male
176
0
176
Female
219
0
219
Responsibility Centre Sudbury District
Gender
Total (a + b)
On reserve and on Crown land (includes lands affiliated with First Nations operating under self-government agreements) (a)
Off reserve (b)
Total
36,157
12,677
23,480
Male
17,353
6,367
10,986
Female
18,804
6,310
12,494
Southern District
Aamjiwnaang (172)
Gender
Total (a + b)
On reserve and on Crown land (includes lands affiliated with First Nations operating under self-government agreements) (a)
Off reserve (b)
Total
2,461
982
1,479
Male
1,170
485
685
Female
1,291
497
794
Alderville First Nation (160)
Gender
Total (a + b)
On reserve and on Crown land (includes lands affiliated with First Nations operating under self-government agreements) (a)
Off reserve (b)
Total
1,216
320
896
Male
580
150
430
Female
636
170
466
Algonquins of Pikwakanagan First Nation (163)
Gender
Total (a + b)
On reserve and on Crown land (includes lands affiliated with First Nations operating under self-government agreements) (a)
Off reserve (b)
Total
2,856
457
2,399
Male
1,367
226
1,141
Female
1,489
231
1,258
Bay of Quinte Mohawk (244) - Six Nations of the Grand River
Gender
Total (a + b)
On reserve and on Crown land (includes lands affiliated with First Nations operating under self-government agreements) (a)
Off reserve (b)
Total
816
369
447
Male
385
179
206
Female
431
190
241
Bearfoot Onondaga (248) - Six Nations of the Grand River
Gender
Total (a + b)
On reserve and on Crown land (includes lands affiliated with First Nations operating under self-government agreements) (a)
Off reserve (b)
Total
669
254
415
Male
320
128
192
Female
349
126
223
Beausoleil (141)
Gender
Total (a + b)
On reserve and on Crown land (includes lands affiliated with First Nations operating under self-government agreements) (a)
Off reserve (b)
Total
2,740
684
2,056
Male
1,305
332
973
Female
1,435
352
1,083
Caldwell (165)
Gender
Total (a + b)
On reserve and on Crown land (includes lands affiliated with First Nations operating under self-government agreements) (a)
Off reserve (b)
Total
412
*
*
Male
187
0
187
Female
225
*
*
* Data Suppressed due to low counts
Chippewas of Georgina Island (138)
Gender
Total (a + b)
On reserve and on Crown land (includes lands affiliated with First Nations operating under self-government agreements) (a)
Off reserve (b)
Total
920
209
711
Male
444
96
348
Female
476
113
363
Chippewas of Kettle and Stony Point (171)
Gender
Total (a + b)
On reserve and on Crown land (includes lands affiliated with First Nations operating under self-government agreements) (a)
Off reserve (b)
Total
2,536
1,379
1,157
Male
1,235
714
521
Female
1,301
665
636
Chippewas of Nawash First Nation (122)
Gender
Total (a + b)
On reserve and on Crown land (includes lands affiliated with First Nations operating under self-government agreements) (a)
Off reserve (b)
Total
2,743
756
1,987
Male
1,315
367
948
Female
1,428
389
1,039
Chippewas of Rama First Nation (139)
Gender
Total (a + b)
On reserve and on Crown land (includes lands affiliated with First Nations operating under self-government agreements) (a)
Off reserve (b)
Total
1,974
743
1,231
Male
982
379
603
Female
992
364
628
Chippewas of the Thames First Nation (166)
Gender
Total (a + b)
On reserve and on Crown land (includes lands affiliated with First Nations operating under self-government agreements) (a)
Off reserve (b)
Total
2,960
1,005
1,955
Male
1,394
503
891
Female
1,566
502
1,064
Curve Lake (161)
Gender
Total (a + b)
On reserve and on Crown land (includes lands affiliated with First Nations operating under self-government agreements) (a)
Off reserve (b)
Total
2,444
804
1,640
Male
1,174
400
774
Female
1,270
404
866
Delaware (253) - Six Nations of the Grand River
Gender
Total (a + b)
On reserve and on Crown land (includes lands affiliated with First Nations operating under self-government agreements) (a)
Off reserve (b)
Total
714
241
473
Male
334
118
216
Female
380
123
257
Hiawatha First Nation (162)
Gender
Total (a + b)
On reserve and on Crown land (includes lands affiliated with First Nations operating under self-government agreements) (a)
Off reserve (b)
Total
704
206
498
Male
315
90
225
Female
389
116
273
Konadaha Seneca (251) - Six Nations of the Grand River
Gender
Total (a + b)
On reserve and on Crown land (includes lands affiliated with First Nations operating under self-government agreements) (a)
Off reserve (b)
Total
587
211
376
Male
265
102
163
Female
322
109
213
Lower Cayuga (250) - Six Nations of the Grand River
Gender
Total (a + b)
On reserve and on Crown land (includes lands affiliated with First Nations operating under self-government agreements) (a)
Off reserve (b)
Total
3,821
2,406
1,415
Male
1,840
1,201
639
Female
1,981
1,205
776
Lower Mohawk (254) - Six Nations of the Grand River
Gender
Total (a + b)
On reserve and on Crown land (includes lands affiliated with First Nations operating under self-government agreements) (a)
Off reserve (b)
Total
4,300
2,146
2,154
Male
2,071
1,070
1,001
Female
2,229
1,076
1,153
Mississaugas of Scugog Island First Nation (140)
Gender
Total (a + b)
On reserve and on Crown land (includes lands affiliated with First Nations operating under self-government agreements) (a)
Off reserve (b)
Total
240
53
187
Male
120
29
91
Female
120
24
96
Mississaugas of the Credit (120)
Gender
Total (a + b)
On reserve and on Crown land (includes lands affiliated with First Nations operating under self-government agreements) (a)
Off reserve (b)
Total
2,591
1,001
1,590
Male
1,238
475
763
Female
1,353
526
827
Mohawks of Akwesasne (159)
Gender
Total (a + b)
On reserve and on Crown land (includes lands affiliated with First Nations operating under self-government agreements) (a)
Off reserve (b)
Total
12,834
10,039
2,795
Male
6,220
4,897
1,323
Female
6,614
5,142
1,472
Mohawks of the Bay of Quinte (164)
Gender
Total (a + b)
On reserve and on Crown land (includes lands affiliated with First Nations operating under self-government agreements) (a)
Off reserve (b)
Total
10,013
2,188
7,825
Male
4,747
1,056
3,691
Female
5,266
1,132
4,134
Moose Deer Point (135)
Gender
Total (a + b)
On reserve and on Crown land (includes lands affiliated with First Nations operating under self-government agreements) (a)
Off reserve (b)
Total
502
141
361
Male
235
64
171
Female
267
77
190
Moravian of the Thames (167)
Gender
Total (a + b)
On reserve and on Crown land (includes lands affiliated with First Nations operating under self-government agreements) (a)
Off reserve (b)
Total
1,312
604
708
Male
612
304
308
Female
700
300
400
Munsee-Delaware Nation (168)
Gender
Total (a + b)
On reserve and on Crown land (includes lands affiliated with First Nations operating under self-government agreements) (a)
Off reserve (b)
Total
673
186
487
Male
323
94
229
Female
350
92
258
Niharondasa Seneca (252) - Six Nations of the Grand River
Gender
Total (a + b)
On reserve and on Crown land (includes lands affiliated with First Nations operating under self-government agreements) (a)
Off reserve (b)
Total
402
179
223
Male
193
89
104
Female
209
90
119
Oneida (246) - Six Nations of the Grand River
Gender
Total (a + b)
On reserve and on Crown land (includes lands affiliated with First Nations operating under self-government agreements) (a)
Off reserve (b)
Total
2,152
782
1,370
Male
1,016
388
628
Female
1,136
394
742
Oneida Nation of the Thames (169)
Gender
Total (a + b)
On reserve and on Crown land (includes lands affiliated with First Nations operating under self-government agreements) (a)
Off reserve (b)
Total
6,297
2,223
4,074
Male
2,992
1,101
1,891
Female
3,305
1,122
2,183
Onondaga Clear Sky (247) - Six Nations of the Grand River
Gender
Total (a + b)
On reserve and on Crown land (includes lands affiliated with First Nations operating under self-government agreements) (a)
Off reserve (b)
Total
851
455
396
Male
415
221
194
Female
436
234
202
Saugeen (123)
Gender
Total (a + b)
On reserve and on Crown land (includes lands affiliated with First Nations operating under self-government agreements) (a)
Off reserve (b)
Total
1,910
851
1,059
Male
940
429
511
Female
970
422
548
Tuscarora (245) - Six Nations of the Grand River
Gender
Total (a + b)
On reserve and on Crown land (includes lands affiliated with First Nations operating under self-government agreements) (a)
Off reserve (b)
Total
2,329
995
1,334
Male
1,125
506
619
Female
1,204
489
715
Upper Cayuga (249) - Six Nations of the Grand River
Gender
Total (a + b)
On reserve and on Crown land (includes lands affiliated with First Nations operating under self-government agreements) (a)
Off reserve (b)
Total
3,838
1,533
2,305
Male
1,880
791
1,089
Female
1,958
742
1,216
Upper Mohawk (257) - Six Nations of the Grand River
Gender
Total (a + b)
On reserve and on Crown land (includes lands affiliated with First Nations operating under self-government agreements) (a)
Off reserve (b)
Total
6,574
3,007
3,567
Male
3,097
1,506
1,591
Female
3,477
1,501
1,976
Wahta Mohawk (134)
Gender
Total (a + b)
On reserve and on Crown land (includes lands affiliated with First Nations operating under self-government agreements) (a)
Off reserve (b)
Total
854
154
700
Male
406
86
320
Female
448
68
380
Walker Mohawk (255) - Six Nations of the Grand River
Gender
Total (a + b)
On reserve and on Crown land (includes lands affiliated with First Nations operating under self-government agreements) (a)
Off reserve (b)
Total
506
314
192
Male
247
156
91
Female
259
158
101
Walpole Island (170)
Gender
Total (a + b)
On reserve and on Crown land (includes lands affiliated with First Nations operating under self-government agreements) (a)
Off reserve (b)
Total
4,963
2,394
2,569
Male
2,429
1,230
1,199
Female
2,534
1,164
1,370
Wasauksing First Nation (136)
Gender
Total (a + b)
On reserve and on Crown land (includes lands affiliated with First Nations operating under self-government agreements) (a)
Off reserve (b)
Total
1,325
420
905
Male
642
216
426
Female
683
204
479
General list - Ontario region - Southern District (821)
Gender
Total (a + b)
On reserve and on Crown land (includes lands affiliated with First Nations operating under self-government agreements) (a)
Off reserve (b)
Total
*
*
*
Male
*
*
*
Female
*
*
*
* Data Suppressed due to low counts
Responsibility Centre Southern District
Gender
Total (a + b)
On reserve and on Crown land (includes lands affiliated with First Nations operating under self-government agreements) (a)
Off reserve (b)
Total
95,046
40,697
54,349
Male
45,563
20,179
25,384
Female
49,483
20,518
28,965
Western District
Albany (142)
Gender
Total (a + b)
On reserve and on Crown land (includes lands affiliated with First Nations operating under self-government agreements) (a)
Off reserve (b)
Total
5,211
3,321
1,890
Male
2,605
1,680
925
Female
2,606
1,641
965
Animakee Wa Zhing #37 (152)
Gender
Total (a + b)
On reserve and on Crown land (includes lands affiliated with First Nations operating under self-government agreements) (a)
Off reserve (b)
Total
450
197
253
Male
222
94
128
Female
228
103
125
Animbiigoo Zaagi'igan Anishinaabek (194)
Gender
Total (a + b)
On reserve and on Crown land (includes lands affiliated with First Nations operating under self-government agreements) (a)
Off reserve (b)
Total
510
90
420
Male
249
49
200
Female
261
41
220
Anishinabe of Wauzhushk Onigum (153)
Gender
Total (a + b)
On reserve and on Crown land (includes lands affiliated with First Nations operating under self-government agreements) (a)
Off reserve (b)
Total
793
390
403
Male
393
210
183
Female
400
180
220
Anishnaabeg of Naongashiing (125)
Gender
Total (a + b)
On reserve and on Crown land (includes lands affiliated with First Nations operating under self-government agreements) (a)
Off reserve (b)
Total
429
207
222
Male
210
103
107
Female
219
104
115
Aroland (242)
Gender
Total (a + b)
On reserve and on Crown land (includes lands affiliated with First Nations operating under self-government agreements) (a)
Off reserve (b)
Total
735
420
315
Male
380
224
156
Female
355
196
159
Attawapiskat (143)
Gender
Total (a + b)
On reserve and on Crown land (includes lands affiliated with First Nations operating under self-government agreements) (a)
Off reserve (b)
Total
3,673
2,102
1,571
Male
1,804
1,079
725
Female
1,869
1,023
846
Big Grassy (124)
Gender
Total (a + b)
On reserve and on Crown land (includes lands affiliated with First Nations operating under self-government agreements) (a)
Off reserve (b)
Total
815
301
514
Male
394
161
233
Female
421
140
281
Biigtigong Nishnaabeg (192)
Gender
Total (a + b)
On reserve and on Crown land (includes lands affiliated with First Nations operating under self-government agreements) (a)
Off reserve (b)
Total
1,208
541
667
Male
582
258
324
Female
626
283
343
Biinjitiwaabik Zaaging Anishinaabek (197)
Gender
Total (a + b)
On reserve and on Crown land (includes lands affiliated with First Nations operating under self-government agreements) (a)
Off reserve (b)
Total
766
338
428
Male
375
173
202
Female
391
165
226
Bingwi Neyaashi Anishinaabek (196)
Gender
Total (a + b)
On reserve and on Crown land (includes lands affiliated with First Nations operating under self-government agreements) (a)
Off reserve (b)
Total
310
82
228
Male
161
44
117
Female
149
38
111
Brunswick House (228)
Gender
Total (a + b)
On reserve and on Crown land (includes lands affiliated with First Nations operating under self-government agreements) (a)
Off reserve (b)
Total
852
220
632
Male
431
118
313
Female
421
102
319
Chapleau Cree First Nation (221)
Gender
Total (a + b)
On reserve and on Crown land (includes lands affiliated with First Nations operating under self-government agreements) (a)
Off reserve (b)
Total
505
61
444
Male
276
32
244
Female
229
29
200
Chapleau Ojibway (229)
Gender
Total (a + b)
On reserve and on Crown land (includes lands affiliated with First Nations operating under self-government agreements) (a)
Off reserve (b)
Total
40
*
*
Male
20
*
*
Female
20
*
*
* Data Suppressed due to low counts
Constance Lake (182)
Gender
Total (a + b)
On reserve and on Crown land (includes lands affiliated with First Nations operating under self-government agreements) (a)
Off reserve (b)
Total
1,772
900
872
Male
899
472
427
Female
873
428
445
Couchiching First Nation (126)
Gender
Total (a + b)
On reserve and on Crown land (includes lands affiliated with First Nations operating under self-government agreements) (a)
Off reserve (b)
Total
2,648
764
1,884
Male
1,281
382
899
Female
1,367
382
985
Eabametoong First Nation (183)
Gender
Total (a + b)
On reserve and on Crown land (includes lands affiliated with First Nations operating under self-government agreements) (a)
Off reserve (b)
Total
2,721
1,614
1,107
Male
1,420
880
540
Female
1,301
734
567
Eagle Lake (148)
Gender
Total (a + b)
On reserve and on Crown land (includes lands affiliated with First Nations operating under self-government agreements) (a)
Off reserve (b)
Total
629
373
256
Male
317
193
124
Female
312
180
132
Flying Post (227)
Gender
Total (a + b)
On reserve and on Crown land (includes lands affiliated with First Nations operating under self-government agreements) (a)
Off reserve (b)
Total
232
*
*
Male
111
0
111
Female
121
*
*
* Data Suppressed due to low counts
Fort William (187)
Gender
Total (a + b)
On reserve and on Crown land (includes lands affiliated with First Nations operating under self-government agreements) (a)
Off reserve (b)
Total
2,540
1,005
1,535
Male
1,243
504
739
Female
1,297
501
796
Ginoogaming First Nation (185)
Gender
Total (a + b)
On reserve and on Crown land (includes lands affiliated with First Nations operating under self-government agreements) (a)
Off reserve (b)
Total
985
231
754
Male
484
122
362
Female
501
109
392
Grassy Narrows First Nation (149)
Gender
Total (a + b)
On reserve and on Crown land (includes lands affiliated with First Nations operating under self-government agreements) (a)
Off reserve (b)
Total
1,599
1,019
580
Male
784
503
281
Female
815
516
299
Gull Bay (188)
Gender
Total (a + b)
On reserve and on Crown land (includes lands affiliated with First Nations operating under self-government agreements) (a)
Off reserve (b)
Total
1,449
403
1,046
Male
734
221
513
Female
715
182
533
Iskatewizaagegan #39 Independent First Nation (154)
Gender
Total (a + b)
On reserve and on Crown land (includes lands affiliated with First Nations operating under self-government agreements) (a)
Off reserve (b)
Total
669
359
310
Male
341
185
156
Female
328
174
154
Lac Des Mille Lacs (189)
Gender
Total (a + b)
On reserve and on Crown land (includes lands affiliated with First Nations operating under self-government agreements) (a)
Off reserve (b)
Total
608
*
*
Male
300
*
*
Female
308
*
*
* Data Suppressed due to low counts
Lac La Croix (127)
Gender
Total (a + b)
On reserve and on Crown land (includes lands affiliated with First Nations operating under self-government agreements) (a)
Off reserve (b)
Total
481
333
148
Male
244
178
66
Female
237
155
82
Long Lake No.58 First Nation (184)
Gender
Total (a + b)
On reserve and on Crown land (includes lands affiliated with First Nations operating under self-government agreements) (a)
Off reserve (b)
Total
1,643
535
1,108
Male
809
272
537
Female
834
263
571
Martin Falls (186)
Gender
Total (a + b)
On reserve and on Crown land (includes lands affiliated with First Nations operating under self-government agreements) (a)
Off reserve (b)
Total
810
393
417
Male
406
212
194
Female
404
181
223
Matachewan (219)
Gender
Total (a + b)
On reserve and on Crown land (includes lands affiliated with First Nations operating under self-government agreements) (a)
Off reserve (b)
Total
860
57
803
Male
419
36
383
Female
441
21
420
Mattagami (226)
Gender
Total (a + b)
On reserve and on Crown land (includes lands affiliated with First Nations operating under self-government agreements) (a)
Off reserve (b)
Total
586
178
408
Male
282
96
186
Female
304
82
222
Michipicoten (225)
Gender
Total (a + b)
On reserve and on Crown land (includes lands affiliated with First Nations operating under self-government agreements) (a)
Off reserve (b)
Total
1,186
67
1,119
Male
576
37
539
Female
610
30
580
Missanabie Cree (223)
Gender
Total (a + b)
On reserve and on Crown land (includes lands affiliated with First Nations operating under self-government agreements) (a)
Off reserve (b)
Total
500
*
*
Male
257
*
*
Female
243
*
*
* Data Suppressed due to low counts
Mitaanjigamiing First Nation (133)
Gender
Total (a + b)
On reserve and on Crown land (includes lands affiliated with First Nations operating under self-government agreements) (a)
Off reserve (b)
Total
173
122
51
Male
90
64
26
Female
83
58
25
Moose Cree First Nation (144)
Gender
Total (a + b)
On reserve and on Crown land (includes lands affiliated with First Nations operating under self-government agreements) (a)
Off reserve (b)
Total
4,824
1,931
2,893
Male
2,416
1,024
1,392
Female
2,408
907
1,501
Naicatchewenin (128)
Gender
Total (a + b)
On reserve and on Crown land (includes lands affiliated with First Nations operating under self-government agreements) (a)
Off reserve (b)
Total
511
321
190
Male
260
162
98
Female
251
159
92
Naotkamegwanning (158)
Gender
Total (a + b)
On reserve and on Crown land (includes lands affiliated with First Nations operating under self-government agreements) (a)
Off reserve (b)
Total
1,292
777
515
Male
667
401
266
Female
625
376
249
Neskantaga First Nation (239)
Gender
Total (a + b)
On reserve and on Crown land (includes lands affiliated with First Nations operating under self-government agreements) (a)
Off reserve (b)
Total
492
376
116
Male
243
188
55
Female
249
188
61
Nibinamik First Nation (241)
Gender
Total (a + b)
On reserve and on Crown land (includes lands affiliated with First Nations operating under self-government agreements) (a)
Off reserve (b)
Total
543
400
143
Male
252
198
54
Female
291
202
89
Nigigoonsiminikaaning First Nation (129)
Gender
Total (a + b)
On reserve and on Crown land (includes lands affiliated with First Nations operating under self-government agreements) (a)
Off reserve (b)
Total
415
182
233
Male
197
90
107
Female
218
92
126
Niisaachewan Anishinaabe Nation (147)
Gender
Total (a + b)
On reserve and on Crown land (includes lands affiliated with First Nations operating under self-government agreements) (a)
Off reserve (b)
Total
470
183
287
Male
237
100
137
Female
233
83
150
Northwest Angle No.33 (151)
Gender
Total (a + b)
On reserve and on Crown land (includes lands affiliated with First Nations operating under self-government agreements) (a)
Off reserve (b)
Total
570
263
307
Male
262
138
124
Female
308
125
183
Ojibways of Onigaming First Nation (131)
Gender
Total (a + b)
On reserve and on Crown land (includes lands affiliated with First Nations operating under self-government agreements) (a)
Off reserve (b)
Total
814
489
325
Male
393
261
132
Female
421
228
193
Pays Plat (191)
Gender
Total (a + b)
On reserve and on Crown land (includes lands affiliated with First Nations operating under self-government agreements) (a)
Off reserve (b)
Total
258
77
181
Male
129
45
84
Female
129
32
97
Pic Mobert (195)
Gender
Total (a + b)
On reserve and on Crown land (includes lands affiliated with First Nations operating under self-government agreements) (a)
Off reserve (b)
Total
1,033
360
673
Male
529
191
338
Female
504
169
335
Rainy River First Nations (130)
Gender
Total (a + b)
On reserve and on Crown land (includes lands affiliated with First Nations operating under self-government agreements) (a)
Off reserve (b)
Total
1,174
477
697
Male
542
214
328
Female
632
263
369
Red Rock (193)
Gender
Total (a + b)
On reserve and on Crown land (includes lands affiliated with First Nations operating under self-government agreements) (a)
Off reserve (b)
Total
2,015
304
1,711
Male
979
149
830
Female
1,036
155
881
Seine River First Nation (132)
Gender
Total (a + b)
On reserve and on Crown land (includes lands affiliated with First Nations operating under self-government agreements) (a)
Off reserve (b)
Total
798
372
426
Male
378
169
209
Female
420
203
217
Shoal Lake No.40 (155)
Gender
Total (a + b)
On reserve and on Crown land (includes lands affiliated with First Nations operating under self-government agreements) (a)
Off reserve (b)
Total
655
305
350
Male
311
157
154
Female
344
148
196
Taykwa Tagamou Nation (145)
Gender
Total (a + b)
On reserve and on Crown land (includes lands affiliated with First Nations operating under self-government agreements) (a)
Off reserve (b)
Total
629
154
475
Male
307
82
225
Female
322
72
250
Wabaseemoong Independent Nations (150)
Gender
Total (a + b)
On reserve and on Crown land (includes lands affiliated with First Nations operating under self-government agreements) (a)
Off reserve (b)
Total
2,023
1,021
1,002
Male
989
502
487
Female
1,034
519
515
Wabauskang First Nation (156)
Gender
Total (a + b)
On reserve and on Crown land (includes lands affiliated with First Nations operating under self-government agreements) (a)
Off reserve (b)
Total
343
140
203
Male
167
68
99
Female
176
72
104
Wabigoon Lake Ojibway Nation (157)
Gender
Total (a + b)
On reserve and on Crown land (includes lands affiliated with First Nations operating under self-government agreements) (a)
Off reserve (b)
Total
779
193
586
Male
387
103
284
Female
392
90
302
Wahgoshig First Nation (233)
Gender
Total (a + b)
On reserve and on Crown land (includes lands affiliated with First Nations operating under self-government agreements) (a)
Off reserve (b)
Total
376
163
213
Male
196
89
107
Female
180
74
106
Washagamis Bay (235)
Gender
Total (a + b)
On reserve and on Crown land (includes lands affiliated with First Nations operating under self-government agreements) (a)
Off reserve (b)
Total
332
176
156
Male
161
90
71
Female
171
86
85
Webequie (240)
Gender
Total (a + b)
On reserve and on Crown land (includes lands affiliated with First Nations operating under self-government agreements) (a)
Off reserve (b)
Total
943
818
125
Male
459
398
61
Female
484
420
64
Weenusk (146)
Gender
Total (a + b)
On reserve and on Crown land (includes lands affiliated with First Nations operating under self-government agreements) (a)
Off reserve (b)
Total
602
291
311
Male
324
157
167
Female
278
134
144
Whitesand (190)
Gender
Total (a + b)
On reserve and on Crown land (includes lands affiliated with First Nations operating under self-government agreements) (a)
Off reserve (b)
Total
1,307
398
909
Male
657
209
448
Female
650
189
461
General list - Ontario region - Western District (826)
Gender
Total (a + b)
On reserve and on Crown land (includes lands affiliated with First Nations operating under self-government agreements) (a)
Off reserve (b)
Total
*
*
*
Male
*
*
*
Female
*
*
*
* Data Suppressed due to low counts
Responsibility Centre Western District
Gender
Total (a + b)
On reserve and on Crown land (includes lands affiliated with First Nations operating under self-government agreements) (a)
Off reserve (b)
Total
61,589
26,839
34,750
Male
30,541
13,790
16,751
Female
31,048
13,049
17,999
Sioux Lookout District
Bearskin Lake (207)
Gender
Total (a + b)
On reserve and on Crown land (includes lands affiliated with First Nations operating under self-government agreements) (a)
Off reserve (b)
Total
948
492
456
Male
471
263
208
Female
477
229
248
Cat Lake (216)
Gender
Total (a + b)
On reserve and on Crown land (includes lands affiliated with First Nations operating under self-government agreements) (a)
Off reserve (b)
Total
822
680
142
Male
425
359
66
Female
397
321
76
Deer Lake (237)
Gender
Total (a + b)
On reserve and on Crown land (includes lands affiliated with First Nations operating under self-government agreements) (a)
Off reserve (b)
Total
1,354
1,118
236
Male
671
561
110
Female
683
557
126
Fort Severn (215)
Gender
Total (a + b)
On reserve and on Crown land (includes lands affiliated with First Nations operating under self-government agreements) (a)
Off reserve (b)
Total
728
568
160
Male
359
287
72
Female
369
281
88
Kasabonika Lake (210)
Gender
Total (a + b)
On reserve and on Crown land (includes lands affiliated with First Nations operating under self-government agreements) (a)
Off reserve (b)
Total
1,191
1,131
60
Male
588
560
28
Female
603
571
32
Kee-Way-Win (325)
Gender
Total (a + b)
On reserve and on Crown land (includes lands affiliated with First Nations operating under self-government agreements) (a)
Off reserve (b)
Total
821
597
224
Male
401
303
98
Female
420
294
126
Kingfisher (212)
Gender
Total (a + b)
On reserve and on Crown land (includes lands affiliated with First Nations operating under self-government agreements) (a)
Off reserve (b)
Total
627
570
57
Male
327
297
30
Female
300
273
27
Kitchenuhmaykoosib Inninuwug (209)
Gender
Total (a + b)
On reserve and on Crown land (includes lands affiliated with First Nations operating under self-government agreements) (a)
Off reserve (b)
Total
1,712
1,191
521
Male
872
604
268
Female
840
587
253
Lac Seul (205)
Gender
Total (a + b)
On reserve and on Crown land (includes lands affiliated with First Nations operating under self-government agreements) (a)
Off reserve (b)
Total
3,562
981
2,581
Male
1,766
522
1,244
Female
1,796
459
1,337
McDowell Lake (326)
Gender
Total (a + b)
On reserve and on Crown land (includes lands affiliated with First Nations operating under self-government agreements) (a)
Off reserve (b)
Total
57
22
35
Male
30
*
*
Female
27
*
*
* Data Suppressed due to low counts
Mishkeegogamang (203)
Gender
Total (a + b)
On reserve and on Crown land (includes lands affiliated with First Nations operating under self-government agreements) (a)
Off reserve (b)
Total
1,967
1,227
740
Male
958
624
334
Female
1,009
603
406
Muskrat Dam Lake (213)
Gender
Total (a + b)
On reserve and on Crown land (includes lands affiliated with First Nations operating under self-government agreements) (a)
Off reserve (b)
Total
467
256
211
Male
223
123
100
Female
244
133
111
North Caribou Lake (204)
Gender
Total (a + b)
On reserve and on Crown land (includes lands affiliated with First Nations operating under self-government agreements) (a)
Off reserve (b)
Total
1,202
937
265
Male
554
431
123
Female
648
506
142
North Spirit Lake (238)
Gender
Total (a + b)
On reserve and on Crown land (includes lands affiliated with First Nations operating under self-government agreements) (a)
Off reserve (b)
Total
498
434
64
Male
243
221
22
Female
255
213
42
Ojibway Nation of Saugeen (258)
Gender
Total (a + b)
On reserve and on Crown land (includes lands affiliated with First Nations operating under self-government agreements) (a)
Off reserve (b)
Total
244
103
141
Male
127
58
69
Female
117
45
72
Pikangikum (208)
Gender
Total (a + b)
On reserve and on Crown land (includes lands affiliated with First Nations operating under self-government agreements) (a)
Off reserve (b)
Total
3,069
2,960
109
Male
1,590
1,536
54
Female
1,479
1,424
55
Poplar Hill (236)
Gender
Total (a + b)
On reserve and on Crown land (includes lands affiliated with First Nations operating under self-government agreements) (a)
Off reserve (b)
Total
684
665
19
Male
360
*
*
Female
324
*
*
* Data Suppressed due to low counts
Sachigo Lake (214)
Gender
Total (a + b)
On reserve and on Crown land (includes lands affiliated with First Nations operating under self-government agreements) (a)
Off reserve (b)
Total
969
580
389
Male
474
289
185
Female
495
291
204
Sandy Lake (211)
Gender
Total (a + b)
On reserve and on Crown land (includes lands affiliated with First Nations operating under self-government agreements) (a)
Off reserve (b)
Total
3,166
2,694
472
Male
1,619
1,394
225
Female
1,547
1,300
247
Slate Falls Nation (259)
Gender
Total (a + b)
On reserve and on Crown land (includes lands affiliated with First Nations operating under self-government agreements) (a)
Off reserve (b)
Total
293
216
77
Male
158
119
39
Female
135
97
38
Wapekeka (206)
Gender
Total (a + b)
On reserve and on Crown land (includes lands affiliated with First Nations operating under self-government agreements) (a)
Off reserve (b)
Total
498
488
10
Male
235
*
*
Female
263
*
*
* Data Suppressed due to low counts
Wawakapewin (234)
Gender
Total (a + b)
On reserve and on Crown land (includes lands affiliated with First Nations operating under self-government agreements) (a)
Off reserve (b)
Total
74
46
28
Male
38
25
13
Female
36
21
15
Wunnumin (217)
Gender
Total (a + b)
On reserve and on Crown land (includes lands affiliated with First Nations operating under self-government agreements) (a)
Off reserve (b)
Total
706
601
105
Male
361
309
52
Female
345
292
53
Responsibility Centre Sioux Lookout District
Gender
Total (a + b)
On reserve and on Crown land (includes lands affiliated with First Nations operating under self-government agreements) (a)
Off reserve (b)
Total
25,659
18,557
7,102
Male
12,850
9,477
3,373
Female
12,809
9,080
3,729
Ontario region - 4
Gender
Total (a + b)
On reserve and on Crown land (includes lands affiliated with First Nations operating under self-government agreements) (a)
Off reserve (b)
Total
218,451
98,770
119,681
Male
106,307
49,813
56,494
Female
112,144
48,957
63,187
Region 5 - Manitoba
Barren Lands (308)
Gender
Total (a + b)
On reserve and on Crown land (includes lands affiliated with First Nations operating under self-government agreements) (a)
Off reserve (b)
Total
1,187
519
668
Male
578
268
310
Female
609
251
358
Berens River (266)
Gender
Total (a + b)
On reserve and on Crown land (includes lands affiliated with First Nations operating under self-government agreements) (a)
Off reserve (b)
Total
3,546
2,220
1,326
Male
1,795
1,184
611
Female
1,751
1,036
715
Birdtail Sioux (284)
Gender
Total (a + b)
On reserve and on Crown land (includes lands affiliated with First Nations operating under self-government agreements) (a)
Off reserve (b)
Total
909
470
439
Male
439
231
208
Female
470
239
231
Black River First Nation (260)
Gender
Total (a + b)
On reserve and on Crown land (includes lands affiliated with First Nations operating under self-government agreements) (a)
Off reserve (b)
Total
1,447
1,000
447
Male
739
498
241
Female
708
502
206
Bloodvein (267)
Gender
Total (a + b)
On reserve and on Crown land (includes lands affiliated with First Nations operating under self-government agreements) (a)
Off reserve (b)
Total
1,918
1,176
742
Male
948
585
363
Female
970
591
379
Brokenhead Ojibway Nation (261)
Gender
Total (a + b)
On reserve and on Crown land (includes lands affiliated with First Nations operating under self-government agreements) (a)
Off reserve (b)
Total
2,112
799
1,313
Male
1,037
423
614
Female
1,075
376
699
Buffalo Point First Nation (265)
Gender
Total (a + b)
On reserve and on Crown land (includes lands affiliated with First Nations operating under self-government agreements) (a)
Off reserve (b)
Total
132
55
77
Male
62
26
36
Female
70
29
41
Bunibonibee Cree Nation (301)
Gender
Total (a + b)
On reserve and on Crown land (includes lands affiliated with First Nations operating under self-government agreements) (a)
Off reserve (b)
Total
3,211
2,599
612
Male
1,602
1,341
261
Female
1,609
1,258
351
Canupawakpa Dakota First Nation (289)
Gender
Total (a + b)
On reserve and on Crown land (includes lands affiliated with First Nations operating under self-government agreements) (a)
Off reserve (b)
Total
686
334
352
Male
332
171
161
Female
354
163
191
Chemawawin Cree Nation (309)
Gender
Total (a + b)
On reserve and on Crown land (includes lands affiliated with First Nations operating under self-government agreements) (a)
Off reserve (b)
Total
1,955
1,577
378
Male
977
810
167
Female
978
767
211
Cross Lake Band of Indians (276)
Gender
Total (a + b)
On reserve and on Crown land (includes lands affiliated with First Nations operating under self-government agreements) (a)
Off reserve (b)
Total
8,930
6,398
2,532
Male
4,487
3,241
1,246
Female
4,443
3,157
1,286
Dakota Plains (288)
Gender
Total (a + b)
On reserve and on Crown land (includes lands affiliated with First Nations operating under self-government agreements) (a)
Off reserve (b)
Total
255
173
82
Male
120
86
34
Female
135
87
48
Dakota Tipi (295)
Gender
Total (a + b)
On reserve and on Crown land (includes lands affiliated with First Nations operating under self-government agreements) (a)
Off reserve (b)
Total
440
251
189
Male
251
154
97
Female
189
97
92
Dauphin River (316)
Gender
Total (a + b)
On reserve and on Crown land (includes lands affiliated with First Nations operating under self-government agreements) (a)
Off reserve (b)
Total
391
252
139
Male
175
111
64
Female
216
141
75
Ebb and Flow (280)
Gender
Total (a + b)
On reserve and on Crown land (includes lands affiliated with First Nations operating under self-government agreements) (a)
Off reserve (b)
Total
3,243
1,912
1,331
Male
1,567
909
658
Female
1,676
1,003
673
Fisher River (264)
Gender
Total (a + b)
On reserve and on Crown land (includes lands affiliated with First Nations operating under self-government agreements) (a)
Off reserve (b)
Total
4,041
1,511
2,530
Male
2,061
774
1,287
Female
1,980
737
1,243
Fort Alexander (262)
Gender
Total (a + b)
On reserve and on Crown land (includes lands affiliated with First Nations operating under self-government agreements) (a)
Off reserve (b)
Total
8,082
3,611
4,471
Male
4,020
1,850
2,170
Female
4,062
1,761
2,301
Fox Lake (305)
Gender
Total (a + b)
On reserve and on Crown land (includes lands affiliated with First Nations operating under self-government agreements) (a)
Off reserve (b)
Total
1,293
220
1,073
Male
605
112
493
Female
688
108
580
Gambler First Nation (294)
Gender
Total (a + b)
On reserve and on Crown land (includes lands affiliated with First Nations operating under self-government agreements) (a)
Off reserve (b)
Total
304
68
236
Male
130
35
95
Female
174
33
141
Garden Hill First Nations (297)
Gender
Total (a + b)
On reserve and on Crown land (includes lands affiliated with First Nations operating under self-government agreements) (a)
Off reserve (b)
Total
4,823
4,075
748
Male
2,457
2,104
353
Female
2,366
1,971
395
God's Lake First Nation (296)
Gender
Total (a + b)
On reserve and on Crown land (includes lands affiliated with First Nations operating under self-government agreements) (a)
Off reserve (b)
Total
2,819
1,555
1,264
Male
1,445
823
622
Female
1,374
732
642
Hollow Water (263)
Gender
Total (a + b)
On reserve and on Crown land (includes lands affiliated with First Nations operating under self-government agreements) (a)
Off reserve (b)
Total
2,036
1,072
964
Male
984
521
463
Female
1,052
551
501
Keeseekoowenin (286)
Gender
Total (a + b)
On reserve and on Crown land (includes lands affiliated with First Nations operating under self-government agreements) (a)
Off reserve (b)
Total
1,297
476
821
Male
642
246
396
Female
655
230
425
Kinonjeoshtegon First Nation (268)
Gender
Total (a + b)
On reserve and on Crown land (includes lands affiliated with First Nations operating under self-government agreements) (a)
Off reserve (b)
Total
794
371
423
Male
397
188
209
Female
397
183
214
Lake Manitoba (271)
Gender
Total (a + b)
On reserve and on Crown land (includes lands affiliated with First Nations operating under self-government agreements) (a)
Off reserve (b)
Total
2,150
1,290
860
Male
1,082
665
417
Female
1,068
625
443
Lake St. Martin (275)
Gender
Total (a + b)
On reserve and on Crown land (includes lands affiliated with First Nations operating under self-government agreements) (a)
Off reserve (b)
Total
2,879
1,710
1,169
Male
1,424
865
559
Female
1,455
845
610
Little Grand Rapids (270)
Gender
Total (a + b)
On reserve and on Crown land (includes lands affiliated with First Nations operating under self-government agreements) (a)
Off reserve (b)
Total
1,753
1,368
385
Male
907
725
182
Female
846
643
203
Little Saskatchewan (274)
Gender
Total (a + b)
On reserve and on Crown land (includes lands affiliated with First Nations operating under self-government agreements) (a)
Off reserve (b)
Total
1,343
725
618
Male
645
362
283
Female
698
363
335
Long Plain (287)
Gender
Total (a + b)
On reserve and on Crown land (includes lands affiliated with First Nations operating under self-government agreements) (a)
Off reserve (b)
Total
4,634
2,527
2,107
Male
2,332
1,328
1,004
Female
2,302
1,199
1,103
Manto Sipi Cree Nation (302)
Gender
Total (a + b)
On reserve and on Crown land (includes lands affiliated with First Nations operating under self-government agreements) (a)
Off reserve (b)
Total
963
828
135
Male
478
411
67
Female
485
417
68
Marcel Colomb First Nation (328)
Gender
Total (a + b)
On reserve and on Crown land (includes lands affiliated with First Nations operating under self-government agreements) (a)
Off reserve (b)
Total
449
338
111
Male
240
176
64
Female
209
162
47
Mathias Colomb (311)
Gender
Total (a + b)
On reserve and on Crown land (includes lands affiliated with First Nations operating under self-government agreements) (a)
Off reserve (b)
Total
3,905
2,516
1,389
Male
1,983
1,341
642
Female
1,922
1,175
747
Misipawistik Cree Nation (310)
Gender
Total (a + b)
On reserve and on Crown land (includes lands affiliated with First Nations operating under self-government agreements) (a)
Off reserve (b)
Total
2,150
1,404
746
Male
1,055
689
366
Female
1,095
715
380
Mosakahiken Cree Nation (312)
Gender
Total (a + b)
On reserve and on Crown land (includes lands affiliated with First Nations operating under self-government agreements) (a)
Off reserve (b)
Total
2,272
1,635
637
Male
1,126
835
291
Female
1,146
800
346
Nisichawayasihk Cree Nation (313)
Gender
Total (a + b)
On reserve and on Crown land (includes lands affiliated with First Nations operating under self-government agreements) (a)
Off reserve (b)
Total
5,285
3,152
2,133
Male
2,587
1,633
954
Female
2,698
1,519
1,179
Northlands Denesuline First Nation (317)
Gender
Total (a + b)
On reserve and on Crown land (includes lands affiliated with First Nations operating under self-government agreements) (a)
Off reserve (b)
Total
1,130
957
173
Male
548
460
88
Female
582
497
85
Norway House Cree Nation (278)
Gender
Total (a + b)
On reserve and on Crown land (includes lands affiliated with First Nations operating under self-government agreements) (a)
Off reserve (b)
Total
8,421
6,489
1,932
Male
4,151
3,239
912
Female
4,270
3,250
1,020
O-Chi-Chak-Ko-Sipi First Nation (279)
Gender
Total (a + b)
On reserve and on Crown land (includes lands affiliated with First Nations operating under self-government agreements) (a)
Off reserve (b)
Total
1,206
572
634
Male
579
282
297
Female
627
290
337
Opaskwayak Cree Nation (315)
Gender
Total (a + b)
On reserve and on Crown land (includes lands affiliated with First Nations operating under self-government agreements) (a)
Off reserve (b)
Total
6,269
3,380
2,889
Male
3,081
1,685
1,396
Female
3,188
1,695
1,493
O-Pipon-Na-Piwin Cree Nation (318)
Gender
Total (a + b)
On reserve and on Crown land (includes lands affiliated with First Nations operating under self-government agreements) (a)
Off reserve (b)
Total
1,709
1,126
583
Male
904
605
299
Female
805
521
284
Pauingassi First Nation (327)
Gender
Total (a + b)
On reserve and on Crown land (includes lands affiliated with First Nations operating under self-government agreements) (a)
Off reserve (b)
Total
690
624
66
Male
360
332
28
Female
330
292
38
Peguis (269)
Gender
Total (a + b)
On reserve and on Crown land (includes lands affiliated with First Nations operating under self-government agreements) (a)
Off reserve (b)
Total
10,484
3,716
6,768
Male
5,170
1,899
3,271
Female
5,314
1,817
3,497
Pinaymootang First Nation (272)
Gender
Total (a + b)
On reserve and on Crown land (includes lands affiliated with First Nations operating under self-government agreements) (a)
Off reserve (b)
Total
3,347
1,372
1,975
Male
1,614
674
940
Female
1,733
698
1,035
Pine Creek (282)
Gender
Total (a + b)
On reserve and on Crown land (includes lands affiliated with First Nations operating under self-government agreements) (a)
Off reserve (b)
Total
3,758
959
2,799
Male
1,879
513
1,366
Female
1,879
446
1,433
Poplar River First Nation (277)
Gender
Total (a + b)
On reserve and on Crown land (includes lands affiliated with First Nations operating under self-government agreements) (a)
Off reserve (b)
Total
1,941
1,340
601
Male
966
683
283
Female
975
657
318
Red Sucker Lake (300)
Gender
Total (a + b)
On reserve and on Crown land (includes lands affiliated with First Nations operating under self-government agreements) (a)
Off reserve (b)
Total
1,129
997
132
Male
552
496
56
Female
577
501
76
Rolling River (291)
Gender
Total (a + b)
On reserve and on Crown land (includes lands affiliated with First Nations operating under self-government agreements) (a)
Off reserve (b)
Total
1,102
350
752
Male
554
180
374
Female
548
170
378
Roseau River Anishinabe First Nation Government (273)
Gender
Total (a + b)
On reserve and on Crown land (includes lands affiliated with First Nations operating under self-government agreements) (a)
Off reserve (b)
Total
2,717
1,243
1,474
Male
1,349
649
700
Female
1,368
594
774
Sandy Bay (283)
Gender
Total (a + b)
On reserve and on Crown land (includes lands affiliated with First Nations operating under self-government agreements) (a)
Off reserve (b)
Total
6,905
4,218
2,687
Male
3,536
2,227
1,309
Female
3,369
1,991
1,378
Sapotaweyak Cree Nation (314)
Gender
Total (a + b)
On reserve and on Crown land (includes lands affiliated with First Nations operating under self-government agreements) (a)
Off reserve (b)
Total
2,641
983
1,658
Male
1,359
531
828
Female
1,282
452
830
Sayisi Dene First Nation (303)
Gender
Total (a + b)
On reserve and on Crown land (includes lands affiliated with First Nations operating under self-government agreements) (a)
Off reserve (b)
Total
858
319
539
Male
427
177
250
Female
431
142
289
Shamattawa First Nation (307)
Gender
Total (a + b)
On reserve and on Crown land (includes lands affiliated with First Nations operating under self-government agreements) (a)
Off reserve (b)
Total
1,660
1,468
192
Male
834
734
100
Female
826
734
92
Sioux Valley Dakota Nation (290)
Gender
Total (a + b)
On reserve and on Crown land (includes lands affiliated with First Nations operating under self-government agreements) (a)
Off reserve (b)
Total
2,686
1,515
1,171
Male
1,291
775
516
Female
1,395
740
655
Skownan First Nation (281)
Gender
Total (a + b)
On reserve and on Crown land (includes lands affiliated with First Nations operating under self-government agreements) (a)
Off reserve (b)
Total
1,557
768
789
Male
784
377
407
Female
773
391
382
St. Theresa Point (298)
Gender
Total (a + b)
On reserve and on Crown land (includes lands affiliated with First Nations operating under self-government agreements) (a)
Off reserve (b)
Total
4,388
4,060
328
Male
2,243
2,098
145
Female
2,145
1,962
183
Swan Lake (293)
Gender
Total (a + b)
On reserve and on Crown land (includes lands affiliated with First Nations operating under self-government agreements) (a)
Off reserve (b)
Total
1,464
423
1,041
Male
688
201
487
Female
776
222
554
Tataskweyak Cree Nation (306)
Gender
Total (a + b)
On reserve and on Crown land (includes lands affiliated with First Nations operating under self-government agreements) (a)
Off reserve (b)
Total
4,014
2,483
1,531
Male
1,995
1,255
740
Female
2,019
1,228
791
Tootinaowaziibeeng Treaty Reserve (292)
Gender
Total (a + b)
On reserve and on Crown land (includes lands affiliated with First Nations operating under self-government agreements) (a)
Off reserve (b)
Total
1,529
702
827
Male
735
342
393
Female
794
360
434
War Lake First Nation (323)
Gender
Total (a + b)
On reserve and on Crown land (includes lands affiliated with First Nations operating under self-government agreements) (a)
Off reserve (b)
Total
328
132
196
Male
160
78
82
Female
168
54
114
Wasagamack First Nation (299)
Gender
Total (a + b)
On reserve and on Crown land (includes lands affiliated with First Nations operating under self-government agreements) (a)
Off reserve (b)
Total
2,222
2,005
217
Male
1,122
1,031
91
Female
1,100
974
126
Waywayseecappo First Nation Treaty Four - 1874 (285)
Gender
Total (a + b)
On reserve and on Crown land (includes lands affiliated with First Nations operating under self-government agreements) (a)
Off reserve (b)
Total
2,870
1,640
1,230
Male
1,411
809
602
Female
1,459
831
628
Wuskwi Sipihk First Nation (324)
Gender
Total (a + b)
On reserve and on Crown land (includes lands affiliated with First Nations operating under self-government agreements) (a)
Off reserve (b)
Total
659
179
480
Male
326
102
224
Female
333
77
256
York Factory First Nation (304)
Gender
Total (a + b)
On reserve and on Crown land (includes lands affiliated with First Nations operating under self-government agreements) (a)
Off reserve (b)
Total
1,462
485
977
Male
731
251
480
Female
731
234
497
General list - Manitoba region (804)
Gender
Total (a + b)
On reserve and on Crown land (includes lands affiliated with First Nations operating under self-government agreements) (a)
Off reserve (b)
Total
*
*
*
Male
*
*
*
Female
*
*
*
* Data Suppressed due to low counts
Manitoba region - 5
Gender
Total (a + b)
On reserve and on Crown land (includes lands affiliated with First Nations operating under self-government agreements) (a)
Off reserve (b)
Total
162,787
94,692
68,095
Male
81,064
48,406
32,658
Female
81,723
46,286
35,437
Region 6 - Saskatchewan
North Central District
Ahtahkakoop (406)
Gender
Total (a + b)
On reserve and on Crown land (includes lands affiliated with First Nations operating under self-government agreements) (a)
Off reserve (b)
Total
3,692
1,995
1,697
Male
1,842
994
848
Female
1,850
1,001
849
Beardy's and Okemasis (369)
Gender
Total (a + b)
On reserve and on Crown land (includes lands affiliated with First Nations operating under self-government agreements) (a)
Off reserve (b)
Total
3,565
1,415
2,150
Male
1,775
707
1,068
Female
1,790
708
1,082
Big Island Lake Cree Nation (399)
Gender
Total (a + b)
On reserve and on Crown land (includes lands affiliated with First Nations operating under self-government agreements) (a)
Off reserve (b)
Total
1,270
1,041
229
Male
599
497
102
Female
671
544
127
Big River (404)
Gender
Total (a + b)
On reserve and on Crown land (includes lands affiliated with First Nations operating under self-government agreements) (a)
Off reserve (b)
Total
3,658
2,669
989
Male
1,820
1,364
456
Female
1,838
1,305
533
Birch Narrows First Nation (403)
Gender
Total (a + b)
On reserve and on Crown land (includes lands affiliated with First Nations operating under self-government agreements) (a)
Off reserve (b)
Total
846
483
363
Male
412
234
178
Female
434
249
185
Black Lake (359)
Gender
Total (a + b)
On reserve and on Crown land (includes lands affiliated with First Nations operating under self-government agreements) (a)
Off reserve (b)
Total
2,268
1,672
596
Male
1,118
848
270
Female
1,150
824
326
Buffalo River Dene Nation (398)
Gender
Total (a + b)
On reserve and on Crown land (includes lands affiliated with First Nations operating under self-government agreements) (a)
Off reserve (b)
Total
1,504
839
665
Male
762
429
333
Female
742
410
332
Canoe Lake Cree First Nation (394)
Gender
Total (a + b)
On reserve and on Crown land (includes lands affiliated with First Nations operating under self-government agreements) (a)
Off reserve (b)
Total
2,583
1,155
1,428
Male
1,311
597
714
Female
1,272
558
714
Clearwater River Dene (401)
Gender
Total (a + b)
On reserve and on Crown land (includes lands affiliated with First Nations operating under self-government agreements) (a)
Off reserve (b)
Total
2,365
1,039
1,326
Male
1,197
516
681
Female
1,168
523
645
Cumberland House Cree Nation (350)
Gender
Total (a + b)
On reserve and on Crown land (includes lands affiliated with First Nations operating under self-government agreements) (a)
Off reserve (b)
Total
1,763
1,007
756
Male
866
511
355
Female
897
496
401
English River First Nation (400)
Gender
Total (a + b)
On reserve and on Crown land (includes lands affiliated with First Nations operating under self-government agreements) (a)
Off reserve (b)
Total
1,641
821
820
Male
803
400
403
Female
838
421
417
Flying Dust First Nation (395)
Gender
Total (a + b)
On reserve and on Crown land (includes lands affiliated with First Nations operating under self-government agreements) (a)
Off reserve (b)
Total
1,471
591
880
Male
700
299
401
Female
771
292
479
Fond du Lac (351)
Gender
Total (a + b)
On reserve and on Crown land (includes lands affiliated with First Nations operating under self-government agreements) (a)
Off reserve (b)
Total
2,159
1,166
993
Male
1,043
581
462
Female
1,116
585
531
Hatchet Lake (352)
Gender
Total (a + b)
On reserve and on Crown land (includes lands affiliated with First Nations operating under self-government agreements) (a)
Off reserve (b)
Total
1,910
1,475
435
Male
950
739
211
Female
960
736
224
James Smith (370)
Gender
Total (a + b)
On reserve and on Crown land (includes lands affiliated with First Nations operating under self-government agreements) (a)
Off reserve (b)
Total
3,679
2,034
1,645
Male
1,831
1,054
777
Female
1,848
980
868
Kinistin Saulteaux Nation (377)
Gender
Total (a + b)
On reserve and on Crown land (includes lands affiliated with First Nations operating under self-government agreements) (a)
Off reserve (b)
Total
1,098
411
687
Male
537
218
319
Female
561
193
368
Lac La Ronge (353)
Gender
Total (a + b)
On reserve and on Crown land (includes lands affiliated with First Nations operating under self-government agreements) (a)
Off reserve (b)
Total
11,254
7,217
4,037
Male
5,567
3,627
1,940
Female
5,687
3,590
2,097
Little Pine (340)
Gender
Total (a + b)
On reserve and on Crown land (includes lands affiliated with First Nations operating under self-government agreements) (a)
Off reserve (b)
Total
2,180
1,066
1,114
Male
1,069
544
525
Female
1,111
522
589
Lucky Man (341)
Gender
Total (a + b)
On reserve and on Crown land (includes lands affiliated with First Nations operating under self-government agreements) (a)
Off reserve (b)
Total
115
26
89
Male
57
15
42
Female
58
11
47
Makwa Sahgaiehcan First Nation (396)
Gender
Total (a + b)
On reserve and on Crown land (includes lands affiliated with First Nations operating under self-government agreements) (a)
Off reserve (b)
Total
1,758
1,271
487
Male
900
655
245
Female
858
616
242
Ministikwan Lake Cree Nation (397)
Gender
Total (a + b)
On reserve and on Crown land (includes lands affiliated with First Nations operating under self-government agreements) (a)
Off reserve (b)
Total
1,357
1,100
257
Male
655
528
127
Female
702
572
130
Mistawasis Nêhiyawak (374)
Gender
Total (a + b)
On reserve and on Crown land (includes lands affiliated with First Nations operating under self-government agreements) (a)
Off reserve (b)
Total
2,880
1,261
1,619
Male
1,434
649
785
Female
1,446
612
834
Montreal Lake (354)
Gender
Total (a + b)
On reserve and on Crown land (includes lands affiliated with First Nations operating under self-government agreements) (a)
Off reserve (b)
Total
4,161
2,478
1,683
Male
2,104
1,301
803
Female
2,057
1,177
880
Moosomin (342)
Gender
Total (a + b)
On reserve and on Crown land (includes lands affiliated with First Nations operating under self-government agreements) (a)
Off reserve (b)
Total
1,985
1,248
737
Male
962
613
349
Female
1,023
635
388
Mosquito, Grizzly Bear's Head, Lean Man First Nations (343)
Gender
Total (a + b)
On reserve and on Crown land (includes lands affiliated with First Nations operating under self-government agreements) (a)
Off reserve (b)
Total
1,447
789
658
Male
724
411
313
Female
723
378
345
Muskeg Lake Cree Nation #102 (375)
Gender
Total (a + b)
On reserve and on Crown land (includes lands affiliated with First Nations operating under self-government agreements) (a)
Off reserve (b)
Total
2,160
402
1,758
Male
1,034
212
822
Female
1,126
190
936
Muskoday First Nation (371)
Gender
Total (a + b)
On reserve and on Crown land (includes lands affiliated with First Nations operating under self-government agreements) (a)
Off reserve (b)
Total
1,962
646
1,316
Male
950
345
605
Female
1,012
301
711
One Arrow First Nation (373)
Gender
Total (a + b)
On reserve and on Crown land (includes lands affiliated with First Nations operating under self-government agreements) (a)
Off reserve (b)
Total
2,069
865
1,204
Male
1,030
441
589
Female
1,039
424
615
Onion Lake Cree Nation (344)
Gender
Total (a + b)
On reserve and on Crown land (includes lands affiliated with First Nations operating under self-government agreements) (a)
Off reserve (b)
Total
6,504
4,230
2,274
Male
3,176
2,082
1,094
Female
3,328
2,148
1,180
Pelican Lake (405)
Gender
Total (a + b)
On reserve and on Crown land (includes lands affiliated with First Nations operating under self-government agreements) (a)
Off reserve (b)
Total
1,709
1,299
410
Male
907
689
218
Female
802
610
192
Peter Ballantyne Cree Nation (355)
Gender
Total (a + b)
On reserve and on Crown land (includes lands affiliated with First Nations operating under self-government agreements) (a)
Off reserve (b)
Total
11,302
7,280
4,022
Male
5,645
3,710
1,935
Female
5,657
3,570
2,087
Poundmaker (345)
Gender
Total (a + b)
On reserve and on Crown land (includes lands affiliated with First Nations operating under self-government agreements) (a)
Off reserve (b)
Total
1,809
989
820
Male
844
495
349
Female
965
494
471
Red Earth (356)
Gender
Total (a + b)
On reserve and on Crown land (includes lands affiliated with First Nations operating under self-government agreements) (a)
Off reserve (b)
Total
1,914
1,636
278
Male
954
817
137
Female
960
819
141
Red Pheasant (346)
Gender
Total (a + b)
On reserve and on Crown land (includes lands affiliated with First Nations operating under self-government agreements) (a)
Off reserve (b)
Total
2,507
833
1,674
Male
1,238
436
802
Female
1,269
397
872
Saulteaux (347)
Gender
Total (a + b)
On reserve and on Crown land (includes lands affiliated with First Nations operating under self-government agreements) (a)
Off reserve (b)
Total
1,340
702
638
Male
673
362
311
Female
667
340
327
Shoal Lake Cree Nation (357)
Gender
Total (a + b)
On reserve and on Crown land (includes lands affiliated with First Nations operating under self-government agreements) (a)
Off reserve (b)
Total
1,131
918
213
Male
578
467
111
Female
553
451
102
Sturgeon Lake First Nation (360)
Gender
Total (a + b)
On reserve and on Crown land (includes lands affiliated with First Nations operating under self-government agreements) (a)
Off reserve (b)
Total
3,008
1,908
1,100
Male
1,499
986
513
Female
1,509
922
587
Sweetgrass (348)
Gender
Total (a + b)
On reserve and on Crown land (includes lands affiliated with First Nations operating under self-government agreements) (a)
Off reserve (b)
Total
2,051
833
1,218
Male
1,001
423
578
Female
1,050
410
640
Thunderchild First Nation (349)
Gender
Total (a + b)
On reserve and on Crown land (includes lands affiliated with First Nations operating under self-government agreements) (a)
Off reserve (b)
Total
2,976
1,370
1,606
Male
1,490
701
789
Female
1,486
669
817
Wahpeton Dakota Nation (358)
Gender
Total (a + b)
On reserve and on Crown land (includes lands affiliated with First Nations operating under self-government agreements) (a)
Off reserve (b)
Total
554
363
191
Male
270
178
92
Female
284
185
99
Waterhen Lake (402)
Gender
Total (a + b)
On reserve and on Crown land (includes lands affiliated with First Nations operating under self-government agreements) (a)
Off reserve (b)
Total
2,072
988
1,084
Male
1,015
501
514
Female
1,057
487
570
Whitecap Dakota First Nation (372)
Gender
Total (a + b)
On reserve and on Crown land (includes lands affiliated with First Nations operating under self-government agreements) (a)
Off reserve (b)
Total
681
333
348
Male
312
153
159
Female
369
180
189
Witchekan Lake (407)
Gender
Total (a + b)
On reserve and on Crown land (includes lands affiliated with First Nations operating under self-government agreements) (a)
Off reserve (b)
Total
792
560
232
Male
400
305
95
Female
392
255
137
Yellow Quill (376)
Gender
Total (a + b)
On reserve and on Crown land (includes lands affiliated with First Nations operating under self-government agreements) (a)
Off reserve (b)
Total
3,086
992
2,094
Male
1,556
532
1,024
Female
1,530
460
1,070
General list - Saskatchewan region - North Central District (831)
Gender
Total (a + b)
On reserve and on Crown land (includes lands affiliated with First Nations operating under self-government agreements) (a)
Off reserve (b)
Total
*
*
*
Male
*
*
*
Female
*
*
*
* Data Suppressed due to low counts
Responsibility Centre North Central District
Gender
Total (a + b)
On reserve and on Crown land (includes lands affiliated with First Nations operating under self-government agreements) (a)
Off reserve (b)
Total
112,243
63,416
48,827
Male
55,614
32,166
23,448
Female
56,629
31,250
25,379
South District
Carry The Kettle (378)
Gender
Total (a + b)
On reserve and on Crown land (includes lands affiliated with First Nations operating under self-government agreements) (a)
Off reserve (b)
Total
2,934
954
1,980
Male
1,402
483
919
Female
1,532
471
1,061
Cote First Nation 366 (366)
Gender
Total (a + b)
On reserve and on Crown land (includes lands affiliated with First Nations operating under self-government agreements) (a)
Off reserve (b)
Total
4,091
1,161
2,930
Male
1,944
592
1,352
Female
2,147
569
1,578
Cowessess (361)
Gender
Total (a + b)
On reserve and on Crown land (includes lands affiliated with First Nations operating under self-government agreements) (a)
Off reserve (b)
Total
4,310
941
3,369
Male
2,055
476
1,579
Female
2,255
465
1,790
Day Star (389)
Gender
Total (a + b)
On reserve and on Crown land (includes lands affiliated with First Nations operating under self-government agreements) (a)
Off reserve (b)
Total
531
197
334
Male
284
109
175
Female
247
88
159
Fishing Lake First Nation (390)
Gender
Total (a + b)
On reserve and on Crown land (includes lands affiliated with First Nations operating under self-government agreements) (a)
Off reserve (b)
Total
1,852
571
1,281
Male
905
288
617
Female
947
283
664
George Gordon First Nation (391)
Gender
Total (a + b)
On reserve and on Crown land (includes lands affiliated with First Nations operating under self-government agreements) (a)
Off reserve (b)
Total
3,778
1,301
2,477
Male
1,901
711
1,190
Female
1,877
590
1,287
Kahkewistahaw (362)
Gender
Total (a + b)
On reserve and on Crown land (includes lands affiliated with First Nations operating under self-government agreements) (a)
Off reserve (b)
Total
2,136
706
1,430
Male
1,028
356
672
Female
1,108
350
758
Kawacatoose (393)
Gender
Total (a + b)
On reserve and on Crown land (includes lands affiliated with First Nations operating under self-government agreements) (a)
Off reserve (b)
Total
3,254
1,267
1,987
Male
1,606
647
959
Female
1,648
620
1,028
Keeseekoose (367)
Gender
Total (a + b)
On reserve and on Crown land (includes lands affiliated with First Nations operating under self-government agreements) (a)
Off reserve (b)
Total
2,534
780
1,754
Male
1,240
415
825
Female
1,294
365
929
Little Black Bear (379)
Gender
Total (a + b)
On reserve and on Crown land (includes lands affiliated with First Nations operating under self-government agreements) (a)
Off reserve (b)
Total
594
223
371
Male
289
112
177
Female
305
111
194
Muscowpetung (381)
Gender
Total (a + b)
On reserve and on Crown land (includes lands affiliated with First Nations operating under self-government agreements) (a)
Off reserve (b)
Total
1,485
400
1,085
Male
731
221
510
Female
754
179
575
Muskowekwan (392)
Gender
Total (a + b)
On reserve and on Crown land (includes lands affiliated with First Nations operating under self-government agreements) (a)
Off reserve (b)
Total
1,969
649
1,320
Male
970
333
637
Female
999
316
683
Nekaneet (380)
Gender
Total (a + b)
On reserve and on Crown land (includes lands affiliated with First Nations operating under self-government agreements) (a)
Off reserve (b)
Total
549
242
307
Male
278
121
157
Female
271
121
150
Ocean Man (408)
Gender
Total (a + b)
On reserve and on Crown land (includes lands affiliated with First Nations operating under self-government agreements) (a)
Off reserve (b)
Total
564
202
362
Male
279
109
170
Female
285
93
192
Ochapowace (363)
Gender
Total (a + b)
On reserve and on Crown land (includes lands affiliated with First Nations operating under self-government agreements) (a)
Off reserve (b)
Total
1,898
706
1,192
Male
926
357
569
Female
972
349
623
Okanese (382)
Gender
Total (a + b)
On reserve and on Crown land (includes lands affiliated with First Nations operating under self-government agreements) (a)
Off reserve (b)
Total
737
304
433
Male
375
163
212
Female
362
141
221
Pasqua First Nation #79 (383)
Gender
Total (a + b)
On reserve and on Crown land (includes lands affiliated with First Nations operating under self-government agreements) (a)
Off reserve (b)
Total
2,451
797
1,654
Male
1,229
404
825
Female
1,222
393
829
Peepeekisis Cree Nation No.81 (384)
Gender
Total (a + b)
On reserve and on Crown land (includes lands affiliated with First Nations operating under self-government agreements) (a)
Off reserve (b)
Total
2,997
707
2,290
Male
1,454
366
1,088
Female
1,543
341
1,202
Pheasant Rump Nakota (409)
Gender
Total (a + b)
On reserve and on Crown land (includes lands affiliated with First Nations operating under self-government agreements) (a)
Off reserve (b)
Total
446
188
258
Male
209
90
119
Female
237
98
139
Piapot (385)
Gender
Total (a + b)
On reserve and on Crown land (includes lands affiliated with First Nations operating under self-government agreements) (a)
Off reserve (b)
Total
2,551
781
1,770
Male
1,263
426
837
Female
1,288
355
933
Standing Buffalo (386)
Gender
Total (a + b)
On reserve and on Crown land (includes lands affiliated with First Nations operating under self-government agreements) (a)
Off reserve (b)
Total
1,305
520
785
Male
661
259
402
Female
644
261
383
Star Blanket Cree Nation (387)
Gender
Total (a + b)
On reserve and on Crown land (includes lands affiliated with First Nations operating under self-government agreements) (a)
Off reserve (b)
Total
713
289
424
Male
345
141
204
Female
368
148
220
The Key First Nation (368)
Gender
Total (a + b)
On reserve and on Crown land (includes lands affiliated with First Nations operating under self-government agreements) (a)
Off reserve (b)
Total
1,416
333
1,083
Male
699
166
533
Female
717
167
550
White Bear (365)
Gender
Total (a + b)
On reserve and on Crown land (includes lands affiliated with First Nations operating under self-government agreements) (a)
Off reserve (b)
Total
2,786
939
1,847
Male
1,364
459
905
Female
1,422
480
942
Wood Mountain (388)
Gender
Total (a + b)
On reserve and on Crown land (includes lands affiliated with First Nations operating under self-government agreements) (a)
Off reserve (b)
Total
291
*
*
Male
143
*
*
Female
148
*
*
* Data Suppressed due to low counts
Zagimé Anishinabek (364)
Gender
Total (a + b)
On reserve and on Crown land (includes lands affiliated with First Nations operating under self-government agreements) (a)
Off reserve (b)
Total
1,785
306
1,479
Male
884
163
721
Female
901
143
758
General list - Saskatchewan region - South District (834)
Gender
Total (a + b)
On reserve and on Crown land (includes lands affiliated with First Nations operating under self-government agreements) (a)
Off reserve (b)
Total
*
*
*
Male
*
*
*
Female
*
*
*
* Data Suppressed due to low counts
Responsibility Centre South District
Gender
Total (a + b)
On reserve and on Crown land (includes lands affiliated with First Nations operating under self-government agreements) (a)
Off reserve (b)
Total
49,959
15,471
34,488
Male
24,466
7,971
16,495
Female
25,493
7,500
17,993
Saskatchewan region - 6
Gender
Total (a + b)
On reserve and on Crown land (includes lands affiliated with First Nations operating under self-government agreements) (a)
Off reserve (b)
Total
162,202
78,887
83,315
Male
80,080
40,137
39,943
Female
82,122
38,750
43,372
Region 7 - Alberta
Alberta District
Alexander (438)
Gender
Total (a + b)
On reserve and on Crown land (includes lands affiliated with First Nations operating under self-government agreements) (a)
Off reserve (b)
Total
2,272
1,142
1,130
Male
1,163
586
577
Female
1,109
556
553
Alexis Nakota Sioux Nation (437)
Gender
Total (a + b)
On reserve and on Crown land (includes lands affiliated with First Nations operating under self-government agreements) (a)
Off reserve (b)
Total
2,065
1,237
828
Male
1,055
638
417
Female
1,010
599
411
Athabasca Chipewyan First Nation (463)
Gender
Total (a + b)
On reserve and on Crown land (includes lands affiliated with First Nations operating under self-government agreements) (a)
Off reserve (b)
Total
1,312
255
1,057
Male
641
125
516
Female
671
130
541
Bearspaw (473) - Stoney
Gender
Total (a + b)
On reserve and on Crown land (includes lands affiliated with First Nations operating under self-government agreements) (a)
Off reserve (b)
Total
2,047
1,880
167
Male
1,005
920
85
Female
1,042
960
82
Beaver First Nation (445)
Gender
Total (a + b)
On reserve and on Crown land (includes lands affiliated with First Nations operating under self-government agreements) (a)
Off reserve (b)
Total
1,178
489
689
Male
591
247
344
Female
587
242
345
Bigstone Cree Nation (458)
Gender
Total (a + b)
On reserve and on Crown land (includes lands affiliated with First Nations operating under self-government agreements) (a)
Off reserve (b)
Total
8,294
3,551
4,743
Male
4,049
1,782
2,267
Female
4,245
1,769
2,476
Blood (435)
Gender
Total (a + b)
On reserve and on Crown land (includes lands affiliated with First Nations operating under self-government agreements) (a)
Off reserve (b)
Total
12,728
8,778
3,950
Male
6,285
4,412
1,873
Female
6,443
4,366
2,077
Chiniki (433) - Stoney
Gender
Total (a + b)
On reserve and on Crown land (includes lands affiliated with First Nations operating under self-government agreements) (a)
Off reserve (b)
Total
1,794
1,640
154
Male
899
830
69
Female
895
810
85
Chipewyan Prairie First Nation (470)
Gender
Total (a + b)
On reserve and on Crown land (includes lands affiliated with First Nations operating under self-government agreements) (a)
Off reserve (b)
Total
983
406
577
Male
493
219
274
Female
490
187
303
Dene Tha' (448)
Gender
Total (a + b)
On reserve and on Crown land (includes lands affiliated with First Nations operating under self-government agreements) (a)
Off reserve (b)
Total
3,169
2,171
998
Male
1,547
1,103
444
Female
1,622
1,068
554
Driftpile Cree Nation (450)
Gender
Total (a + b)
On reserve and on Crown land (includes lands affiliated with First Nations operating under self-government agreements) (a)
Off reserve (b)
Total
2,927
1,027
1,900
Male
1,493
558
935
Female
1,434
469
965
Duncan's First Nation (451)
Gender
Total (a + b)
On reserve and on Crown land (includes lands affiliated with First Nations operating under self-government agreements) (a)
Off reserve (b)
Total
339
146
193
Male
175
76
99
Female
164
70
94
Enoch Cree Nation #440 (440)
Gender
Total (a + b)
On reserve and on Crown land (includes lands affiliated with First Nations operating under self-government agreements) (a)
Off reserve (b)
Total
2,794
1,839
955
Male
1,367
928
439
Female
1,427
911
516
Ermineskin Tribe (443)
Gender
Total (a + b)
On reserve and on Crown land (includes lands affiliated with First Nations operating under self-government agreements) (a)
Off reserve (b)
Total
4,920
3,756
1,164
Male
2,451
1,889
562
Female
2,469
1,867
602
Fort McKay First Nation (467)
Gender
Total (a + b)
On reserve and on Crown land (includes lands affiliated with First Nations operating under self-government agreements) (a)
Off reserve (b)
Total
901
438
463
Male
442
215
227
Female
459
223
236
Fort McMurray #468 First Nation (468)
Gender
Total (a + b)
On reserve and on Crown land (includes lands affiliated with First Nations operating under self-government agreements) (a)
Off reserve (b)
Total
879
299
580
Male
405
141
264
Female
474
158
316
Horse Lake First Nation (449)
Gender
Total (a + b)
On reserve and on Crown land (includes lands affiliated with First Nations operating under self-government agreements) (a)
Off reserve (b)
Total
1,264
515
749
Male
631
271
360
Female
633
244
389
Kapawe'no First Nation (452)
Gender
Total (a + b)
On reserve and on Crown land (includes lands affiliated with First Nations operating under self-government agreements) (a)
Off reserve (b)
Total
402
143
259
Male
204
76
128
Female
198
67
131
Little Red River Cree Nation (447)
Gender
Total (a + b)
On reserve and on Crown land (includes lands affiliated with First Nations operating under self-government agreements) (a)
Off reserve (b)
Total
5,997
5,310
687
Male
3,021
2,692
329
Female
2,976
2,618
358
Loon River Cree (476)
Gender
Total (a + b)
On reserve and on Crown land (includes lands affiliated with First Nations operating under self-government agreements) (a)
Off reserve (b)
Total
667
550
117
Male
332
274
58
Female
335
276
59
Louis Bull (439)
Gender
Total (a + b)
On reserve and on Crown land (includes lands affiliated with First Nations operating under self-government agreements) (a)
Off reserve (b)
Total
2,391
1,898
493
Male
1,194
962
232
Female
1,197
936
261
Lubicon Lake (453)
Gender
Total (a + b)
On reserve and on Crown land (includes lands affiliated with First Nations operating under self-government agreements) (a)
Off reserve (b)
Total
755
430
325
Male
396
230
166
Female
359
200
159
Mikisew Cree First Nation (461)
Gender
Total (a + b)
On reserve and on Crown land (includes lands affiliated with First Nations operating under self-government agreements) (a)
Off reserve (b)
Total
3,191
799
2,392
Male
1,553
396
1,157
Female
1,638
403
1,235
Montana (442)
Gender
Total (a + b)
On reserve and on Crown land (includes lands affiliated with First Nations operating under self-government agreements) (a)
Off reserve (b)
Total
1,075
804
271
Male
535
400
135
Female
540
404
136
O'Chiese (431)
Gender
Total (a + b)
On reserve and on Crown land (includes lands affiliated with First Nations operating under self-government agreements) (a)
Off reserve (b)
Total
1,452
995
457
Male
717
493
224
Female
735
502
233
Paul (441)
Gender
Total (a + b)
On reserve and on Crown land (includes lands affiliated with First Nations operating under self-government agreements) (a)
Off reserve (b)
Total
2,181
1,465
716
Male
1,073
733
340
Female
1,108
732
376
Peerless Trout First Nation (478)
Gender
Total (a + b)
On reserve and on Crown land (includes lands affiliated with First Nations operating under self-government agreements) (a)
Off reserve (b)
Total
971
852
119
Male
475
416
59
Female
496
436
60
Piikani Nation (436)
Gender
Total (a + b)
On reserve and on Crown land (includes lands affiliated with First Nations operating under self-government agreements) (a)
Off reserve (b)
Total
3,925
2,493
1,432
Male
1,913
1,238
675
Female
2,012
1,255
757
Samson (444)
Gender
Total (a + b)
On reserve and on Crown land (includes lands affiliated with First Nations operating under self-government agreements) (a)
Off reserve (b)
Total
8,960
6,791
2,169
Male
4,482
3,411
1,071
Female
4,478
3,380
1,098
Sawridge First Nation (454)
Gender
Total (a + b)
On reserve and on Crown land (includes lands affiliated with First Nations operating under self-government agreements) (a)
Off reserve (b)
Total
527
50
477
Male
266
27
239
Female
261
23
238
Siksika Nation (430)
Gender
Total (a + b)
On reserve and on Crown land (includes lands affiliated with First Nations operating under self-government agreements) (a)
Off reserve (b)
Total
7,529
4,324
3,205
Male
3,749
2,188
1,561
Female
3,780
2,136
1,644
Smith's Landing First Nation (477)
Gender
Total (a + b)
On reserve and on Crown land (includes lands affiliated with First Nations operating under self-government agreements) (a)
Off reserve (b)
Total
369
163
206
Male
192
86
106
Female
177
77
100
Sturgeon Lake Cree Nation (455)
Gender
Total (a + b)
On reserve and on Crown land (includes lands affiliated with First Nations operating under self-government agreements) (a)
Off reserve (b)
Total
3,504
1,555
1,949
Male
1,699
799
900
Female
1,805
756
1,049
Sucker Creek (456)
Gender
Total (a + b)
On reserve and on Crown land (includes lands affiliated with First Nations operating under self-government agreements) (a)
Off reserve (b)
Total
2,978
802
2,176
Male
1,443
427
1,016
Female
1,535
375
1,160
Sunchild First Nation (434)
Gender
Total (a + b)
On reserve and on Crown land (includes lands affiliated with First Nations operating under self-government agreements) (a)
Off reserve (b)
Total
1,427
937
490
Male
711
476
235
Female
716
461
255
Swan River First Nation (457)
Gender
Total (a + b)
On reserve and on Crown land (includes lands affiliated with First Nations operating under self-government agreements) (a)
Off reserve (b)
Total
1,478
447
1,031
Male
699
232
467
Female
779
215
564
Tallcree Tribal Government (446)
Gender
Total (a + b)
On reserve and on Crown land (includes lands affiliated with First Nations operating under self-government agreements) (a)
Off reserve (b)
Total
1,392
588
804
Male
697
307
390
Female
695
281
414
Tsuut'ina Nation (432)
Gender
Total (a + b)
On reserve and on Crown land (includes lands affiliated with First Nations operating under self-government agreements) (a)
Off reserve (b)
Total
2,441
2,229
212
Male
1,151
1,067
84
Female
1,290
1,162
128
Wesley (475) - Stoney
Gender
Total (a + b)
On reserve and on Crown land (includes lands affiliated with First Nations operating under self-government agreements) (a)
Off reserve (b)
Total
1,838
1,638
200
Male
939
838
101
Female
899
800
99
Whitefish Lake (459)
Gender
Total (a + b)
On reserve and on Crown land (includes lands affiliated with First Nations operating under self-government agreements) (a)
Off reserve (b)
Total
2,931
1,644
1,287
Male
1,466
822
644
Female
1,465
822
643
Woodland Cree First Nation (474)
Gender
Total (a + b)
On reserve and on Crown land (includes lands affiliated with First Nations operating under self-government agreements) (a)
Off reserve (b)
Total
1,172
859
313
Male
587
423
164
Female
585
436
149
General list - Alberta region - Alberta District (838)
Gender
Total (a + b)
On reserve and on Crown land (includes lands affiliated with First Nations operating under self-government agreements) (a)
Off reserve (b)
Total
976
*
*
Male
442
*
*
Female
534
*
*
* Data Suppressed due to low counts
Responsibility Centre Alberta District
Gender
Total (a + b)
On reserve and on Crown land (includes lands affiliated with First Nations operating under self-government agreements) (a)
Off reserve (b)
Total
110,395
67,339
43,056
Male
54,628
33,954
20,674
Female
55,767
33,385
22,382
St. Paul District
Beaver Lake Cree Nation (460)
Gender
Total (a + b)
On reserve and on Crown land (includes lands affiliated with First Nations operating under self-government agreements) (a)
Off reserve (b)
Total
1,245
439
806
Male
624
233
391
Female
621
206
415
Cold Lake First Nations (464)
Gender
Total (a + b)
On Reserve and On Crown Land (includes lands affiliated with First Nations operating under Self-Government Agreements) (a)
Off Reserve (b)
Total
2,977
1,387
1,590
Male
1,470
750
720
Female
1,507
637
870
Frog Lake (465)
Gender
Total (a + b)
On reserve and on Crown land (includes lands affiliated with First Nations operating under self-government agreements) (a)
Off reserve (b)
Total
3,408
2,150
1,258
Male
1,694
1,088
606
Female
1,714
1,062
652
Heart Lake (469)
Gender
Total (a + b)
On reserve and on Crown land (includes lands affiliated with First Nations operating under self-government agreements) (a)
Off reserve (b)
Total
366
223
143
Male
196
118
78
Female
170
105
65
Kehewin Cree Nation (466)
Gender
Total (a + b)
On reserve and on Crown land (includes lands affiliated with First Nations operating under self-government agreements) (a)
Off reserve (b)
Total
2,254
1,282
972
Male
1,125
681
444
Female
1,129
601
528
Saddle Lake Cree Nation (462)
Gender
Total (a + b)
On reserve and on Crown land (includes lands affiliated with First Nations operating under self-government agreements) (a)
Off reserve (b)
Total
11,052
6,925
4,127
Male
5,445
3,505
1,940
Female
5,607
3,420
2,187
Responsibility Centre St. Paul District
Gender
Total (a + b)
On reserve and on Crown land (includes lands affiliated with First Nations operating under self-government agreements) (a)
Off reserve (b)
Total
21,302
12,406
8,896
Male
10,554
6,375
4,179
Female
10,748
6,031
4,717
Alberta region - 7
Gender
Total (a + b)
On reserve and on Crown land (includes lands affiliated with First Nations operating under self-government agreements) (a)
Off reserve (b)
Total
131,697
79,745
51,952
Male
65,182
40,329
24,853
Female
66,515
39,416
27,099
Region 9 - British Columbia
?Akisq'nuk First Nation (604)
Gender
Total (a + b)
On reserve and on Crown land (includes lands affiliated with First Nations operating under self-government agreements) (a)
Off reserve (b)
Total
280
157
123
Male
147
86
61
Female
133
71
62
?aqam (602)
Gender
Total (a + b)
On reserve and on Crown land (includes lands affiliated with First Nations operating under self-government agreements) (a)
Off reserve (b)
Total
396
219
177
Male
196
109
87
Female
200
110
90
?Esdilagh First Nation (709)
Gender
Total (a + b)
On reserve and on Crown land (includes lands affiliated with First Nations operating under self-government agreements) (a)
Off reserve (b)
Total
254
59
195
Male
132
42
90
Female
122
17
105
Adams Lake (684)
Gender
Total (a + b)
On reserve and on Crown land (includes lands affiliated with First Nations operating under self-government agreements) (a)
Off reserve (b)
Total
807
421
386
Male
392
219
173
Female
415
202
213
Ahousaht (659)
Gender
Total (a + b)
On reserve and on Crown land (includes lands affiliated with First Nations operating under self-government agreements) (a)
Off reserve (b)
Total
2,199
843
1,356
Male
1,070
419
651
Female
1,129
424
705
Aitchelitz (558)
Gender
Total (a + b)
On reserve and on Crown land (includes lands affiliated with First Nations operating under self-government agreements) (a)
Off reserve (b)
Total
42
24
18
Male
25
*
*
Female
17
*
*
* Data Suppressed due to low counts
Ashcroft (685)
Gender
Total (a + b)
On reserve and on Crown land (includes lands affiliated with First Nations operating under self-government agreements) (a)
Off reserve (b)
Total
297
77
220
Male
153
42
111
Female
144
35
109
Beecher Bay (640)
Gender
Total (a + b)
On reserve and on Crown land (includes lands affiliated with First Nations operating under self-government agreements) (a)
Off reserve (b)
Total
260
116
144
Male
118
56
62
Female
142
60
82
Binche Whut'en (730)
Gender
Total (a + b)
On reserve and on Crown land (includes lands affiliated with First Nations operating under self-government agreements) (a)
Off reserve (b)
Total
203
92
111
Male
112
56
56
Female
91
36
55
Blueberry River First Nations (547)
Gender
Total (a + b)
On reserve and on Crown land (includes lands affiliated with First Nations operating under self-government agreements) (a)
Off reserve (b)
Total
508
239
269
Male
255
127
128
Female
253
112
141
Bonaparte (686)
Gender
Total (a + b)
On reserve and on Crown land (includes lands affiliated with First Nations operating under self-government agreements) (a)
Off reserve (b)
Total
960
201
759
Male
459
104
355
Female
501
97
404
Boothroyd (700)
Gender
Total (a + b)
On reserve and on Crown land (includes lands affiliated with First Nations operating under self-government agreements) (a)
Off reserve (b)
Total
310
88
222
Male
163
50
113
Female
147
38
109
Boston Bar First Nation (701)
Gender
Total (a + b)
On reserve and on Crown land (includes lands affiliated with First Nations operating under self-government agreements) (a)
Off reserve (b)
Total
274
90
184
Male
145
49
96
Female
129
41
88
Bridge River (590)
Gender
Total (a + b)
On reserve and on Crown land (includes lands affiliated with First Nations operating under self-government agreements) (a)
Off reserve (b)
Total
477
248
229
Male
234
115
119
Female
243
133
110
Burns Lake (619)
Gender
Total (a + b)
On reserve and on Crown land (includes lands affiliated with First Nations operating under self-government agreements) (a)
Off reserve (b)
Total
143
47
96
Male
74
26
48
Female
69
21
48
Campbell River (622)
Gender
Total (a + b)
On reserve and on Crown land (includes lands affiliated with First Nations operating under self-government agreements) (a)
Off reserve (b)
Total
842
404
438
Male
402
204
198
Female
440
200
240
Canim Lake (713)
Gender
Total (a + b)
On reserve and on Crown land (includes lands affiliated with First Nations operating under self-government agreements) (a)
Off reserve (b)
Total
610
433
177
Male
303
218
85
Female
307
215
92
Cape Mudge (623)
Gender
Total (a + b)
On reserve and on Crown land (includes lands affiliated with First Nations operating under self-government agreements) (a)
Off reserve (b)
Total
1,154
366
788
Male
554
196
358
Female
600
170
430
Cayoose Creek (591)
Gender
Total (a + b)
On reserve and on Crown land (includes lands affiliated with First Nations operating under self-government agreements) (a)
Off reserve (b)
Total
204
89
115
Male
100
44
56
Female
104
45
59
Chawathil (583)
Gender
Total (a + b)
On reserve and on Crown land (includes lands affiliated with First Nations operating under self-government agreements) (a)
Off reserve (b)
Total
634
383
251
Male
310
190
120
Female
324
193
131
Cheam (584)
Gender
Total (a + b)
On reserve and on Crown land (includes lands affiliated with First Nations operating under self-government agreements) (a)
Off reserve (b)
Total
559
255
304
Male
282
130
152
Female
277
125
152
Cheslatta Carrier Nation (620)
Gender
Total (a + b)
On reserve and on Crown land (includes lands affiliated with First Nations operating under self-government agreements) (a)
Off reserve (b)
Total
371
166
205
Male
171
82
89
Female
200
84
116
Coldwater (693)
Gender
Total (a + b)
On reserve and on Crown land (includes lands affiliated with First Nations operating under self-government agreements) (a)
Off reserve (b)
Total
862
383
479
Male
417
188
229
Female
445
195
250
Cook's Ferry (694)
Gender
Total (a + b)
On reserve and on Crown land (includes lands affiliated with First Nations operating under self-government agreements) (a)
Off reserve (b)
Total
356
79
277
Male
173
41
132
Female
183
38
145
Cowichan (642)
Gender
Total (a + b)
On reserve and on Crown land (includes lands affiliated with First Nations operating under self-government agreements) (a)
Off reserve (b)
Total
5,069
2,861
2,208
Male
2,510
1,456
1,054
Female
2,559
1,405
1,154
Da'naxda'xw First Nation (635)
Gender
Total (a + b)
On reserve and on Crown land (includes lands affiliated with First Nations operating under self-government agreements) (a)
Off reserve (b)
Total
234
53
181
Male
114
25
89
Female
120
28
92
Ditidaht (662)
Gender
Total (a + b)
On reserve and on Crown land (includes lands affiliated with First Nations operating under self-government agreements) (a)
Off reserve (b)
Total
779
235
544
Male
377
125
252
Female
402
110
292
Doig River First Nation (548)
Gender
Total (a + b)
On reserve and on Crown land (includes lands affiliated with First Nations operating under self-government agreements) (a)
Off reserve (b)
Total
313
147
166
Male
160
82
78
Female
153
65
88
Douglas (561)
Gender
Total (a + b)
On reserve and on Crown land (includes lands affiliated with First Nations operating under self-government agreements) (a)
Off reserve (b)
Total
350
121
229
Male
166
66
100
Female
184
55
129
Dzawada'enuxw First Nation (636)
Gender
Total (a + b)
On reserve and on Crown land (includes lands affiliated with First Nations operating under self-government agreements) (a)
Off reserve (b)
Total
544
147
397
Male
269
77
192
Female
275
70
205
Ehattesaht (634)
Gender
Total (a + b)
On reserve and on Crown land (includes lands affiliated with First Nations operating under self-government agreements) (a)
Off reserve (b)
Total
520
164
356
Male
260
82
178
Female
260
82
178
Esk'etemc (711)
Gender
Total (a + b)
On reserve and on Crown land (includes lands affiliated with First Nations operating under self-government agreements) (a)
Off reserve (b)
Total
1,027
445
582
Male
530
231
299
Female
497
214
283
Esquimalt (644)
Gender
Total (a + b)
On reserve and on Crown land (includes lands affiliated with First Nations operating under self-government agreements) (a)
Off reserve (b)
Total
331
200
131
Male
156
101
55
Female
175
99
76
Fort Nelson First Nation (543)
Gender
Total (a + b)
On reserve and on Crown land (includes lands affiliated with First Nations operating under self-government agreements) (a)
Off reserve (b)
Total
975
445
530
Male
488
234
254
Female
487
211
276
Gitanmaax (531)
Gender
Total (a + b)
On reserve and on Crown land (includes lands affiliated with First Nations operating under self-government agreements) (a)
Off reserve (b)
Total
2,462
801
1,661
Male
1,225
412
813
Female
1,237
389
848
Gitanyow (537)
Gender
Total (a + b)
On reserve and on Crown land (includes lands affiliated with First Nations operating under self-government agreements) (a)
Off reserve (b)
Total
875
414
461
Male
456
208
248
Female
419
206
213
Gitga'at First Nation (675)
Gender
Total (a + b)
On reserve and on Crown land (includes lands affiliated with First Nations operating under self-government agreements) (a)
Off reserve (b)
Total
778
158
620
Male
368
78
290
Female
410
80
330
Gitsegukla (535)
Gender
Total (a + b)
On reserve and on Crown land (includes lands affiliated with First Nations operating under self-government agreements) (a)
Off reserve (b)
Total
1,017
461
556
Male
519
235
284
Female
498
226
272
Gitwangak (536)
Gender
Total (a + b)
On reserve and on Crown land (includes lands affiliated with First Nations operating under self-government agreements) (a)
Off reserve (b)
Total
1,369
449
920
Male
677
239
438
Female
692
210
482
Gitxaala Nation (672)
Gender
Total (a + b)
On reserve and on Crown land (includes lands affiliated with First Nations operating under self-government agreements) (a)
Off reserve (b)
Total
2,018
477
1,541
Male
988
259
729
Female
1,030
218
812
Glen Vowell (533)
Gender
Total (a + b)
On reserve and on Crown land (includes lands affiliated with First Nations operating under self-government agreements) (a)
Off reserve (b)
Total
424
206
218
Male
229
119
110
Female
195
87
108
Gwa'Sala-Nakwaxda'xw (724)
Gender
Total (a + b)
On reserve and on Crown land (includes lands affiliated with First Nations operating under self-government agreements) (a)
Off reserve (b)
Total
1,034
604
430
Male
520
325
195
Female
514
279
235
Gwawaenuk Tribe (627)
Gender
Total (a + b)
On reserve and on Crown land (includes lands affiliated with First Nations operating under self-government agreements) (a)
Off reserve (b)
Total
41
12
29
Male
23
*
*
Female
18
*
*
* Data Suppressed due to low counts
Hagwilget First Nation Government (534)
Gender
Total (a + b)
On reserve and on Crown land (includes lands affiliated with First Nations operating under self-government agreements) (a)
Off reserve (b)
Total
795
231
564
Male
405
121
284
Female
390
110
280
Haisla Nation (676)
Gender
Total (a + b)
On reserve and on Crown land (includes lands affiliated with First Nations operating under self-government agreements) (a)
Off reserve (b)
Total
1,956
671
1,285
Male
949
372
577
Female
1,007
299
708
Halalt (645)
Gender
Total (a + b)
On reserve and on Crown land (includes lands affiliated with First Nations operating under self-government agreements) (a)
Off reserve (b)
Total
213
97
116
Male
113
52
61
Female
100
45
55
Halfway River First Nation (546)
Gender
Total (a + b)
On reserve and on Crown land (includes lands affiliated with First Nations operating under self-government agreements) (a)
Off reserve (b)
Total
290
151
139
Male
152
83
69
Female
138
68
70
Heiltsuk (538)
Gender
Total (a + b)
On reserve and on Crown land (includes lands affiliated with First Nations operating under self-government agreements) (a)
Off reserve (b)
Total
2,470
1,236
1,234
Male
1,264
667
597
Female
1,206
569
637
Hesquiaht (661)
Gender
Total (a + b)
On reserve and on Crown land (includes lands affiliated with First Nations operating under self-government agreements) (a)
Off reserve (b)
Total
744
154
590
Male
350
86
264
Female
394
68
326
High Bar (703)
Gender
Total (a + b)
On reserve and on Crown land (includes lands affiliated with First Nations operating under self-government agreements) (a)
Off reserve (b)
Total
179
*
*
Male
85
*
*
Female
94
*
*
* Data Suppressed due to low counts
Homalco (552)
Gender
Total (a + b)
On reserve and on Crown land (includes lands affiliated with First Nations operating under self-government agreements) (a)
Off reserve (b)
Total
474
238
236
Male
248
131
117
Female
226
107
119
Hupacasath First Nation (664)
Gender
Total (a + b)
On reserve and on Crown land (includes lands affiliated with First Nations operating under self-government agreements) (a)
Off reserve (b)
Total
338
151
187
Male
175
70
105
Female
163
81
82
Huu-ay-aht First Nations (663)
Gender
Total (a + b)
On reserve and on Crown land (includes lands affiliated with First Nations operating under self-government agreements) (a)
Off reserve (b)
Total
727
134
593
Male
354
66
288
Female
373
68
305
Iskut (683)
Gender
Total (a + b)
On reserve and on Crown land (includes lands affiliated with First Nations operating under self-government agreements) (a)
Off reserve (b)
Total
789
365
424
Male
403
196
207
Female
386
169
217
Ka:'yu:'k't'h'/Che:k:tles7et'h' First Nations (638)
Gender
Total (a + b)
On reserve and on Crown land (includes lands affiliated with First Nations operating under self-government agreements) (a)
Off reserve (b)
Total
582
185
397
Male
286
90
196
Female
296
95
201
Kanaka Bar (704)
Gender
Total (a + b)
On reserve and on Crown land (includes lands affiliated with First Nations operating under self-government agreements) (a)
Off reserve (b)
Total
240
78
162
Male
134
44
90
Female
106
34
72
Katzie (563)
Gender
Total (a + b)
On reserve and on Crown land (includes lands affiliated with First Nations operating under self-government agreements) (a)
Off reserve (b)
Total
602
317
285
Male
292
159
133
Female
310
158
152
Kispiox (532)
Gender
Total (a + b)
On reserve and on Crown land (includes lands affiliated with First Nations operating under self-government agreements) (a)
Off reserve (b)
Total
1,661
671
990
Male
804
353
451
Female
857
318
539
Kitasoo (540)
Gender
Total (a + b)
On reserve and on Crown land (includes lands affiliated with First Nations operating under self-government agreements) (a)
Off reserve (b)
Total
509
308
201
Male
251
165
86
Female
258
143
115
Kitselas (680)
Gender
Total (a + b)
On reserve and on Crown land (includes lands affiliated with First Nations operating under self-government agreements) (a)
Off reserve (b)
Total
692
319
373
Male
320
148
172
Female
372
171
201
Kitsumkalum (681)
Gender
Total (a + b)
On reserve and on Crown land (includes lands affiliated with First Nations operating under self-government agreements) (a)
Off reserve (b)
Total
775
256
519
Male
382
133
249
Female
393
123
270
Klahoose First Nation (553)
Gender
Total (a + b)
On reserve and on Crown land (includes lands affiliated with First Nations operating under self-government agreements) (a)
Off reserve (b)
Total
413
82
331
Male
203
41
162
Female
210
41
169
K'ómoks First Nation (624)
Gender
Total (a + b)
On reserve and on Crown land (includes lands affiliated with First Nations operating under self-government agreements) (a)
Off reserve (b)
Total
340
110
230
Male
160
45
115
Female
180
65
115
Kwadacha (610)
Gender
Total (a + b)
On reserve and on Crown land (includes lands affiliated with First Nations operating under self-government agreements) (a)
Off reserve (b)
Total
569
312
257
Male
275
157
118
Female
294
155
139
Kwakiutl (626)
Gender
Total (a + b)
On reserve and on Crown land (includes lands affiliated with First Nations operating under self-government agreements) (a)
Off reserve (b)
Total
827
361
466
Male
415
188
227
Female
412
173
239
Kwantlen First Nation (564)
Gender
Total (a + b)
On reserve and on Crown land (includes lands affiliated with First Nations operating under self-government agreements) (a)
Off reserve (b)
Total
302
107
195
Male
155
58
97
Female
147
49
98
Kwaw-kwaw-Apilt (580)
Gender
Total (a + b)
On reserve and on Crown land (includes lands affiliated with First Nations operating under self-government agreements) (a)
Off reserve (b)
Total
47
33
14
Male
27
*
*
Female
20
*
*
* Data Suppressed due to low counts
Kwiakah (628)
Gender
Total (a + b)
On reserve and on Crown land (includes lands affiliated with First Nations operating under self-government agreements) (a)
Off reserve (b)
Total
*
*
*
Male
*
*
*
Female
*
*
*
* Data Suppressed due to low counts
Kwikwasut'inuxw Haxwa'mis (625)
Gender
Total (a + b)
On reserve and on Crown land (includes lands affiliated with First Nations operating under self-government agreements) (a)
Off reserve (b)
Total
310
74
236
Male
167
42
125
Female
143
32
111
Kwikwetlem First Nation (560)
Gender
Total (a + b)
On reserve and on Crown land (includes lands affiliated with First Nations operating under self-government agreements) (a)
Off reserve (b)
Total
117
46
71
Male
70
31
39
Female
47
15
32
Lake Babine Nation (607)
Gender
Total (a + b)
On reserve and on Crown land (includes lands affiliated with First Nations operating under self-government agreements) (a)
Off reserve (b)
Total
2,549
1,402
1,147
Male
1,229
719
510
Female
1,320
683
637
Lax Kw'alaams (674)
Gender
Total (a + b)
On reserve and on Crown land (includes lands affiliated with First Nations operating under self-government agreements) (a)
Off reserve (b)
Total
3,918
731
3,187
Male
1,925
394
1,531
Female
1,993
337
1,656
Leq'á:mel First Nation (579)
Gender
Total (a + b)
On reserve and on Crown land (includes lands affiliated with First Nations operating under self-government agreements) (a)
Off reserve (b)
Total
431
145
286
Male
199
70
129
Female
232
75
157
Lheidli T'enneh (611)
Gender
Total (a + b)
On reserve and on Crown land (includes lands affiliated with First Nations operating under self-government agreements) (a)
Off reserve (b)
Total
468
101
367
Male
237
52
185
Female
231
49
182
Lhoosk'uz Dene Nation (721)
Gender
Total (a + b)
On reserve and on Crown land (includes lands affiliated with First Nations operating under self-government agreements) (a)
Off reserve (b)
Total
242
58
184
Male
113
31
82
Female
129
27
102
Lhtako Dene Nation (715)
Gender
Total (a + b)
On reserve and on Crown land (includes lands affiliated with First Nations operating under self-government agreements) (a)
Off reserve (b)
Total
183
89
94
Male
71
36
35
Female
112
53
59
Lil'wat Nation (557)
Gender
Total (a + b)
On reserve and on Crown land (includes lands affiliated with First Nations operating under self-government agreements) (a)
Off reserve (b)
Total
2,241
1,559
682
Male
1,135
810
325
Female
1,106
749
357
Little Shuswap Lake (689)
Gender
Total (a + b)
On reserve and on Crown land (includes lands affiliated with First Nations operating under self-government agreements) (a)
Off reserve (b)
Total
358
237
121
Male
191
129
62
Female
167
108
59
Lower Kootenay (606)
Gender
Total (a + b)
On reserve and on Crown land (includes lands affiliated with First Nations operating under self-government agreements) (a)
Off reserve (b)
Total
245
123
122
Male
115
60
55
Female
130
63
67
Lower Nicola (695)
Gender
Total (a + b)
On reserve and on Crown land (includes lands affiliated with First Nations operating under self-government agreements) (a)
Off reserve (b)
Total
1,286
548
738
Male
605
280
325
Female
681
268
413
Lower Similkameen (598)
Gender
Total (a + b)
On reserve and on Crown land (includes lands affiliated with First Nations operating under self-government agreements) (a)
Off reserve (b)
Total
527
280
247
Male
255
136
119
Female
272
144
128
Lyackson (646)
Gender
Total (a + b)
On reserve and on Crown land (includes lands affiliated with First Nations operating under self-government agreements) (a)
Off reserve (b)
Total
216
37
179
Male
102
19
83
Female
114
18
96
Lytton (705)
Gender
Total (a + b)
On reserve and on Crown land (includes lands affiliated with First Nations operating under self-government agreements) (a)
Off reserve (b)
Total
2,050
941
1,109
Male
1,005
490
515
Female
1,045
451
594
Malahat Nation (647)
Gender
Total (a + b)
On reserve and on Crown land (includes lands affiliated with First Nations operating under self-government agreements) (a)
Off reserve (b)
Total
346
189
157
Male
185
102
83
Female
161
87
74
Mamalilikulla First Nation (629)
Gender
Total (a + b)
On reserve and on Crown land (includes lands affiliated with First Nations operating under self-government agreements) (a)
Off reserve (b)
Total
437
66
371
Male
217
30
187
Female
220
36
184
Matsqui First Nation (565)
Gender
Total (a + b)
On reserve and on Crown land (includes lands affiliated with First Nations operating under self-government agreements) (a)
Off reserve (b)
Total
262
113
149
Male
125
55
70
Female
137
58
79
McLeod Lake (618)
Gender
Total (a + b)
On reserve and on Crown land (includes lands affiliated with First Nations operating under self-government agreements) (a)
Off reserve (b)
Total
571
142
429
Male
266
75
191
Female
305
67
238
Metlakatla First Nation (673)
Gender
Total (a + b)
On reserve and on Crown land (includes lands affiliated with First Nations operating under self-government agreements) (a)
Off reserve (b)
Total
989
108
881
Male
477
47
430
Female
512
61
451
Mowachaht/Muchalaht (630)
Gender
Total (a + b)
On reserve and on Crown land (includes lands affiliated with First Nations operating under self-government agreements) (a)
Off reserve (b)
Total
609
253
356
Male
333
146
187
Female
276
107
169
Musqueam (550)
Gender
Total (a + b)
On reserve and on Crown land (includes lands affiliated with First Nations operating under self-government agreements) (a)
Off reserve (b)
Total
1,410
788
622
Male
676
385
291
Female
734
403
331
Nadleh Whuten (612)
Gender
Total (a + b)
On reserve and on Crown land (includes lands affiliated with First Nations operating under self-government agreements) (a)
Off reserve (b)
Total
568
276
292
Male
294
151
143
Female
274
125
149
Nak'azdli Whut'en (614)
Gender
Total (a + b)
On reserve and on Crown land (includes lands affiliated with First Nations operating under self-government agreements) (a)
Off reserve (b)
Total
1,993
771
1,222
Male
999
406
593
Female
994
365
629
Namgis First Nation (631)
Gender
Total (a + b)
On reserve and on Crown land (includes lands affiliated with First Nations operating under self-government agreements) (a)
Off reserve (b)
Total
1,894
962
932
Male
923
481
442
Female
971
481
490
Nanoose First Nation (649)
Gender
Total (a + b)
On reserve and on Crown land (includes lands affiliated with First Nations operating under self-government agreements) (a)
Off reserve (b)
Total
265
188
77
Male
121
85
36
Female
144
103
41
Nazko First Nation (720)
Gender
Total (a + b)
On reserve and on Crown land (includes lands affiliated with First Nations operating under self-government agreements) (a)
Off reserve (b)
Total
405
130
275
Male
207
76
131
Female
198
54
144
Nee-Tahi-Buhn (726)
Gender
Total (a + b)
On reserve and on Crown land (includes lands affiliated with First Nations operating under self-government agreements) (a)
Off reserve (b)
Total
152
55
97
Male
72
33
39
Female
80
22
58
Neskonlith (690)
Gender
Total (a + b)
On reserve and on Crown land (includes lands affiliated with First Nations operating under self-government agreements) (a)
Off reserve (b)
Total
663
318
345
Male
341
168
173
Female
322
150
172
New Westminster (566)
Gender
Total (a + b)
On reserve and on Crown land (includes lands affiliated with First Nations operating under self-government agreements) (a)
Off reserve (b)
Total
*
*
*
Male
*
*
*
Female
*
*
*
* Data Suppressed due to low counts
Nicomen (696)
Gender
Total (a + b)
On reserve and on Crown land (includes lands affiliated with First Nations operating under self-government agreements) (a)
Off reserve (b)
Total
130
64
66
Male
73
34
39
Female
57
30
27
Nisga'a Village of Gingolx (671)
Gender
Total (a + b)
On reserve and on Crown land (includes lands affiliated with First Nations operating under self-government agreements) (a)
Off reserve (b)
Total
2,019
478
1,541
Male
1,030
261
769
Female
989
217
772
Nisga'a Village of Gitwinksihlkw (679)
Gender
Total (a + b)
On reserve and on Crown land (includes lands affiliated with First Nations operating under self-government agreements) (a)
Off reserve (b)
Total
392
209
183
Male
189
96
93
Female
203
113
90
Nisga'a Village of Laxgalt'sap (678)
Gender
Total (a + b)
On reserve and on Crown land (includes lands affiliated with First Nations operating under self-government agreements) (a)
Off reserve (b)
Total
1,828
661
1,167
Male
923
371
552
Female
905
290
615
Nisga'a Village of New Aiyansh (677)
Gender
Total (a + b)
On reserve and on Crown land (includes lands affiliated with First Nations operating under self-government agreements) (a)
Off reserve (b)
Total
1,870
928
942
Male
962
500
462
Female
908
428
480
Nooaitch (699)
Gender
Total (a + b)
On reserve and on Crown land (includes lands affiliated with First Nations operating under self-government agreements) (a)
Off reserve (b)
Total
234
126
108
Male
117
64
53
Female
117
62
55
N'Quatqua (556)
Gender
Total (a + b)
On reserve and on Crown land (includes lands affiliated with First Nations operating under self-government agreements) (a)
Off reserve (b)
Total
366
206
160
Male
185
105
80
Female
181
101
80
Nuchatlaht (639)
Gender
Total (a + b)
On reserve and on Crown land (includes lands affiliated with First Nations operating under self-government agreements) (a)
Off reserve (b)
Total
163
31
132
Male
71
14
57
Female
92
17
75
Nuxalk Nation (539)
Gender
Total (a + b)
On reserve and on Crown land (includes lands affiliated with First Nations operating under self-government agreements) (a)
Off reserve (b)
Total
1,739
937
802
Male
834
479
355
Female
905
458
447
Okanagan (616)
Gender
Total (a + b)
On reserve and on Crown land (includes lands affiliated with First Nations operating under self-government agreements) (a)
Off reserve (b)
Total
2,057
909
1,148
Male
1,007
471
536
Female
1,050
438
612
Old Massett Village Council (669)
Gender
Total (a + b)
On reserve and on Crown land (includes lands affiliated with First Nations operating under self-government agreements) (a)
Off reserve (b)
Total
3,110
772
2,338
Male
1,533
417
1,116
Female
1,577
355
1,222
Oregon Jack Creek (692)
Gender
Total (a + b)
On reserve and on Crown land (includes lands affiliated with First Nations operating under self-government agreements) (a)
Off reserve (b)
Total
69
23
46
Male
30
*
*
Female
39
*
*
* Data Suppressed due to low counts
Osoyoos (596)
Gender
Total (a + b)
On reserve and on Crown land (includes lands affiliated with First Nations operating under self-government agreements) (a)
Off reserve (b)
Total
549
391
158
Male
278
211
67
Female
271
180
91
Pacheedaht First Nation (658)
Gender
Total (a + b)
On reserve and on Crown land (includes lands affiliated with First Nations operating under self-government agreements) (a)
Off reserve (b)
Total
289
126
163
Male
123
59
64
Female
166
67
99
Pauquachin (652)
Gender
Total (a + b)
On reserve and on Crown land (includes lands affiliated with First Nations operating under self-government agreements) (a)
Off reserve (b)
Total
404
259
145
Male
180
133
47
Female
224
126
98
Penelakut Tribe (650)
Gender
Total (a + b)
On reserve and on Crown land (includes lands affiliated with First Nations operating under self-government agreements) (a)
Off reserve (b)
Total
1,004
602
402
Male
508
311
197
Female
496
291
205
Penticton (597)
Gender
Total (a + b)
On reserve and on Crown land (includes lands affiliated with First Nations operating under self-government agreements) (a)
Off reserve (b)
Total
1,078
638
440
Male
535
316
219
Female
543
322
221
Peters First Nation (586)
Gender
Total (a + b)
On reserve and on Crown land (includes lands affiliated with First Nations operating under self-government agreements) (a)
Off reserve (b)
Total
169
48
121
Male
85
25
60
Female
84
23
61
Popkum (585)
Gender
Total (a + b)
On reserve and on Crown land (includes lands affiliated with First Nations operating under self-government agreements) (a)
Off reserve (b)
Total
*
*
*
Male
*
*
*
Female
*
*
*
* Data Suppressed due to low counts
Prophet River First Nation (544)
Gender
Total (a + b)
On reserve and on Crown land (includes lands affiliated with First Nations operating under self-government agreements) (a)
Off reserve (b)
Total
292
109
183
Male
147
60
87
Female
145
49
96
Qualicum First Nation (651)
Gender
Total (a + b)
On reserve and on Crown land (includes lands affiliated with First Nations operating under self-government agreements) (a)
Off reserve (b)
Total
130
57
73
Male
54
29
25
Female
76
28
48
Quatsino (633)
Gender
Total (a + b)
On reserve and on Crown land (includes lands affiliated with First Nations operating under self-government agreements) (a)
Off reserve (b)
Total
582
260
322
Male
288
138
150
Female
294
122
172
Saik'uz First Nation (615)
Gender
Total (a + b)
On reserve and on Crown land (includes lands affiliated with First Nations operating under self-government agreements) (a)
Off reserve (b)
Total
973
345
628
Male
457
181
276
Female
516
164
352
Samahquam (567)
Gender
Total (a + b)
On reserve and on Crown land (includes lands affiliated with First Nations operating under self-government agreements) (a)
Off reserve (b)
Total
377
116
261
Male
182
63
119
Female
195
53
142
Saulteau First Nations (542)
Gender
Total (a + b)
On reserve and on Crown land (includes lands affiliated with First Nations operating under self-government agreements) (a)
Off reserve (b)
Total
1,135
406
729
Male
539
200
339
Female
596
206
390
Seabird Island (581)
Gender
Total (a + b)
On reserve and on Crown land (includes lands affiliated with First Nations operating under self-government agreements) (a)
Off reserve (b)
Total
1,045
661
384
Male
506
323
183
Female
539
338
201
Sechelt (551)
Gender
Total (a + b)
On reserve and on Crown land (includes lands affiliated with First Nations operating under self-government agreements) (a)
Off reserve (b)
Total
1,424
654
770
Male
726
355
371
Female
698
299
399
Semiahmoo (569)
Gender
Total (a + b)
On reserve and on Crown land (includes lands affiliated with First Nations operating under self-government agreements) (a)
Off reserve (b)
Total
98
57
41
Male
45
27
18
Female
53
30
23
Shackan (698)
Gender
Total (a + b)
On reserve and on Crown land (includes lands affiliated with First Nations operating under self-government agreements) (a)
Off reserve (b)
Total
133
75
58
Male
73
44
29
Female
60
31
29
Shuswap (605)
Gender
Total (a + b)
On reserve and on Crown land (includes lands affiliated with First Nations operating under self-government agreements) (a)
Off reserve (b)
Total
268
116
152
Male
129
60
69
Female
139
56
83
Shxwhá:y Village (570)
Gender
Total (a + b)
On reserve and on Crown land (includes lands affiliated with First Nations operating under self-government agreements) (a)
Off reserve (b)
Total
448
123
325
Male
226
61
165
Female
222
62
160
Shxw'ow'hamel First Nation (587)
Gender
Total (a + b)
On reserve and on Crown land (includes lands affiliated with First Nations operating under self-government agreements) (a)
Off reserve (b)
Total
200
106
94
Male
102
56
46
Female
98
50
48
Simpcw First Nation (691)
Gender
Total (a + b)
On reserve and on Crown land (includes lands affiliated with First Nations operating under self-government agreements) (a)
Off reserve (b)
Total
737
243
494
Male
348
123
225
Female
389
120
269
Siska (706)
Gender
Total (a + b)
On reserve and on Crown land (includes lands affiliated with First Nations operating under self-government agreements) (a)
Off reserve (b)
Total
325
111
214
Male
160
57
103
Female
165
54
111
Skatin Nations (562)
Gender
Total (a + b)
On reserve and on Crown land (includes lands affiliated with First Nations operating under self-government agreements) (a)
Off reserve (b)
Total
419
140
279
Male
225
83
142
Female
194
57
137
Skawahlook First Nation (582)
Gender
Total (a + b)
On reserve and on Crown land (includes lands affiliated with First Nations operating under self-government agreements) (a)
Off reserve (b)
Total
92
13
79
Male
43
*
*
Female
49
*
*
* Data Suppressed due to low counts
Skeetchestn (687)
Gender
Total (a + b)
On reserve and on Crown land (includes lands affiliated with First Nations operating under self-government agreements) (a)
Off reserve (b)
Total
545
254
291
Male
274
133
141
Female
271
121
150
Skidegate (670)
Gender
Total (a + b)
On reserve and on Crown land (includes lands affiliated with First Nations operating under self-government agreements) (a)
Off reserve (b)
Total
1,671
691
980
Male
810
331
479
Female
861
360
501
Skin Tyee (729)
Gender
Total (a + b)
On reserve and on Crown land (includes lands affiliated with First Nations operating under self-government agreements) (a)
Off reserve (b)
Total
187
58
129
Male
108
30
78
Female
79
28
51
Skowkale (571)
Gender
Total (a + b)
On reserve and on Crown land (includes lands affiliated with First Nations operating under self-government agreements) (a)
Off reserve (b)
Total
275
199
76
Male
127
91
36
Female
148
108
40
Skuppah (707)
Gender
Total (a + b)
On reserve and on Crown land (includes lands affiliated with First Nations operating under self-government agreements) (a)
Off reserve (b)
Total
124
63
61
Male
56
35
21
Female
68
28
40
Skwah (573)
Gender
Total (a + b)
On reserve and on Crown land (includes lands affiliated with First Nations operating under self-government agreements) (a)
Off reserve (b)
Total
670
275
395
Male
324
138
186
Female
346
137
209
Snuneymuxw First Nation (648)
Gender
Total (a + b)
On reserve and on Crown land (includes lands affiliated with First Nations operating under self-government agreements) (a)
Off reserve (b)
Total
1,842
713
1,129
Male
912
364
548
Female
930
349
581
Soda Creek (716)
Gender
Total (a + b)
On reserve and on Crown land (includes lands affiliated with First Nations operating under self-government agreements) (a)
Off reserve (b)
Total
441
170
271
Male
219
89
130
Female
222
81
141
Songhees Nation (656)
Gender
Total (a + b)
On reserve and on Crown land (includes lands affiliated with First Nations operating under self-government agreements) (a)
Off reserve (b)
Total
588
383
205
Male
286
187
99
Female
302
196
106
Soowahlie (572)
Gender
Total (a + b)
On reserve and on Crown land (includes lands affiliated with First Nations operating under self-government agreements) (a)
Off reserve (b)
Total
388
196
192
Male
185
103
82
Female
203
93
110
Splatsin (600)
Gender
Total (a + b)
On reserve and on Crown land (includes lands affiliated with First Nations operating under self-government agreements) (a)
Off reserve (b)
Total
907
398
509
Male
432
210
222
Female
475
188
287
Spuzzum (708)
Gender
Total (a + b)
On reserve and on Crown land (includes lands affiliated with First Nations operating under self-government agreements) (a)
Off reserve (b)
Total
326
51
275
Male
163
32
131
Female
163
19
144
Sq'éwlets (568)
Gender
Total (a + b)
On reserve and on Crown land (includes lands affiliated with First Nations operating under self-government agreements) (a)
Off reserve (b)
Total
277
118
159
Male
145
67
78
Female
132
51
81
Squamish (555)
Gender
Total (a + b)
On reserve and on Crown land (includes lands affiliated with First Nations operating under self-government agreements) (a)
Off reserve (b)
Total
4,275
2,404
1,871
Male
2,071
1,175
896
Female
2,204
1,229
975
Squiala First Nation (574)
Gender
Total (a + b)
On reserve and on Crown land (includes lands affiliated with First Nations operating under self-government agreements) (a)
Off reserve (b)
Total
222
149
73
Male
127
86
41
Female
95
63
32
Stellat'en First Nation (613)
Gender
Total (a + b)
On reserve and on Crown land (includes lands affiliated with First Nations operating under self-government agreements) (a)
Off reserve (b)
Total
571
229
342
Male
284
122
162
Female
287
107
180
Sts'ailes (559)
Gender
Total (a + b)
On reserve and on Crown land (includes lands affiliated with First Nations operating under self-government agreements) (a)
Off reserve (b)
Total
1,094
560
534
Male
549
295
254
Female
545
265
280
Stswecem'c Xgat'tem First Nation (723)
Gender
Total (a + b)
On reserve and on Crown land (includes lands affiliated with First Nations operating under self-government agreements) (a)
Off reserve (b)
Total
773
300
473
Male
406
165
241
Female
367
135
232
Stz'uminus First Nation (641)
Gender
Total (a + b)
On reserve and on Crown land (includes lands affiliated with First Nations operating under self-government agreements) (a)
Off reserve (b)
Total
1,367
880
487
Male
662
457
205
Female
705
423
282
Sumas First Nation (578)
Gender
Total (a + b)
On reserve and on Crown land (includes lands affiliated with First Nations operating under self-government agreements) (a)
Off reserve (b)
Total
346
181
165
Male
163
86
77
Female
183
95
88
Tahltan (682)
Gender
Total (a + b)
On reserve and on Crown land (includes lands affiliated with First Nations operating under self-government agreements) (a)
Off reserve (b)
Total
1,977
334
1,643
Male
973
176
797
Female
1,004
158
846
Takla Nation (608)
Gender
Total (a + b)
On reserve and on Crown land (includes lands affiliated with First Nations operating under self-government agreements) (a)
Off reserve (b)
Total
845
222
623
Male
394
120
274
Female
451
102
349
T'it'q'et (593)
Gender
Total (a + b)
On reserve and on Crown land (includes lands affiliated with First Nations operating under self-government agreements) (a)
Off reserve (b)
Total
444
212
232
Male
221
104
117
Female
223
108
115
Tk'emlúps te Secwépemc (688)
Gender
Total (a + b)
On reserve and on Crown land (includes lands affiliated with First Nations operating under self-government agreements) (a)
Off reserve (b)
Total
1,384
667
717
Male
652
329
323
Female
732
338
394
Tl'etinqox Government (712)
Gender
Total (a + b)
On reserve and on Crown land (includes lands affiliated with First Nations operating under self-government agreements) (a)
Off reserve (b)
Total
1,629
592
1,037
Male
797
330
467
Female
832
262
570
Tla'amin Nation (554)
Gender
Total (a + b)
On reserve and on Crown land (includes lands affiliated with First Nations operating under self-government agreements) (a)
Off reserve (b)
Total
1,154
626
528
Male
567
313
254
Female
587
313
274
Tla-o-qui-aht First Nations (660)
Gender
Total (a + b)
On reserve and on Crown land (includes lands affiliated with First Nations operating under self-government agreements) (a)
Off reserve (b)
Total
1,155
433
722
Male
574
224
350
Female
581
209
372
Tlatlasikwala (632)
Gender
Total (a + b)
On reserve and on Crown land (includes lands affiliated with First Nations operating under self-government agreements) (a)
Off reserve (b)
Total
65
43
22
Male
32
22
10
Female
33
21
12
Tl'azt'en Nation (617)
Gender
Total (a + b)
On reserve and on Crown land (includes lands affiliated with First Nations operating under self-government agreements) (a)
Off reserve (b)
Total
1,611
510
1,101
Male
813
276
537
Female
798
234
564
Tlowitsis Tribe (637)
Gender
Total (a + b)
On reserve and on Crown land (includes lands affiliated with First Nations operating under self-government agreements) (a)
Off reserve (b)
Total
434
68
366
Male
213
36
177
Female
221
32
189
Tobacco Plains (603)
Gender
Total (a + b)
On reserve and on Crown land (includes lands affiliated with First Nations operating under self-government agreements) (a)
Off reserve (b)
Total
212
93
119
Male
110
56
54
Female
102
37
65
Toosey (718)
Gender
Total (a + b)
On reserve and on Crown land (includes lands affiliated with First Nations operating under self-government agreements) (a)
Off reserve (b)
Total
372
172
200
Male
169
84
85
Female
203
88
115
Toquaht (666)
Gender
Total (a + b)
On reserve and on Crown land (includes lands affiliated with First Nations operating under self-government agreements) (a)
Off reserve (b)
Total
155
19
136
Male
78
*
*
Female
77
*
*
* Data Suppressed due to low counts
Tsal'alh (595)
Gender
Total (a + b)
On reserve and on Crown land (includes lands affiliated with First Nations operating under self-government agreements) (a)
Off reserve (b)
Total
717
379
338
Male
372
196
176
Female
345
183
162
Tsartlip (653)
Gender
Total (a + b)
On reserve and on Crown land (includes lands affiliated with First Nations operating under self-government agreements) (a)
Off reserve (b)
Total
1,015
659
356
Male
527
356
171
Female
488
303
185
Tsawout First Nation (654)
Gender
Total (a + b)
On reserve and on Crown land (includes lands affiliated with First Nations operating under self-government agreements) (a)
Off reserve (b)
Total
949
646
303
Male
454
325
129
Female
495
321
174
Tsawwassen First Nation (577)
Gender
Total (a + b)
On reserve and on Crown land (includes lands affiliated with First Nations operating under self-government agreements) (a)
Off reserve (b)
Total
386
198
188
Male
186
99
87
Female
200
99
101
Tsay Keh Dene (609)
Gender
Total (a + b)
On reserve and on Crown land (includes lands affiliated with First Nations operating under self-government agreements) (a)
Off reserve (b)
Total
503
250
253
Male
255
124
131
Female
248
126
122
Tseshaht (665)
Gender
Total (a + b)
On reserve and on Crown land (includes lands affiliated with First Nations operating under self-government agreements) (a)
Off reserve (b)
Total
1,213
482
731
Male
567
235
332
Female
646
247
399
Tseycum (655)
Gender
Total (a + b)
On reserve and on Crown land (includes lands affiliated with First Nations operating under self-government agreements) (a)
Off reserve (b)
Total
198
125
73
Male
97
63
34
Female
101
62
39
Tŝideldel First Nation (710)
Gender
Total (a + b)
On reserve and on Crown land (includes lands affiliated with First Nations operating under self-government agreements) (a)
Off reserve (b)
Total
703
342
361
Male
335
178
157
Female
368
164
204
Ts'kw'aylaxw First Nation (594)
Gender
Total (a + b)
On reserve and on Crown land (includes lands affiliated with First Nations operating under self-government agreements) (a)
Off reserve (b)
Total
582
272
310
Male
292
149
143
Female
290
123
167
Tsleil-Waututh Nation (549)
Gender
Total (a + b)
On reserve and on Crown land (includes lands affiliated with First Nations operating under self-government agreements) (a)
Off reserve (b)
Total
610
340
270
Male
294
178
116
Female
316
162
154
T'Sou-ke First Nation (657)
Gender
Total (a + b)
On reserve and on Crown land (includes lands affiliated with First Nations operating under self-government agreements) (a)
Off reserve (b)
Total
278
127
151
Male
123
59
64
Female
155
68
87
Ts'uubaa-asatx (643)
Gender
Total (a + b)
On reserve and on Crown land (includes lands affiliated with First Nations operating under self-government agreements) (a)
Off reserve (b)
Total
*
*
*
Male
*
*
*
Female
*
*
*
* Data Suppressed due to low counts
Tzeachten (575)
Gender
Total (a + b)
On reserve and on Crown land (includes lands affiliated with First Nations operating under self-government agreements) (a)
Off reserve (b)
Total
557
287
270
Male
263
135
128
Female
294
152
142
Uchucklesaht (667)
Gender
Total (a + b)
On reserve and on Crown land (includes lands affiliated with First Nations operating under self-government agreements) (a)
Off reserve (b)
Total
225
32
193
Male
102
*
*
Female
123
*
*
* Data Suppressed due to low counts
Ucluelet First Nation (668)
Gender
Total (a + b)
On reserve and on Crown land (includes lands affiliated with First Nations operating under self-government agreements) (a)
Off reserve (b)
Total
667
222
445
Male
342
121
221
Female
325
101
224
Ulkatcho (722)
Gender
Total (a + b)
On reserve and on Crown land (includes lands affiliated with First Nations operating under self-government agreements) (a)
Off reserve (b)
Total
1,066
652
414
Male
514
328
186
Female
552
324
228
Union Bar First Nation (588)
Gender
Total (a + b)
On reserve and on Crown land (includes lands affiliated with First Nations operating under self-government agreements) (a)
Off reserve (b)
Total
141
10
131
Male
73
*
*
Female
68
*
*
* Data Suppressed due to low counts
Upper Nicola (697)
Gender
Total (a + b)
On reserve and on Crown land (includes lands affiliated with First Nations operating under self-government agreements) (a)
Off reserve (b)
Total
980
415
565
Male
501
209
292
Female
479
206
273
Upper Similkameen (599)
Gender
Total (a + b)
On Reserve and On Crown Land (includes lands affiliated with First Nations operating under Self-Government Agreements) (a)
Off Reserve (b)
Total
216
72
144
Male
94
30
64
Female
122
42
80
West Moberly First Nations (545)
Gender
Total (a + b)
On reserve and on Crown land (includes lands affiliated with First Nations operating under self-government agreements) (a)
Off reserve (b)
Total
346
131
215
Male
173
69
104
Female
173
62
111
Westbank First Nation (601)
Gender
Total (a + b)
On reserve and on Crown land (includes lands affiliated with First Nations operating under self-government agreements) (a)
Off reserve (b)
Total
895
460
435
Male
453
234
219
Female
442
226
216
Wet'suwet'en First Nation (725)
Gender
Total (a + b)
On reserve and on Crown land (includes lands affiliated with First Nations operating under self-government agreements) (a)
Off reserve (b)
Total
256
94
162
Male
126
38
88
Female
130
56
74
Whispering Pines/Clinton (702)
Gender
Total (a + b)
On reserve and on Crown land (includes lands affiliated with First Nations operating under self-government agreements) (a)
Off reserve (b)
Total
184
47
137
Male
94
26
68
Female
90
21
69
Williams Lake (719)
Gender
Total (a + b)
On reserve and on Crown land (includes lands affiliated with First Nations operating under self-government agreements) (a)
Off reserve (b)
Total
842
279
563
Male
390
133
257
Female
452
146
306
Witset First Nation (530)
Gender
Total (a + b)
On reserve and on Crown land (includes lands affiliated with First Nations operating under self-government agreements) (a)
Off reserve (b)
Total
2,049
722
1,327
Male
1,029
377
652
Female
1,020
345
675
Wuikinuxv Nation (541)
Gender
Total (a + b)
On reserve and on Crown land (includes lands affiliated with First Nations operating under self-government agreements) (a)
Off reserve (b)
Total
286
82
204
Male
139
36
103
Female
147
46
101
Xaxli'p (592)
Gender
Total (a + b)
On reserve and on Crown land (includes lands affiliated with First Nations operating under self-government agreements) (a)
Off reserve (b)
Total
1,063
409
654
Male
529
213
316
Female
534
196
338
Xeni Gwet'in First Nations Government (714)
Gender
Total (a + b)
On reserve and on Crown land (includes lands affiliated with First Nations operating under self-government agreements) (a)
Off reserve (b)
Total
451
246
205
Male
215
117
98
Female
236
129
107
Yakweakwioose (576)
Gender
Total (a + b)
On reserve and on Crown land (includes lands affiliated with First Nations operating under self-government agreements) (a)
Off reserve (b)
Total
76
40
36
Male
30
20
10
Female
46
20
26
Yale First Nation (589)
Gender
Total (a + b)
On reserve and on Crown land (includes lands affiliated with First Nations operating under self-government agreements) (a)
Off reserve (b)
Total
178
68
110
Male
87
35
52
Female
91
33
58
Yekooche First Nation (728)
Gender
Total (a + b)
On reserve and on Crown land (includes lands affiliated with First Nations operating under self-government agreements) (a)
Off reserve (b)
Total
231
111
120
Male
117
60
57
Female
114
51
63
Yunesit'in Government (717)
Gender
Total (a + b)
On reserve and on Crown land (includes lands affiliated with First Nations operating under self-government agreements) (a)
Off reserve (b)
Total
488
267
221
Male
239
132
107
Female
249
135
114
General list - British Columbia region (848)
Gender
Total (a + b)
On reserve and on Crown land (includes lands affiliated with First Nations operating under self-government agreements) (a)
Off reserve (b)
Total
284
*
*
Male
147
0
147
Female
137
*
*
* Data Suppressed due to low counts
British Columbia region - 9
Gender
Total (a + b)
On reserve and on Crown land (includes lands affiliated with First Nations operating under self-government agreements) (a)
Off reserve (b)
Total
148,579
62,933
85,646
Male
73,281
32,474
40,807
Female
75,298
30,459
44,839
Region 8 - Yukon
Aishihik (490) - Champagne and Aishihik First Nations
Gender
Total (a + b)
On reserve and on Crown land (includes lands affiliated with First Nations operating under self-government agreements) (a)
Off reserve (b)
Total
192
97
95
Male
84
49
35
Female
108
48
60
Carcross/Tagish First Nations (491)
Gender
Total (a + b)
On reserve and on Crown land (includes lands affiliated with First Nations operating under self-government agreements) (a)
Off reserve (b)
Total
703
252
451
Male
353
137
216
Female
350
115
235
Champagne (493) - Champagne and Aishihik First Nations
Gender
Total (a + b)
On reserve and on Crown land (includes lands affiliated with First Nations operating under self-government agreements) (a)
Off reserve (b)
Total
731
256
475
Male
351
129
222
Female
380
127
253
Dease River (504)
Gender
Total (a + b)
On reserve and on Crown land (includes lands affiliated with First Nations operating under self-government agreements) (a)
Off reserve (b)
Total
185
63
122
Male
99
34
65
Female
86
29
57
First Nation of Nacho Nyak Dun (495)
Gender
Total (a + b)
On reserve and on Crown land (includes lands affiliated with First Nations operating under self-government agreements) (a)
Off reserve (b)
Total
549
162
387
Male
257
76
181
Female
292
86
206
Kluane First Nation (503)
Gender
Total (a + b)
On reserve and on Crown land (includes lands affiliated with First Nations operating under self-government agreements) (a)
Off reserve (b)
Total
176
77
99
Male
79
37
42
Female
97
40
57
Kwanlin Dun First Nation (500)
Gender
Total (a + b)
On reserve and on Crown land (includes lands affiliated with First Nations operating under self-government agreements) (a)
Off reserve (b)
Total
1,016
613
403
Male
528
325
203
Female
488
288
200
Liard First Nation (502)
Gender
Total (a + b)
On reserve and on Crown land (includes lands affiliated with First Nations operating under self-government agreements) (a)
Off reserve (b)
Total
1,211
510
701
Male
641
301
340
Female
570
209
361
Little Salmon/Carmacks First Nation (492)
Gender
Total (a + b)
On reserve and on Crown land (includes lands affiliated with First Nations operating under self-government agreements) (a)
Off reserve (b)
Total
679
311
368
Male
311
148
163
Female
368
163
205
Ross River (497)
Gender
Total (a + b)
On reserve and on Crown land (includes lands affiliated with First Nations operating under self-government agreements) (a)
Off reserve (b)
Total
558
358
200
Male
287
197
90
Female
271
161
110
Selkirk First Nation (498)
Gender
Total (a + b)
On reserve and on Crown land (includes lands affiliated with First Nations operating under self-government agreements) (a)
Off reserve (b)
Total
657
339
318
Male
321
173
148
Female
336
166
170
Ta'an Kwach'an (508)
Gender
Total (a + b)
On reserve and on Crown land (includes lands affiliated with First Nations operating under self-government agreements) (a)
Off reserve (b)
Total
277
100
177
Male
130
45
85
Female
147
55
92
Taku River Tlingit (501)
Gender
Total (a + b)
On reserve and on Crown land (includes lands affiliated with First Nations operating under self-government agreements) (a)
Off reserve (b)
Total
423
85
338
Male
198
48
150
Female
225
37
188
Teslin Tlingit Council (499)
Gender
Total (a + b)
On reserve and on Crown land (includes lands affiliated with First Nations operating under self-government agreements) (a)
Off reserve (b)
Total
597
250
347
Male
312
141
171
Female
285
109
176
Tr'ondëk Hwëch'in (494)
Gender
Total (a + b)
On reserve and on Crown land (includes lands affiliated with First Nations operating under self-government agreements) (a)
Off reserve (b)
Total
869
192
677
Male
435
101
334
Female
434
91
343
Vuntut Gwitchin First Nation (496)
Gender
Total (a + b)
On reserve and on Crown land (includes lands affiliated with First Nations operating under self-government agreements) (a)
Off reserve (b)
Total
581
270
311
Male
292
151
141
Female
289
119
170
White River First Nation (506)
Gender
Total (a + b)
On reserve and on Crown land (includes lands affiliated with First Nations operating under self-government agreements) (a)
Off reserve (b)
Total
157
51
106
Male
71
26
45
Female
86
25
61
General list - Yukon region (808)
Gender
Total (a + b)
On reserve and on Crown land (includes lands affiliated with First Nations operating under self-government agreements) (a)
Off reserve (b)
Total
*
*
*
Male
*
*
*
Female
*
*
*
* Data Suppressed due to low counts
Yukon region - 8
Gender
Total (a + b)
On reserve and on Crown land (includes lands affiliated with First Nations operating under self-government agreements) (a)
Off reserve (b)
Total
9,563
3,986
5,577
Male
4,749
2,118
2,631
Female
4,814
1,868
2,946
Region 1 - Northwest Territories
Acho Dene Koe First Nation (758)
Gender
Total (a + b)
On reserve and on Crown land (includes lands affiliated with First Nations operating under self-government agreements) (a)
Off reserve (b)
Total
711
563
148
Male
349
283
66
Female
362
280
82
Aklavik (755)
Gender
Total (a + b)
On reserve and on Crown land (includes lands affiliated with First Nations operating under self-government agreements) (a)
Off reserve (b)
Total
442
262
180
Male
213
134
79
Female
229
128
101
Behdzi Ahda' First Nation (771)
Gender
Total (a + b)
On reserve and on Crown land (includes lands affiliated with First Nations operating under self-government agreements) (a)
Off reserve (b)
Total
259
216
43
Male
133
109
24
Female
126
107
19
Dechi Laot'i First Nations (774)
Gender
Total (a + b)
On reserve and on Crown land (includes lands affiliated with First Nations operating under self-government agreements) (a)
Off reserve (b)
Total
193
175
18
Male
90
*
*
Female
103
*
*
* Data Suppressed due to low counts
Deh Gáh Got'ie Dene First Nation (760)
Gender
Total (a + b)
On reserve and on Crown land (includes lands affiliated with First Nations operating under self-government agreements) (a)
Off reserve (b)
Total
1,108
807
301
Male
549
410
139
Female
559
397
162
Deline First Nation (754)
Gender
Total (a + b)
On reserve and on Crown land (includes lands affiliated with First Nations operating under self-government agreements) (a)
Off reserve (b)
Total
1,064
913
151
Male
522
453
69
Female
542
460
82
Deninu K'ue First Nation (762)
Gender
Total (a + b)
On reserve and on Crown land (includes lands affiliated with First Nations operating under self-government agreements) (a)
Off reserve (b)
Total
962
482
480
Male
484
255
229
Female
478
227
251
Dog Rib Rae (765)
Gender
Total (a + b)
On reserve and on Crown land (includes lands affiliated with First Nations operating under self-government agreements) (a)
Off reserve (b)
Total
3,290
2,546
744
Male
1,658
1,316
342
Female
1,632
1,230
402
Fort Good Hope (752)
Gender
Total (a + b)
On reserve and on Crown land (includes lands affiliated with First Nations operating under self-government agreements) (a)
Off reserve (b)
Total
923
597
326
Male
450
305
145
Female
473
292
181
Gameti First Nation (773)
Gender
Total (a + b)
On reserve and on Crown land (includes lands affiliated with First Nations operating under self-government agreements) (a)
Off reserve (b)
Total
365
350
15
Male
189
*
*
Female
176
*
*
* Data Suppressed due to low counts
Gwichya Gwich'in (753)
Gender
Total (a + b)
On reserve and on Crown land (includes lands affiliated with First Nations operating under self-government agreements) (a)
Off reserve (b)
Total
488
231
257
Male
245
122
123
Female
243
109
134
Inuvik Native (780)
Gender
Total (a + b)
On reserve and on Crown land (includes lands affiliated with First Nations operating under self-government agreements) (a)
Off reserve (b)
Total
649
219
430
Male
275
87
188
Female
374
132
242
Jean Marie River First Nation (770)
Gender
Total (a + b)
On reserve and on Crown land (includes lands affiliated with First Nations operating under self-government agreements) (a)
Off reserve (b)
Total
163
128
35
Male
74
55
19
Female
89
73
16
Ka'a'gee Tu First Nation (768)
Gender
Total (a + b)
On reserve and on Crown land (includes lands affiliated with First Nations operating under self-government agreements) (a)
Off reserve (b)
Total
73
50
23
Male
40
28
12
Female
33
22
11
K'atlodeeche First Nation (761)
Gender
Total (a + b)
On reserve and on Crown land (includes lands affiliated with First Nations operating under self-government agreements) (a)
Off reserve (b)
Total
655
412
243
Male
325
201
124
Female
330
211
119
Liidlii Kue First Nation (757)
Gender
Total (a + b)
On reserve and on Crown land (includes lands affiliated with First Nations operating under self-government agreements) (a)
Off reserve (b)
Total
1,369
773
596
Male
698
397
301
Female
671
376
295
Lutsel K'e Dene First Nation (764)
Gender
Total (a + b)
On reserve and on Crown land (includes lands affiliated with First Nations operating under self-government agreements) (a)
Off reserve (b)
Total
807
533
274
Male
400
273
127
Female
407
260
147
Nahanni Butte (766)
Gender
Total (a + b)
On reserve and on Crown land (includes lands affiliated with First Nations operating under self-government agreements) (a)
Off reserve (b)
Total
140
121
19
Male
66
*
*
Female
74
*
*
* Data Suppressed due to low counts
Pehdzeh Ki First Nation (756)
Gender
Total (a + b)
On reserve and on Crown land (includes lands affiliated with First Nations operating under self-government agreements) (a)
Off reserve (b)
Total
347
261
86
Male
163
114
49
Female
184
147
37
Salt River First Nation #195 (759)
Gender
Total (a + b)
On reserve and on Crown land (includes lands affiliated with First Nations operating under self-government agreements) (a)
Off reserve (b)
Total
1,011
284
727
Male
509
141
368
Female
502
143
359
Sambaa K'e First Nation (767)
Gender
Total (a + b)
On reserve and on Crown land (includes lands affiliated with First Nations operating under self-government agreements) (a)
Off reserve (b)
Total
119
103
16
Male
49
*
*
Female
70
*
*
* Data Suppressed due to low counts
Teetl'it Gwich'in Band Council (751)
Gender
Total (a + b)
On reserve and on Crown land (includes lands affiliated with First Nations operating under self-government agreements) (a)
Off reserve (b)
Total
1,443
930
513
Male
714
468
246
Female
729
462
267
Tulita Dene (750)
Gender
Total (a + b)
On reserve and on Crown land (includes lands affiliated with First Nations operating under self-government agreements) (a)
Off reserve (b)
Total
716
398
318
Male
342
204
138
Female
374
194
180
West Point First Nation (772)
Gender
Total (a + b)
On reserve and on Crown land (includes lands affiliated with First Nations operating under self-government agreements) (a)
Off reserve (b)
Total
75
37
38
Male
36
15
21
Female
39
22
17
Wha Ti First Nation (769)
Gender
Total (a + b)
On reserve and on Crown land (includes lands affiliated with First Nations operating under self-government agreements) (a)
Off reserve (b)
Total
678
640
38
Male
351
335
16
Female
327
305
22
Yellowknives Dene First Nation (763)
Gender
Total (a + b)
On reserve and on Crown land (includes lands affiliated with First Nations operating under self-government agreements) (a)
Off reserve (b)
Total
1,603
781
822
Male
759
398
361
Female
844
383
461
General list - Northwest Territories region (809)
Gender
Total (a + b)
On reserve and on Crown land (includes lands affiliated with First Nations operating under self-government agreements) (a)
Off reserve (b)
Total
*
*
*
Male
*
*
*
Female
*
*
*
* Data Suppressed due to low counts
Northwest Territories region - 1
Gender
Total (a + b)
On reserve and on Crown land (includes lands affiliated with First Nations operating under self-government agreements) (a)
Off reserve (b)
Total
19,659
12,812
6,847
Male
9,687
6,468
3,219
Female
9,972
6,344
3,628
Canada
All regions
Gender
Total (a + b)
On reserve and on Crown land (includes lands affiliated with First Nations operating under self-government agreements) (a)