Epidemiological summary of COVID-19 cases in First Nations communities
Data is current as of March 9, 2023. Vaccine data is as of March 7, 2023.
To make sure the charts are easy to read and show current trends, only the most recent 52 weeks are displayed in a 4-week format.
On this page
About the charts
Information on demographics and outcomes is currently available for cases in First Nations communities as reported to Indigenous Services Canada (ISC).
The charts on this page do not include COVID-19 cases in First Nations individuals residing off reserve or in the territories.
Statistics about First Nations individuals diagnosed with COVID-19 who do not live on a reserve are included in the provincial and territorial case counts, although they are not distinguished as such.
Some First Nations organizations in some provinces are releasing COVID-19 data that combines on- and off-reserve data. Visit:
Cumulative reported, recovered, active, newly reported cases and vaccine doses administered in First Nations communities
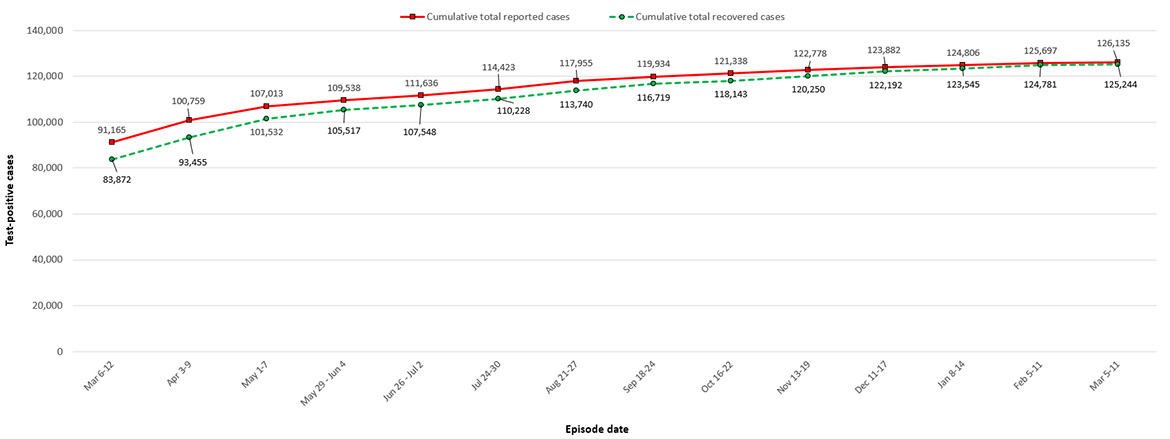
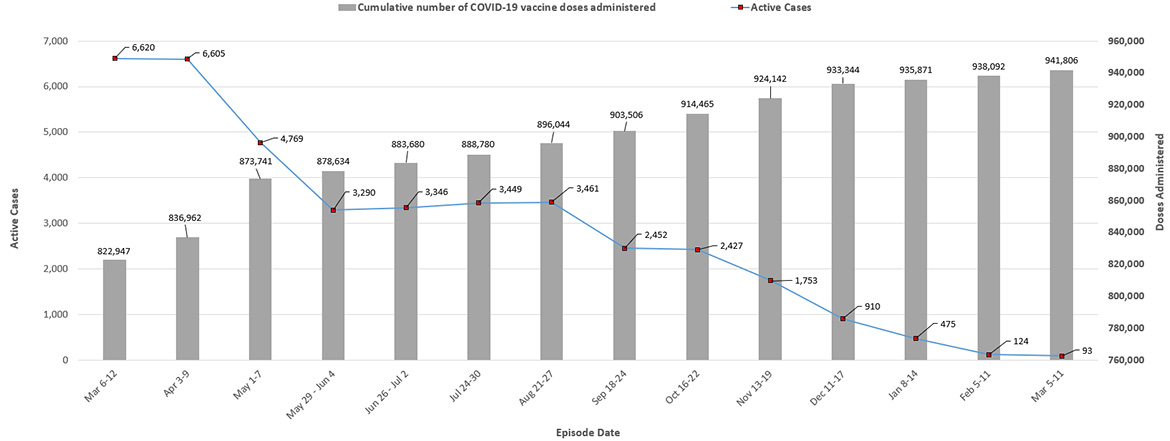
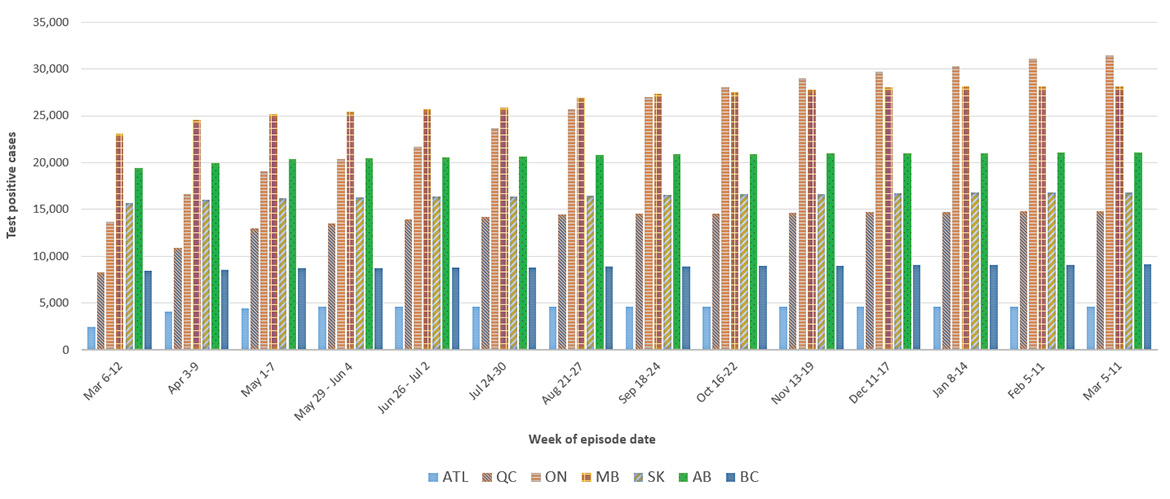
The charts with epidemic curves over time (epi curves) below show:
- the cumulative totals of reported and recovered COVID-19 cases
- active cases including the number of vaccine doses administered
- newly reported COVID-19 cases in First Nations communities in provinces
Epidemic curves of COVID-19 cases in First Nations communities on-reserve are available online and updated weekly. As the number of doses administered in First Nations communities continues to increase, the number of active cases in the communities has been dropping.

Text alternative for chart 1: cumulative reported and recovered cases
| Date | Cumulative total reported cases | Cumulative total recovered cases |
|---|---|---|
| Feb 13-19 | 84,372 | 76,341 |
| Feb 20-26 | 86,813 | 79,178 |
| Feb 27 - Mar 5 | 88,825 | 81,599 |
| Mar 6-12 | 91,165 | 83,872 |
| Mar 13-19 | 92,685 | 85,875 |
| Mar 20-26 | 95,146 | 88,015 |
| Mar 27 - Apr 2 | 97,299 | 90,067 |
| Apr 3-9 | 100,759 | 93,455 |
| Apr 10-16 | 102,747 | 95,502 |
| Apr 17-23 | 104,294 | 97,926 |
| Apr 24-30 | 105,904 | 99,863 |
| May 1-7 | 107,013 | 101,532 |
| May 8-14 | 107,990 | 103,215 |
| May 15-21 | 108,488 | 104,223 |
| May 22-28 | 109,009 | 104,960 |
| May 29 - Jun 4 | 109,538 | 105,517 |
| Jun 5-11 | 109,970 | 106,021 |
| Jun 12-18 | 110,437 | 106,533 |
| Jun 19-25 | 110,857 | 106,970 |
| Jun 26 - Jul 2 | 111,636 | 107,548 |
| Jul 3-9 | 112,373 | 108,246 |
| Jul 10-16 | 113,111 | 108,941 |
| Jul 17-23 | 113,743 | 109,699 |
| Jul 24-30 | 114,423 | 110,228 |
| Jul 31 - Aug 6 | 115,195 | 111,044 |
| Aug 7-13 | 116,062 | 111,908 |
| Aug 14-20 | 116,997 | 112,787 |
| Aug 21-27 | 117,955 | 113,740 |
| Aug 28 - Sep 3 | 118,709 | 114,757 |
| Sep 4-10 | 119,233 | 115,498 |
| Sep 11-17 | 119,596 | 116,280 |
| Sep 18-24 | 119,934 | 116,719 |
| Sep 25 - Oct 1 | 120,193 | 117,044 |
| Oct 2-8 | 120,540 | 117,298 |
| Oct 9-15 | 120,952 | 117,505 |
| Oct 16-22 | 121,338 | 118,143 |
| Oct 23-29 | 121,792 | 118,558 |
| Oct 30 - Nov 5 | 122,141 | 119,119 |
| Nov 6-12 | 122,479 | 119,813 |
| Nov 13-19 | 122,778 | 120,250 |
| Nov 20-26 | 123,066 | 120,767 |
| Nov 27 - Dec 3 | 123,377 | 121,335 |
| Dec 4-10 | 123,686 | 121,767 |
| Dec 11-17 | 123,882 | 122,192 |
| Dec 18-24 | 124,052 | 122,523 |
| Dec 25-31 | 124,415 | 122,768 |
| Jan 1-7 | 124,593 | 122,940 |
| Jan 8-14 | 124,806 | 123,545 |
| Jan 15-21 | 125,177 | 124,137 |
| Jan 22-28 | 125,328 | 124,428 |
| Jan 29 - Feb 4 | 125,519 | 124,582 |
| Feb 5-11 | 125,697 | 124,781 |
| Feb 12-18 | 125,822 | 124,881 |
| Feb 19-25 | 125,934 | 124,974 |
| Feb 26 - Mar 4 | 125,971 | 125,065 |
| Mar 5-11 | 126,135 | 125,244 |
The date corresponds to episode date for reported cases and date of recovery for recovered cases.
The episode date corresponds to the earliest date reported according to the following order: symptom onset date, specimen collection date, laboratory result date, date reported to ISC.
Chart 2 describes
- the number of active COVID-19 cases in First Nations communities in Canada by week of report
- the number of vaccine doses administered

Text alternative for chart 2: number of active COVID-19 cases in First Nations communities and number of vaccine doses administered
| Week | Active Cases | Cumulative number of COVID-19 vaccine doses administered (includes 1st and 2nd doses) |
|---|---|---|
| Feb 13-19 | 7,398 | 805,844 |
| Feb 20-26 | 6,979 | 813,457 |
| Feb 27 - Mar 5 | 6,562 | 818,879 |
| Mar 6-12 | 6,620 | 822,947 |
| Mar 13-19 | 6,126 | 831,623 |
| Mar 20-26 | 6,445 | 833,185 |
| Mar 27 - Apr 2 | 6,537 | 835,344 |
| Apr 3-9 | 6,605 | 836,962 |
| Apr 10-16 | 6,544 | 870,618 |
| Apr 17-23 | 5,664 | 870,618 |
| Apr 24-30 | 5,335 | 872,839 |
| May 1-7 | 4,769 | 873,741 |
| May 8-14 | 4,051 | 875,824 |
| May 15-21 | 3,538 | 875,824 |
| May 22-28 | 3,319 | 878,634 |
| May 29 - Jun 4 | 3,290 | 878,634 |
| Jun 5-11 | 3,215 | 881,349 |
| Jun 12-18 | 3,166 | 881,349 |
| Jun 19-25 | 3,146 | 835,344 |
| Jun 26 - Jul 2 | 3,346 | 883,680 |
| Jul 3-9 | 3,384 | 888,898 |
| Jul 10-16 | 3,426 | 888,898 |
| Jul 17-23 | 3,298 | 888,780 |
| Jul 24-30 | 3,449 | 888,780 |
| Jul 31 - Aug 6 | 3,400 | 894,970 |
| Aug 7-13 | 3,401 | 894,970 |
| Aug 14-20 | 3,457 | 896,044 |
| Aug 21-27 | 3,461 | 896,044 |
| Aug 28 - Sep 3 | 3,195 | 898,482 |
| Sep 4-10 | 2,975 | 898,482 |
| Sep 11-17 | 2,554 | 903,506 |
| Sep 18-24 | 2,452 | 903,506 |
| Sep 25 - Oct 1 | 2,384 | 906,468 |
| Oct 2-8 | 2,477 | 906,468 |
| Oct 9-15 | 2,680 | 914,465 |
| Oct 16-22 | 2,427 | 914,465 |
| Oct 23-29 | 2,463 | 917,447 |
| Oct 30 - Nov 5 | 2,250 | 917,447 |
| Nov 6-12 | 1,893 | 924,142 |
| Nov 13-19 | 1,753 | 924,142 |
| Nov 20-26 | 1,522 | 924,142 |
| Nov 27 - Dec 3 | 1,265 | 924,142 |
| Dec 4-10 | 1,141 | 933,344 |
| Dec 11-17 | 910 | 933,344 |
| Dec 18-24 | 747 | 933,344 |
| Dec 25-31 | 863 | 933,344 |
| Jan 1-7 | 867 | 935,871 |
| Jan 8-14 | 475 | 935,871 |
| Jan 15-21 | 254 | 935,871 |
| Jan 22-28 | 114 | 935,871 |
| Jan 29 - Feb 4 | 148 | 935,871 |
| Feb 5-11 | 124 | 938,092 |
| Feb 12-18 | 148 | 938,092 |
| Feb 19-25 | 165 | 938,092 |
| Feb 26 - Mar 4 | 109 | 938,092 |
| Mar 5-11 | 93 | 941,806 |
The episode date corresponds to the earliest date reported according to the following order: symptom onset date, specimen collection date, laboratory result date, date reported to ISC.

Text alternative for chart 3: newly reported cases
| Date | ATL | QC | ON | MB | SK | AB | BC |
|---|---|---|---|---|---|---|---|
| Feb 13-19 | 1,959 | 7,166 | 10,846 | 21,563 | 15,642 | 19,031 | 8,165 |
| Feb 20-26 | 2,236 | 7,377 | 11,861 | 22,152 | 15,681 | 19,202 | 8,304 |
| Feb 27 - Mar 5 | 2,292 | 7,742 | 12,811 | 22,553 | 15,685 | 19,350 | 8,392 |
| Mar 6-12 | 2,488 | 8,278 | 13,705 | 23,077 | 15,689 | 19,467 | 8,461 |
| Mar 13-19 | 2,543 | 8,467 | 14,461 | 23,441 | 15,692 | 19,577 | 8,504 |
| Mar 20-26 | 3,175 | 8,761 | 15,234 | 23,797 | 15,901 | 19,740 | 8,538 |
| Mar 27 - Apr 2 | 3,743 | 9,106 | 15,904 | 24,126 | 15,976 | 19,869 | 8,575 |
| Apr 3-9 | 4,107 | 10,860 | 16,620 | 24,542 | 16,061 | 19,994 | 8,575 |
| Apr 10-16 | 4,107 | 11,694 | 17,390 | 24,752 | 16,088 | 20,114 | 8,602 |
| Apr 17-23 | 4,272 | 12,087 | 18,023 | 24,929 | 16,113 | 20,233 | 8,637 |
| Apr 24-30 | 4,316 | 12,759 | 18,629 | 25,059 | 16,156 | 20,305 | 8,680 |
| May 1-7 | 4,491 | 13,007 | 19,046 | 25,220 | 16,191 | 20,356 | 8,702 |
| May 8-14 | 4,491 | 13,446 | 19,404 | 25,308 | 16,216 | 20,401 | 8,724 |
| May 15-21 | 4,512 | 13,491 | 19,717 | 25,378 | 16,236 | 20,430 | 8,724 |
| May 22-28 | 4,620 | 13,501 | 20,020 | 25,426 | 16,247 | 20,451 | 8,744 |
| May 29 - Jun 4 | 4,620 | 13,553 | 20,386 | 25,476 | 16,261 | 20,488 | 8,754 |
| Jun 5-11 | 4,620 | 13,598 | 20,676 | 25,500 | 16,297 | 20,509 | 8,770 |
| Jun 12-18 | 4,620 | 13,651 | 20,966 | 25,571 | 16,317 | 20,531 | 8,781 |
| Jun 19-25 | 4,658 | 13,707 | 21,220 | 25,593 | 16,342 | 20,547 | 8,790 |
| Jun 26 - Jul 2 | 4,658 | 13,910 | 21,688 | 25,669 | 16,346 | 20,563 | 8,802 |
| Jul 3-9 | 4,658 | 13,930 | 22,359 | 25,690 | 16,351 | 20,579 | 8,806 |
| Jul 10-16 | 4,658 | 14,092 | 22,857 | 25,730 | 16,358 | 20,599 | 8,817 |
| Jul 17-23 | 4,658 | 14,188 | 23,259 | 25,807 | 16,361 | 20,640 | 8,830 |
| Jul 24-30 | 4,658 | 14,253 | 23,703 | 25,920 | 16,364 | 20,680 | 8,845 |
| Jul 31 - Aug 6 | 4,658 | 14,378 | 24,139 | 26,065 | 16,380 | 20,722 | 8,853 |
| Aug 7-13 | 4,658 | 14,405 | 24,577 | 26,383 | 16,396 | 20,781 | 8,862 |
| Aug 14-20 | 4,658 | 14,447 | 25,083 | 26,701 | 16,432 | 20,806 | 8,870 |
| Aug 21-27 | 4,658 | 14,496 | 25,690 | 26,941 | 16,466 | 20,822 | 8,882 |
| Aug 28 - Sep 3 | 4,658 | 14,523 | 26,212 | 27,083 | 16,503 | 20,837 | 8,893 |
| Sep 4-10 | 4,658 | 14,527 | 26,543 | 27,222 | 16,524 | 20,855 | 8,904 |
| Sep 11-17 | 4,658 | 14,546 | 26,772 | 27,295 | 16,534 | 20,878 | 8,913 |
| Sep 18-24 | 4,658 | 14,557 | 27,004 | 27,359 | 16,542 | 20,888 | 8,926 |
| Sep 25 - Oct 1 | 4,658 | 14,564 | 27,183 | 27,390 | 16,566 | 20,901 | 8,931 |
| Oct 2-8 | 4,658 | 14,568 | 27,466 | 27,419 | 16,580 | 20,909 | 8,940 |
| Oct 9-15 | 4,658 | 14,587 | 27,749 | 27,475 | 16,606 | 20,923 | 8,954 |
| Oct 16-22 | 4,658 | 14,595 | 28,028 | 27,522 | 16,617 | 20,947 | 8,971 |
| Oct 23-29 | 4,658 | 14,603 | 28,388 | 27,565 | 16,631 | 20,962 | 8,985 |
| Oct 30 - Nov 5 | 4,658 | 14,616 | 28,626 | 27,650 | 16,638 | 20,964 | 8,989 |
| Nov 6-12 | 4,658 | 14,640 | 28,839 | 27,725 | 16,649 | 20,971 | 8,997 |
| Nov 13-19 | 4,658 | 14,650 | 29,010 | 27,823 | 16,655 | 20,981 | 9,001 |
| Nov 20-26 | 4,658 | 14,667 | 29,170 | 27,910 | 16,670 | 20,985 | 9,006 |
| Nov 27 - Dec 3 | 4,658 | 14,669 | 29,388 | 27,969 | 16,683 | 20,993 | 9,017 |
| Dec 4-10 | 4,658 | 14,710 | 29,590 | 28,014 | 16,689 | 20,998 | 9,027 |
| Dec 11-17 | 4,658 | 14,738 | 29,705 | 28,047 | 16,699 | 21,001 | 9,034 |
| Dec 18-24 | 4,658 | 14,740 | 29,832 | 28,068 | 16,704 | 21,009 | 9,041 |
| Dec 25-31 | 4,658 | 14,771 | 30,124 | 28,086 | 16,711 | 21,014 | 9,051 |
| Jan 1-7 | 4,658 | 14,771 | 30,261 | 28,103 | 16,717 | 21,025 | 9,058 |
| Jan 8-14 | 4,658 | 14,774 | 30,367 | 28,121 | 16,781 | 21,038 | 9,067 |
| Jan 15-21 | 4,658 | 14,832 | 30,626 | 28,134 | 16,801 | 21,050 | 9,076 |
| Jan 22-28 | 4,658 | 14,833 | 30,758 | 28,140 | 16,807 | 21,056 | 9,076 |
| Jan 29 - Feb 4 | 4,658 | 14,833 | 30,925 | 28,140 | 16,811 | 21,064 | 9,088 |
| Feb 5-11 | 4,658 | 14,834 | 31,077 | 28,140 | 16,815 | 21,072 | 9,101 |
| Feb 12-18 | 4,658 | 14,834 | 31,183 | 28,140 | 16,820 | 21,080 | 9,107 |
| Feb 19-25 | 4,658 | 14,834 | 31,291 | 28,140 | 16,823 | 21,081 | 9,107 |
| Feb 26 - Mar 4 | 4,658 | 14,837 | 31,308 | 28,140 | 16,829 | 21,082 | 9,117 |
| Mar 5-11 | 4,658 | 14,837 | 31,447 | 28,143 | 16,838 | 21,083 | 9,129 |
The episode date corresponds to the earliest date reported according to the following order: symptom onset date, specimen collection date, laboratory result date, date reported to ISC.
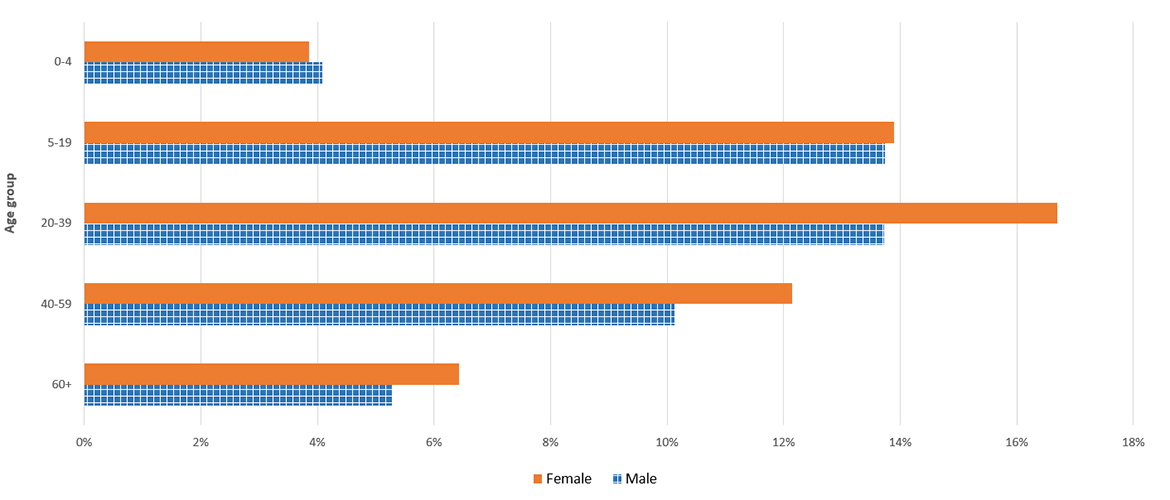
Reported cases in First Nations communities by age group and sex

Text alternative for reported cases in First Nations communities by age group and sex
| Age group | 60+ | 40-59 | 20-39 | 5-19 | 0-4 |
|---|---|---|---|---|---|
| Male | 5.3% | 10.1% | 13.7% | 13.7% | 4.1% |
| Female | 6.4% | 12.1% | 16.7% | 13.9% | 3.9% |