National overview of the Community Well-Being index, 1981 to 2016
PDF version (670 Kb 15 pages)
Table of contents
About the Community Well-Being index
The Community Well-Being (CWB) index is a measure used to assess socio-economic well-being for Indigenous and non-Indigenous communities over time. The index helps to show where improvements in well-being have been achieved and where significant gaps still exist.
The 4 main objectives of the CWB index are to:
- provide a systematic, reliable summary measure of socio-economic well-being for individual Canadian communities
- illustrate variations in well-being across First Nations and Inuit communities and how it compares to that of non-Indigenous communities
- enable the tracking of well-being over time
- complement other research at the community-level that explores factors associated with well-being
The CWB index is a composite index based on Statistics Canada's Census of Population (1981 to 2006, 2016) and the National Household Survey (2011).
For 2016, the CWB methodology was modified to include a new labour force activity age group of 20 to 64 years old, previously 20 to 65 years. Additionally, the income per capita was changed to a range of $2,650 to $75,000 (previously $2,000 to $40,000) to reflect current income distribution. As a result, all CWB scores have been updated back to 1981 based on these changes, making previous versions of this report incompatible with this 2016 analysis.
The index is made up of the following 4 components:
- education is based on how many community members have at least a high school education and how many have acquired a university degree
- labour force activity measures how many community members participate in the labour force and how many labour force participants have jobs
- income is calculated based on a community's total income per capita
- housing is based on the number of community members whose homes are in an adequate state of repair and are not overcrowded
The 4 CWB components are combined to create a single well-being score for each community. Each CWB score and each component score can range from a low of 0 to a high of 100. Currently, CWB scores for First Nations, Inuit and non-Indigenous communities are calculated using the Statistics Canada geographic unit of a Census Subdivision (CSD). Each First Nations or Inuit community is designated by 1 or more CSDs. However, the CWB does not create a score for Métis communities as there are only 8 Métis-designated settlement areas in Alberta, a smaller level of geography than CSDs.
In 2016, CWB scores were available for 623 First Nations, 50 Inuit and 3,781 non-Indigenous communities.
Well-being means different things to different people and the CWB is not intended to be the only or the best way of defining well-being in all circumstances. The CWB includes the 4 components described above because they are widely accepted as being important to well-being.
The limitations of the CWB index were recently highlighted by the Office of the Auditor General (OAG) which indicated the index components are important components. However, the OAG also mentioned that a more holistic portrait of community well-being would be to place the CWB within a broader dashboard of other important indicators. The CWB does not measure other equally important aspects of well-being such as health, culture, and happiness because of data limitations. This is because detailed information on these topics is not collected by the census or the National Household Survey, which are the only data sources that can fulfil the CWB's 4 main objectives as outlined above.
For further details, read the OAG's report on socio-economic gaps on First Nations reserves.
National trends
Community Well-Being index scores
Throughout this report the CWB score and gaps are based on the unrounded numbers presented in Table 1, although the displayed numbers are rounded to the nearest tenth.
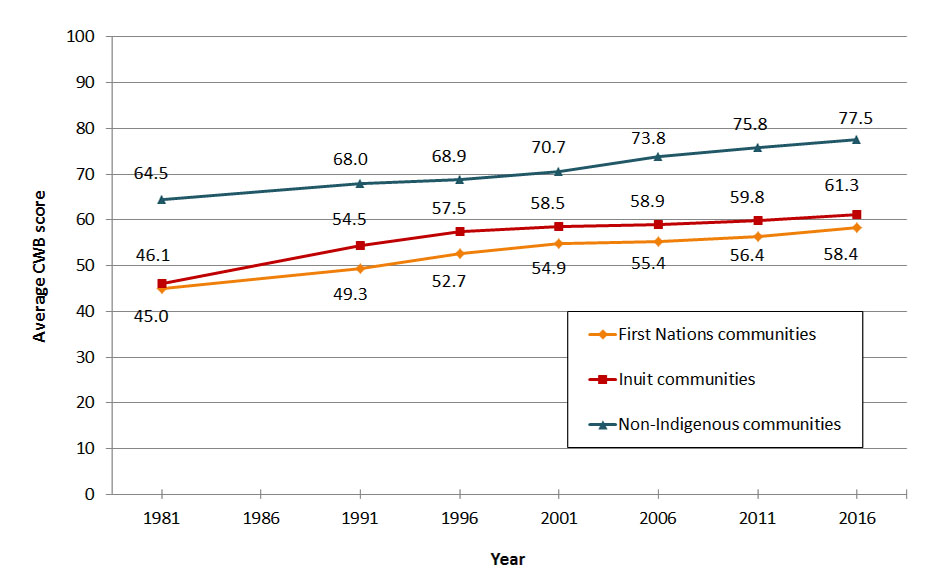
The average CWB scores for First Nations, Inuit and non-Indigenous communities increased slowly but steadily between 1981 and 2016 (Figure 1). The average CWB score for First Nations communities increased by 13.4 points during this relatively short timeframe. The score increased from 45 points in 1981 to 58.4 points in 2016. Inuit communities experienced similar improvements in their average CWB score, with an increase of 15.2 points. The score in these communities increased from 46.1 points in 1981 to 61.3 points in 2016. Non-Indigenous communities also experienced an increase in their average CWB score. The increase of 13 points was smaller than the positive change observed in Indigenous communities.
Despite these encouraging trends, there continues to be a substantial CWB gap between Indigenous and non-Indigenous communities. The 2016 CWB gap of 19.1 points between First Nations and non-Indigenous communities is approximately the same size as the gap in 1981. The gap between Inuit and non-Indigenous communities has narrowed slightly since the CWB's first cycle in 1981. However, there is still a 16.2-point gap in average CWB scores.
Historically, there were periods when the CWB gap between Indigenous and non-Indigenous communities narrowed, notably between 1981 and 2001. However, by 2006 this trend had reversed and the gap began to widen again. Further analysis suggests that this widening of the gap was partially driven by a sharp increase in the average education score for non-Indigenous communities. This jump should be interpreted with caution, since the education questions were changed for the 2006 census.
Overall, these 2016 results indicate that while clear CWB gains continue to be experienced by Indigenous communities, these gains have not been of a sufficient magnitude or pace to reduce the socio-economic gap between Indigenous and non-Indigenous communities.
Source: Statistics Canada, Censuses of Population, 1981 to 2006, 2016 and National Household Survey, 2011.
Description of figure 1: Average CWB scores by community type, 1981 to 2016
This line graph compares the average CWB index scores of First Nations, Inuit and non-Indigenous communities across Canada from 1981 to 2016.
- The average CWB index score for First Nations communities was 45 in 1981, 49.3 in 1991, 52.7 in 1996, 54.9 in 2001, 55.4 in 2006, 56.4 in 2011 and 58.4 in 2016
- The average CWB index score for Inuit communities was 46.1 in 1981, 54.5 in 1991, 57.5 in 1996, 58.5 in 2001, 58.9 in 2006, 59.8 in 2011 and 61.3 in 2016
- The average CWB index score in non-Indigenous communities in Canada was 64.5 in 1981, 68 in 1991, 68.9 in 1996, 70.7 in 2001, 73.8 in 2006, 75.8 in 2011 and 77.5 in 2016
Community Well-Being index component scores
An examination of the 4 components used to calculate communities' average CWB scores provides additional insight into socio-economic change over time and across community types. Between 1981 and 2016, all communities observed increases to their education, labour force activity, income and housing scores. For all 3 community types, CWB component scores for the education and income components showed the greatest change over this 35-year time period. The labour force activity and housing components fluctuated slightly and experienced only marginal gains over time.
In 2016, the gaps between First Nations and non-Indigenous communities were greatest for the housing (24 points) and income (22.1 points) components. There was a similar gap in the average education and labour force activity scores between the 2 community types, 15.5 points and 15 points respectively.
Housing also represented the greatest CWB gap (28.4 points) between Inuit and non-Indigenous communities in 2016. The second largest gap was observed in education scores (20.2 points), with much smaller gaps reported for the average labour force activity (8.6 points) and income (7.8 points) scores.
Upon closer examination, there are some noteworthy trends in how each CWB component has experienced change over time.
Education
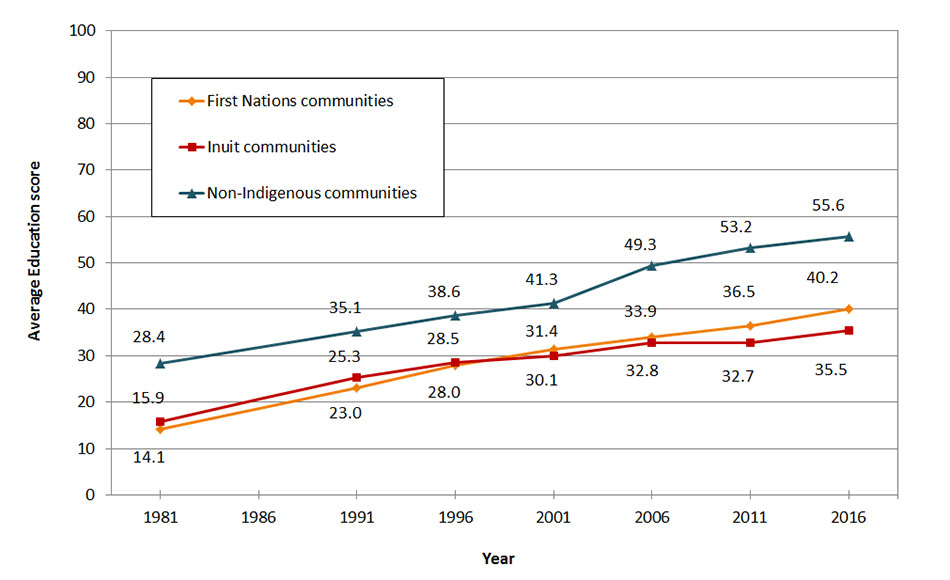
The average education scores for all 3 community types increased considerably between 1981 and 2016 (Figure 2). Over this time period, increases to average education scores were comparable between First Nations and non-Indigenous communities, while Inuit communities experienced a smaller positive change.
These latest results indicate that the education gap has remained relatively stable for First Nations and Inuit communities in recent years. In 2016, the education gap between First Nations and non-Indigenous communities was 15.5 points, which is very close to the 16.7-point gap reported in 2011. A greater gap of 20.2 points separated the average education scores for Inuit and non-Indigenous communities in 2016.
An examination of earlier cycles of the index shows that the education gaps have not always been this sizable. Progress made in the education component for First Nations and Inuit communities prior to 2001 contributed to a narrowing of the education gap. After 2001, the trend reversed and the gap began to widen. As previously mentioned, this sudden gap increase may relate to changes to the education questions on the 2006 census and should be interpreted with caution.
Source: Statistics Canada, Censuses of Population, 1981 to 2006, 2016 and National Household Survey, 2011.
Description of figure 2: Average education scores by community type, 1981 to 2016
This line graph compares the average education scores of First Nations, Inuit and non-Indigenous communities across Canada from 1981 to 2016.
- The average education score for First Nations communities was 14.1 in 1981, 23 in 1991, 28 in 1996, 31.4 in 2001, 33.9 in 2006, 36.5 in 2011 and 40.2 in 2016
- The average education score for Inuit communities was 15.9 in 1981, 25.3 in 1991, 28.5 in 1996, 30.1 in 2001, 32.8 in 2006, 32.7 in 2011 and 35.5 in 2016
- The average education score in non-Indigenous communities in Canada was 28.4 in 1981, 35.1 in 1991, 38.6 in 1996, 41.3 in 2001, 49.3 in 2006, 53.2 in 2011 and 55.6 in 2016
Labour force activity
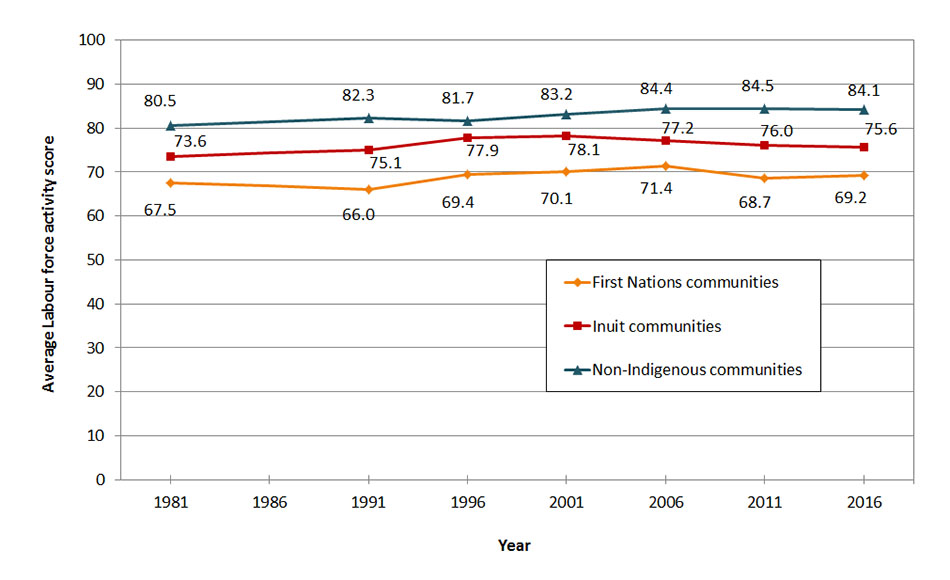
Between 1981 and 2016, all community types experienced a slight increase to their labour force activity scores (Figure 3). For Indigenous communities, the growth observed during the 1990s did not develop into a long-term trend and after 2001, labour force activity scores remained fairly stable.
The 2016 labour force activity gaps have remained quite stable and have not experienced much change since the last census cycle in 2011. However, when compared to earlier census cycles, it is notable that the 2016 results are indicative of greater gaps between Indigenous and non-Indigenous communities than what was initially observed in 1981. The 15-point labour force activity gap that separated First Nations and non-Indigenous communities in 2016 was slightly larger than the 13-point gap observed in 1981. Similarly, the smaller 8.6-point gap between Inuit and non-Indigenous communities in 2016 is slightly greater than the 1981 labour force activity gap (6.9 points) between these 2 community types.
Source: Statistics Canada, Censuses of Population, 1981 to 2006, 2016 and National Household Survey, 2011.
Description of figure 3: Average labour force activity scores by community type, 1981 to 2016
This line graph compares the average labour force activity scores of First Nations, Inuit and non-Indigenous communities across Canada from 1981 to 2016.
- The average labour force activity score for First Nations communities was 67.5 in 1981, 66 in 1991, 69.4 in 1996, 70.1 in 2001, 71.4 in 2006, 68.7 in 2011 and 69.2 in 2016
- The average labour force activity score for Inuit communities was 73.6 in 1981, 75.1 in 1991, 77.9 in 1996, 78.1 in 2001, 77.2 in 2006, 76 in 2011 and 75.6 in 2016
- The average labour force activity score in non-Indigenous communities in Canada was 80.5 in 1981, 82.3 in 1991, 81.7 in 1996, 83.2 in 2001, 84.4 in 2006, 84.5 in 2011 and 84.1 in 2016
Income
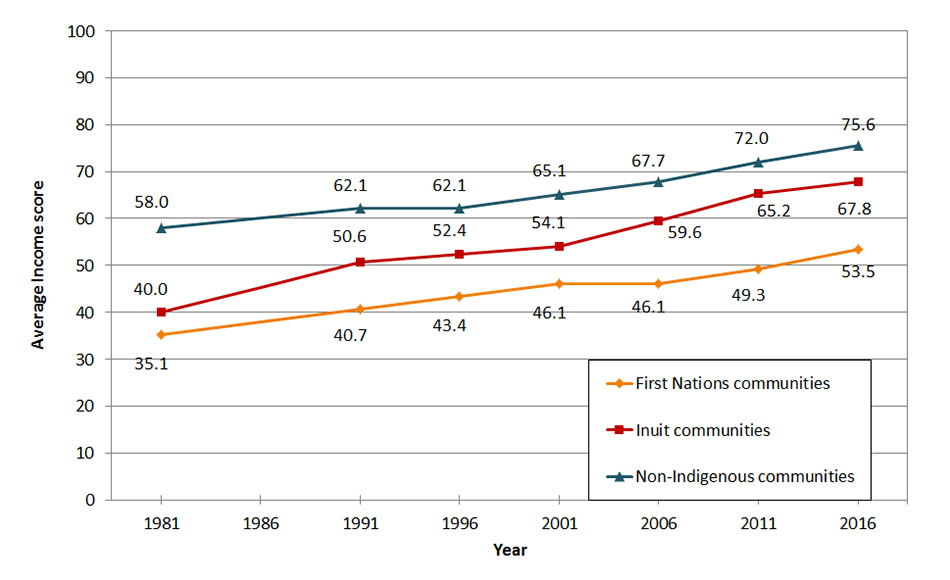
Figure 4 illustrates the steady increase in average income scores observed for all 3 community types between 1981 and 2016. First Nations communities experienced average income gains comparable to non-Indigenous communities, 18.3 versus 17.6 points respectively, while Inuit communities experienced the most pronounced growth (27.8 points) for this component of the CWB.
The parallel growth observed between First Nations and non-Indigenous communities resulted in little change to the gap in average income scores between these 2 community types. In 2016, the income gap between First Nations and non-Indigenous communities was 22.1 points, as compared to the 22.8-point gap observed in 1981. Conversely, there has been a steady narrowing of the income gap between Inuit and non-Indigenous communities. The income gap between these 2 community types was 7.8 points in 2016, which is a substantial 10.2-point reduction from the 18-point gap observed 35 years earlier.
Source: Statistics Canada, Censuses of Population, 1981 to 2006, 2016 and National Household Survey, 2011.
Description of figure 4: Average income scores by community type, 1981 to 2016
This line graph compares the average income scores of First Nations, Inuit and non-Indigenous communities across Canada from 1981 to 2016.
- The average income score for First Nations communities was 35.1 in 1981, 40.7 in 1991, 43.4 in 1996, 46.1 in 2001, 46.1 in 2006, 49.3 in 2011 and 53.5 in 2016
- The average income score for Inuit communities was 40 in 1981, 50.6 in 1991, 52.4 in 1996, 54.1 in 2001, 59.6 in 2006, 65.2 in 2011 and 67.8 in 2016
- The average income score in non-Indigenous communities in Canada was 58 in 1981, 62.1 in 1991, 62.1 in 1996, 65.1 in 2001, 67.7 in 2006, 72 in 2011 and 75.6 in 2016
Housing
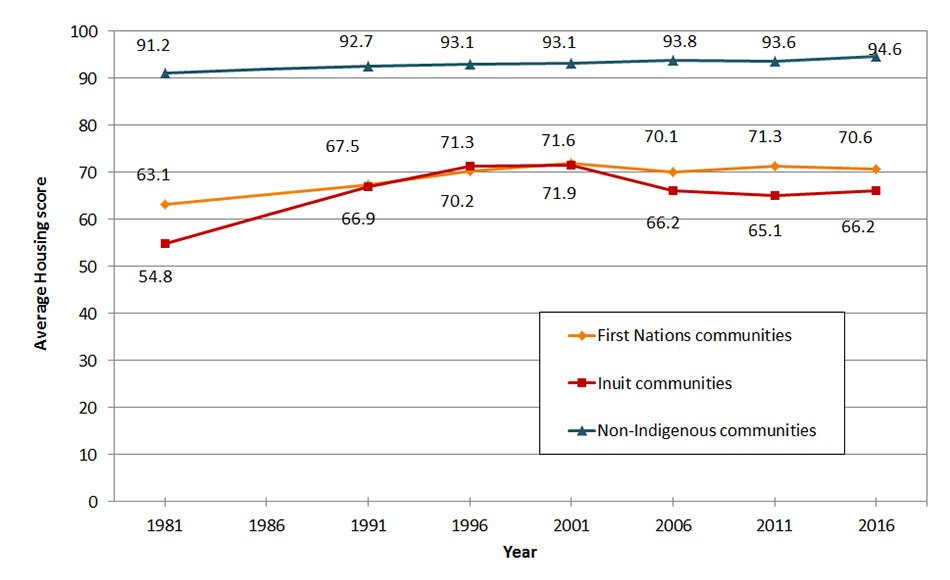
First Nations and Inuit communities have experienced slight to moderate growth in their average housing scores between 1981 and 2016 (Figure 5). For both community types, growth was greatest in the 1990s and the highest average housing scores were recorded in 2001. However, following this peak, further growth in average housing scores diminished. For First Nations communities these scores remained stable and close to 70 points over the past 3 census periods, while for Inuit communities they declined to 66.2 points in 2016.
In 2016, there was a 24-point housing gap between First Nations and non-Indigenous communities. This figure represents a 4.1-point gap reduction since 1981, which is slightly larger than the housing gap recorded in 2011 (22.4 points). Inuit communities experienced a 28.4-point housing gap with non-Indigenous communities in 2016. This represents a moderate 7.9-point reduction in the housing gap, which was 36.3 points in 1981. While housing gains led to a reduction in the gap prior to 2001, after this date average housing scores for Inuit communities declined, remaining close to 1991 scores over the past 3 census cycles.
Source: Statistics Canada, Censuses of Population, 1981 to 2006, 2016 and National Household Survey, 2011.
Description of figure 5: Average housing scores by community type, 1981 to 2016
This line graph compares the average housing scores of First Nations, Inuit and non-Indigenous communities across Canada from 1981 to 2016.
- The average housing score for First Nations communities was 63.1 in 1981, 67.5 in 1991, 70.2 in 1996, 71.9 in 2001, 70.1 in 2006, 71.3 in 2011 and 70.6 in 2016
- The average housing score for Inuit communities was 54.8 in 1981, 66.9 in 1991, 71.3 in 1996, 71.6 in 2001, 66.2 in 2006, 65.1 in 2011 and 66.2 in 2016
- The average housing score in non-Indigenous communities in Canada was 91.2 in 1981, 92.7 in 1991, 93.1 in 1996, 93.1 in 2001, 93.8 in 2006, 93.6 in 2011 and 94.6 in 2016
Table 1 below presents a review of the trends in CWB components across community types and highlights the time required for changes in CWB average scores to impact corresponding gaps. Furthermore, the table provides a summary of the CWB components, including changes in average scores and gaps. The "score changes" column refers to changes over time to the CWB scores of First Nations and Inuit communities. The "gap changes" column presents the changes over time in the gaps between the CWB scores of First Nations and Inuit communities compared with non-Indigenous ones.
| CWB components | 2016 gap | Score changes | Gap changes | |||
|---|---|---|---|---|---|---|
| 1981 to 2016 | 2011-2016 | 1981 to 2016 | 2011 to 2016 | |||
| First Nations communities | Education | 15.5 | Increased 26.1 | Increased 3.7 | Widened 1.2 | Narrowed 1.2 |
| Labour Force | 15.0 | Increased 1.6 | Increased 0.5 | Widened 2.0 | Narrowed 0.9 | |
| Income | 22.1 | Increased 18.3 | Increased 4.1 | Narrowed 0.7 | Narrowed 0.6 | |
| Housing | 24.0 | Increased 7.5 | Decreased 0.7 | Narrowed 4.1 | Widened 1.6 | |
| Inuit communities | Education | 20.2 | Increased 19.6 | Increased 2.7 | Widened 7.6 | Narrowed 0.3 |
| Labour Force | 8.6 | Increased 2.0 | Decreased 0.4 | Widened 1.7 | Widened 0.1 | |
| Income | 7.8 | Increased 27.8 | Increased 2.6 | Narrowed 10.2 | Widened 1.0 | |
| Housing | 28.4 | Increased 11.4 | Increased 1.0 | Narrowed 7.9 | Narrowed 0.1 | |
| Source: Statistics Canada, Censuses of Population, 1981 to 2006, 2016 and National Household Survey, 2011 | ||||||
Regional trends
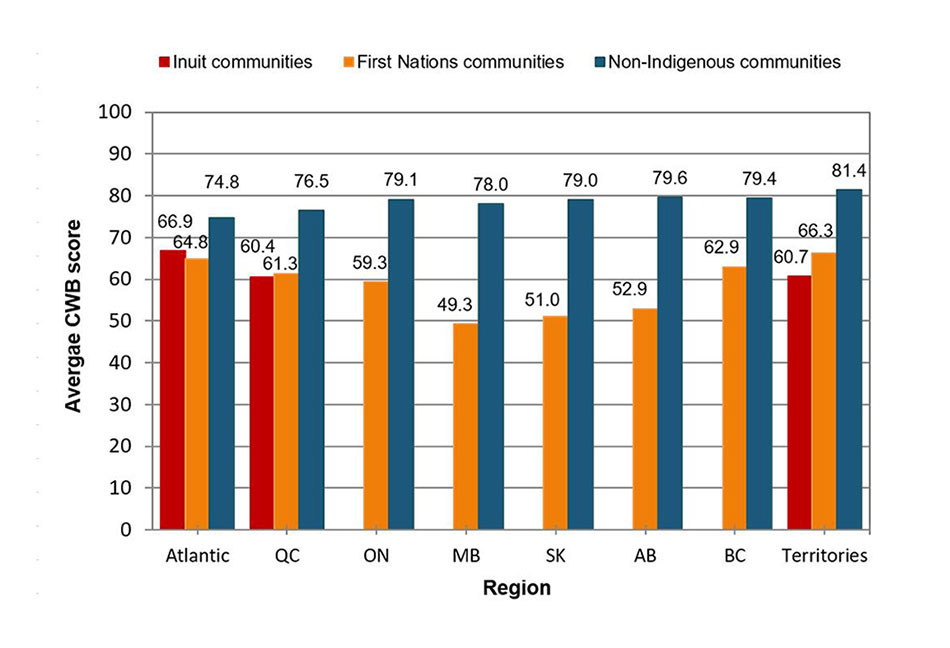
Further insights on these results emerge when the 2016 average CWB scores are examined according to the regions where communities are located (Figure 6). Among First Nations communities, those in the territories and the Atlantic region had the highest average CWB scores and First Nations communities in the Atlantic region recorded the smallest CWB gap when compared to their non-Indigenous counterparts. Comparatively, First Nations communities in the Prairie provinces experienced the lowest average CWB scores and also the largest CWB gaps. In Figure 6, Inuit communities that are a part of the Inuit Nunangat are represented according to their location in 3 broader regions: Atlantic, Quebec and the territories. Across these regions, all the average CWB scores were in the 60 to 70 point range. More details on the variation between communities within the Inuit Nunangat are available in the 2016 companion reports:
- Report on trends in First Nations communities, 1981 to 2016
- Report on trends in Inuit communities, 1981 to 2016
Source: Statistics Canada, Censuses of Population, 1981 to 2006, 2016 and National Household Survey, 2011.
Description of figure 6: Regional CWB scores by community type, 2016
This bar graph compares the average CWB scores of First Nations, Inuit and non-Indigenous communities by region in Canada in 2016.
- The average CWB score for First Nations communities was 64.8 in the Atlantic Region, 61.3 in Quebec, 59.3 in Ontario, 49.3 in Manitoba, 51 in Saskatchewan, 52.9 in Alberta, 62.9 in British Columbia and 66.3 in the territories
- The average CWB score for Inuit communities was 66.9 in the Atlantic Region, 60.4 in Quebec and 60.7 in the territories
- The average CWB score in non-Indigenous communities in Canada was 74.8 in the Atlantic region, 76.5 in Quebec, 79.1 in Ontario, 78 in Manitoba, 79 in Saskatchewan, 79.6 in Alberta, 79.4 in British Columbia and 81.4 in the territories
To explore recent changes within these regions, average CWB scores were compared for the 2011 and 2016 iterations of the CWB index (Figure 7). While First Nations communities in the Prairie provinces were reported to have among the lowest average CWB scores in 2016, further investigation reveals that these communities have also experienced the greatest increase to their average CWB scores since the last census cycle in 2011. Positive growth in CWB average scores also occurred for First Nations communities located in British Columbia and the territories. Between 2011 and 2016, Inuit communities in the Atlantic region experienced the greatest increase to their average CWB score.
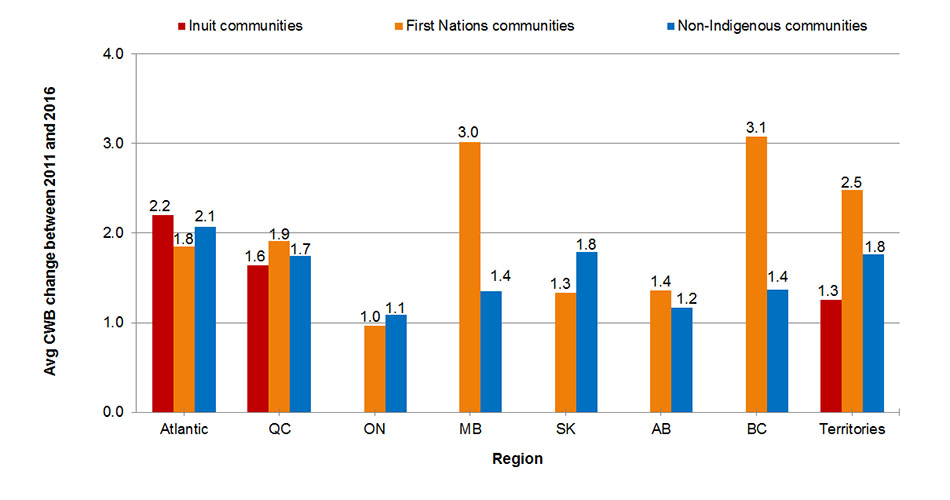
Description of figure 7: Regional average CWB score changes by region and community type, 2011 to 2016
This bar graph compares the average change in CWB scores of First Nations, Inuit and non-Indigenous communities by region in Canada between 2011 and 2016.
- The average change in CWB scores for First Nations communities was 1.8 in the Atlantic Region, 1.9 in Quebec, 1 in Ontario, 3 in Manitoba, 1.3 in Saskatchewan, 1.4 in Alberta, 3.1 in British Columbia and 2.5 in the territories
- The average change in CWB scores for Inuit communities was 2.2 in the Atlantic Region, 1.6 in Quebec, 1.3 in the territories
- The average change in CWB scores in non-Indigenous communities in Canada was 2.1 in the Atlantic region, 1.7 in Quebec, 1.1 in Ontario, 1.4 in Manitoba, 1.8 in Saskatchewan, 1.2 in Alberta, 1.4 in British Columbia and 1.8 in the territories
Community Well-Being score distribution
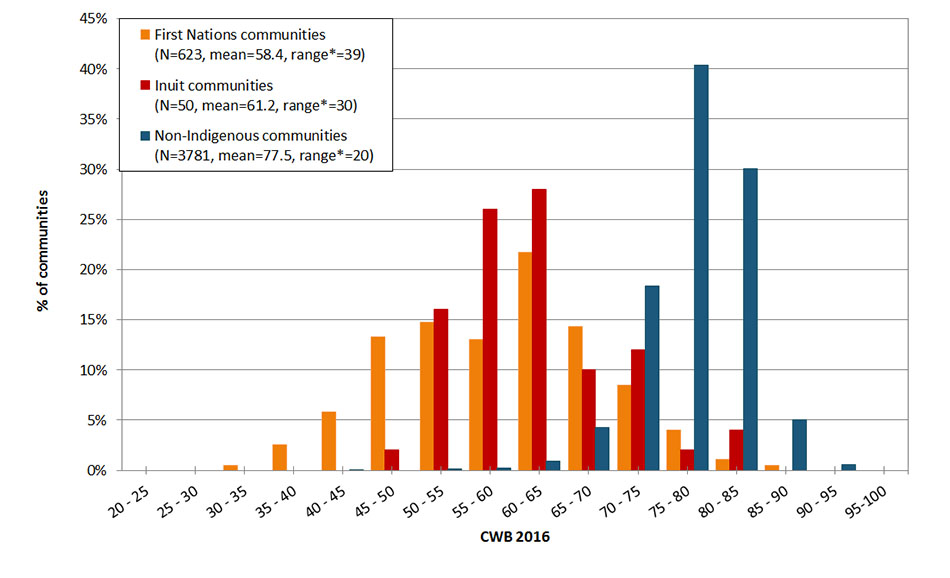
Community-level analysis offers insight in to how greatly the CWB scores can vary among communities in the same community type (Figure 8). In 2016, First Nations communities showed the greatest variation in CWB scores, with 95% falling within a 39-point range. By comparison, 95% of Inuit and non-Indigenous communities fell within a smaller range of 30 points and 20 points, respectively.
Although 98 of the 100 lowest-scoring communities in 2016 were First Nations communities, 22 First Nations communities scored at or above the 2016 average CWB score for non-Indigenous communities (77.5 points). In 2016, 2 First Nations communities were identified on the list of the CWB's 100 top-scoring communities."
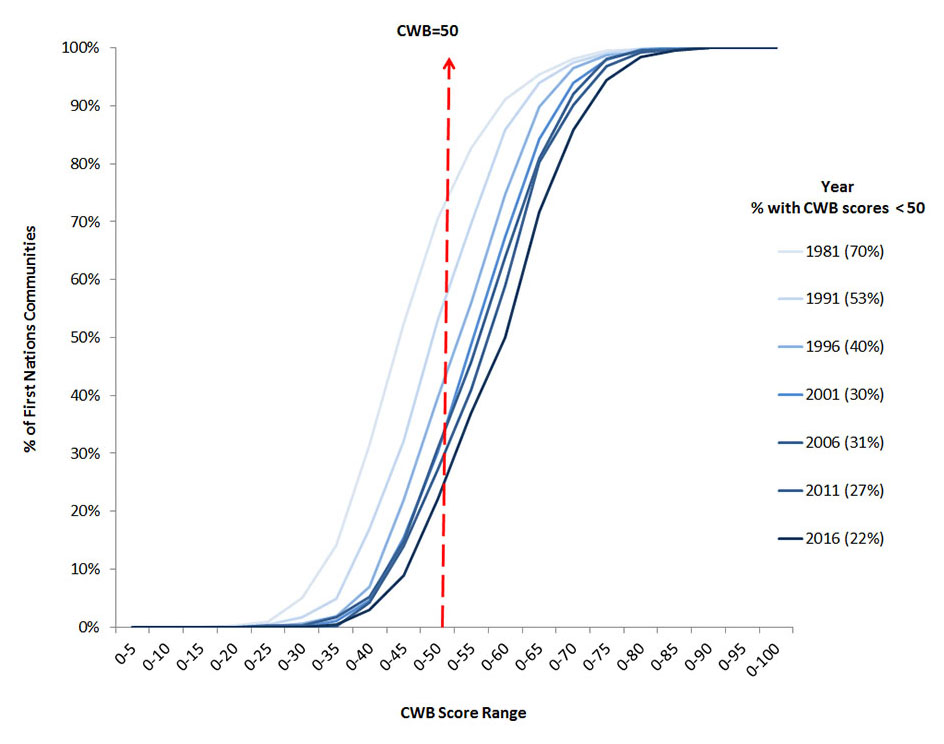
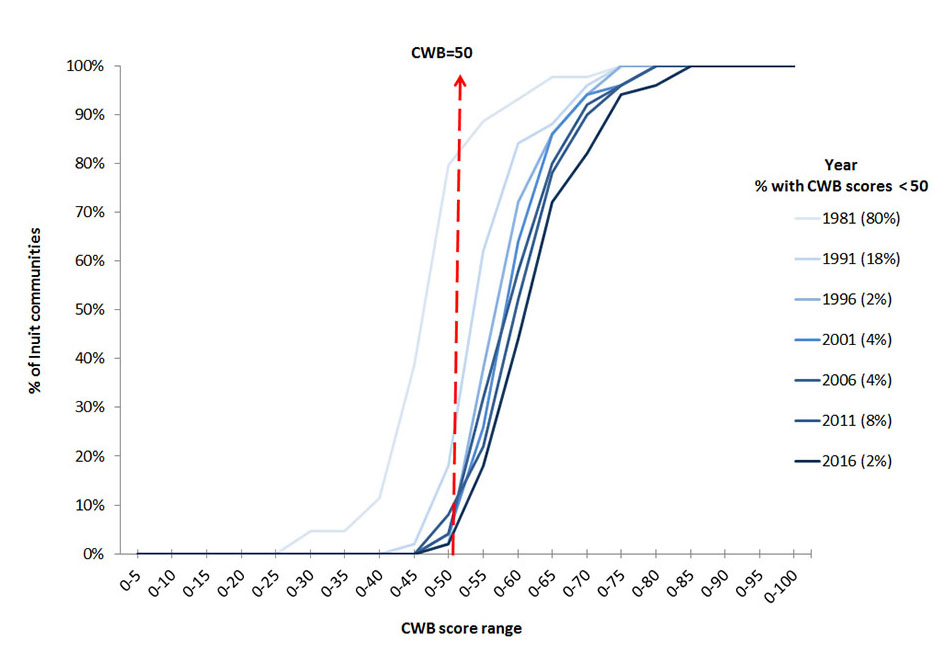
Further examination of community-level progress indicates that an increasing number of both First Nations and Inuit communities have experienced a dramatic shift in their overall CWB scores. As Figure 9 illustrates, between 1981 and 2016, the proportion of First Nations communities with low (less than 50) CWB scores declined from 70% to 22%, or by 48 percentage points. Similarly, the proportion of Inuit communities with low (less than 50) CWB scores declined from 80% in 1981 to 2% in 2016, or a decrease of 78 percentage points (Figure 10).
Source: Statistics Canada, Censuses of Population, 1981 to 2006, 2016 and National Household Survey, 2011.
Description of figure 8: Distribution of CWB scores by community type, 2016
This bar graph compares the distribution of scores for First Nations, Inuit and non-Indigenous communities on the CWB index in Canada, 2016.
- The average score for First Nations communities is 58.4
- The average score for Inuit communities is 61.2
- The average score for non-Indigenous communities is 77.5
- The range between the highest and lowest scores for First Nations communities is 39 points
- The range between the highest and lowest for Inuit communities is 30 points
- The range between the highest and lowest scores for non-Indigenous communities is 20 points
- 0.48% of First Nations communities fall between 30 and 35 points
- 2.57% of First Nations communities fall between 35 and 40 points
- 5.78% of First Nations communities fall between 40 and 45 points
- 13.32% of First Nations communities fall between 45 and 50 points
- 14.77% of First Nations communities fall between 50 and 55 points
- 13% of First Nations communities fall between 55 and 60 points
- 21.67% of First Nations communities fall between 60 and 65 points
- 14.29% of First Nations communities fall between 65 and 70 points
- 8.51% of First Nations communities fall between 70 and 75 points
- 4.01% of First Nations communities fall between 75 and 80 points
- 1.12% of First Nations communities fall between 80 and 85 points
- 0.48% of First Nations communities fall between 85 and 90 points
- 2% of Inuit communities fall between 45 and 50 points
- 16% of Inuit communities fall between 50 and 55 points
- 26% of Inuit communities fall between 55 and 60 points
- 28% of Inuit communities fall between 60 and 65 points
- 10% of Inuit communities fall between 65 and 70 points
- 12% of Inuit communities fall between 70 and 75 points
- 2% of Inuit communities fall between 75 and 80 points
- 4% of Inuit communities fall between 80 and 85 points
- 0.05% of non-Indigenous communities fall between 40 and 45 points
- 0% of non-Indigenous communities fall between 45 and 50 points
- 0.13% of non-Indigenous communities fall between 50 and 55 points
- 0.24% of non-Indigenous communities fall between 55 and 60 points
- 0.95% of non-Indigenous communities fall between 60 and 65 points
- 4.26% of non-Indigenous communities fall between 65 and 70 points
- 18.38% of non-Indigenous communities fall between 70 and 75 points
- 40.33% of non-Indigenous communities fall between 75 and 80 points
- 30.07% of non-Indigenous communities fall between 80 and 85 points
- 5.05% of non-Indigenous communities fall between 85 and 90 points
- 0.53% of non-Indigenous communities fall between 90 and 95 points
Source: Statistics Canada, Censuses of Population, 1981 to 2006, 2016 and National Household Survey, 2011
Description of figure 9: Cumulative distribution of First Nations communities' CWB scores, 1981 to 2016
This line graph presents the percentage of First Nations communities that had CWB scores that were less than 50 by census year.
- In 1981, 70% of First Nations communities had a CWB score that was less than 50
- In 1991, 53% of First Nations communities had a CWB score that was less than 50
- In 1996, 40% of First Nations communities had a CWB score that was less than 50
- In 2001, 30% of First Nations communities had a CWB score that was less than 50
- In 2006, 31% of First Nations communities had a CWB score that was less than 50
- In 2011, 27% of First Nations communities had a CWB score that was less than 50
- In 2016, 22% of First Nations communities had a CWB score that was less than 50
Source: Statistics Canada, Censuses of Population, 1981 to 2006, 2016 and National Household Survey, 2011
Description of figure 10: Cumulative distribution of Inuit communities' CWB scores, 1981 to 2016
This line graph presents the percentage of Inuit communities that had CWB scores that were less than 50 by census year.
- In 1981, 80% of Inuit communities had a CWB score that was less than 50
- In 1991, 18% of Inuit communities had a CWB score that was less than 50
- In 1996, 2% of Inuit communities had a CWB score that was less than 50
- In 2001, 4% of Inuit communities had a CWB score that was less than 50
- In 2006, 4% of Inuit communities had a CWB score that was less than 50
- In 2011, 8% of Inuit communities had a CWB score that was less than 50
- In 2016, 2% of Inuit communities had a CWB score that was less than 50