Archived - Registered Indian Population by Sex and Residence 2008
Archived information
This Web page has been archived on the Web. Archived information is provided for reference, research or record keeping purposes. It is not subject to the Government of Canada Web Standards and has not been altered or updated since it was archived. Please contact us to request a format other than those available.
Date: 2009
ISSN 1702-0964
PDF Version (394 kb, 95 Pages)
Table of Contents
- Acknowledgements
- Introduction
- Differences from the 2007 Edition
- Data Organization
- Types of Residence
- Note to Users
- Source of Data
- Administrative Changes to the Indian Register in 2008
- Summary Statistics
- Registered Indian Population by Region and Type of Residence, December 31, 2008
- Registered Indian Population by Type of Residence for All Canada, 1981-2008
- The Twenty Largest Bands in Canada, December 31, 2008
- Bands in Canada by Size, December 31, 2008
- Registry Groups in Canada by Size, December 31, 2008
- Registered Indian Population, On and Off Reserve by Age and Sex, December 31, 2008
- Detailed Tables
Acknowledgements
This publication was prepared by Eric McGregor, Strategic Research and Analysis Directorate and in collaboration with the Office of the Indian Registrar (OIR), Resolution and Individual Affairs Sector.
Should you require clarification or additional population statistics, please call 1-800-567-9604, or e-mail InfoPubs@ainc-inac.gc.ca.
Introduction
The Department of Indian Affairs and Northern Development (DIAND) is required by the Indian Act (Chapter I, Section 5 (1)) to record in the Indian Register the names of individuals who are registered under the Act. The Indian Registry System (IRS) is a database which records individuals' names and a range of non-statutory data. The Registered Indian Population by Sex and Residence describes the IRS population as recorded at December 31, 2008. Descriptive statistics are developed from the IRS that include sex, residence, registry group, responsibility centre and region.
Differences from the 2007 Edition
There are no major changes to report this year.
Data Organization
Data are organized in two broad sections. The first section provides summary statistics that include age and gender distribution, and residency comparisons for all regions and Canada.
The second section presents information for each registry group arranged by sex, residence, responsibility centre and region (see definition of registry group below). For purposes of the Privacy Act, data in this section are collapsed into three columns by rolling residency fields 1 through 5 into one "On Reserve and On Crown Land"
category. This minimizes the presence of small numbers thereby resulting in much less opportunity of identifying individuals.
Entire registry groups with total membership of less than 40 people are suppressed from the Detailed Tables section and indicated by a * in every cell. Furthermore, other techniques are in place such as suppression of individual cells smaller than 10 as well as suppression of adjacent cells to guard against residual disclosure. The counts of any suppressed cells, however, are included in aggregations to district, regional and national totals.
In total, data for 11 registry groups and general lists required suppression. In terms of registry groups, five in British Columbia were suppressed. As for general lists, there were two suppressions in Ontario, one in Manitoba, two in Saskatchewan and one in the Yukon.
Types of Residence
There are six types of residence, all of which are active fields used in the Indian Register. They represent individuals registered under the Indian Act, or who are descendants of individuals registered under the Indian Act, whose residency is captured by any one of the following:
- On Reserve Own Band
- On Reserve Other Band
- On Crown Land Own Band
- On Crown Land Other Band
- On Crown Land No Band
- Off Reserve
Unlike some other INAC systems, the Indian Register does not distinguish between Indian Act reserves and lands affiliated to First Nations operating under Self-Government Agreements (SGAs). Technically, once a SGA is ratified, the lands are no longer considered Indian Reserves under the provisions of the Indian Act. Therefore, individuals in the "On Reserve and On Crown Land"
category may reside on lands legally defined as Indian reserves, on Indian settlements usually represented by Crown Lands and on other lands affiliated to self-governing First Nations.
The Off Reserve category represents individuals affiliated to First Nations who may reside neither on reserve nor on Crown land according to the Indian Register.
Distinction between the words "Band"
, "Registry Group"
and "Reserve"
A band* refers to a body of Indians for whose collective use and benefit lands have been set apart or money is held by the Crown, or declared to be a band for purposes of the Indian Act.
A registry group is an administrative term used in the Indian Register. For details, please refer to refer to point 1 under Source of Data.
A reserve* means a tract of land, the legal title to which is vested in Her Majesty, that has been set apart by Her Majesty for the use and benefit of a band.
At December 31, 2008, there were 615 Bands or 630 Registry Groups in Canada and 3,003 reserves, not all of which are inhabited.
*Source: Indian Act
Note to Users
The Indian Register is meant to record individual names in accordance with specific sub-sections of the Indian Act. The Indian Register does not include all persons who are entitled to be registered according to the Indian Act, only those who have applied to be registered and whose entitlement has been verified. Therefore, data from the IRS may not fully meet the requirements of some statistical activities (e.g. demographic projections, migration patterns).
There is a reporting lag between the occurrence of a given life event and its being reported and recorded for updating of the Indian Register. This means that events occurring prior to December 31, 2008 may not be reflected in the Indian Register as documented on that date. The following examples illustrate this concept:
- Infants entitled to be registered at birth may not be registered by the December 31st reporting date. Parents often do not report the birth until a later year. It is estimated that of all births reported in 2008, approximately 69 percent had actually occurred prior to 2008.
- Individuals can remain on the Indian Register for some time after they are deceased. A certificate of death or a confirmation of presumed death is normally required to remove a name from the Indian Register.
- Residency codes are typically updated when a life event is reported, although some bands update them more frequently. Residency remains a voluntary field in that the information is not mandatory to collect.
Source of Data
Individuals are considered Registered Indians if their names appear on the Indian Register. Names are added or deleted from the Indian Register based on legal sources of information such as provincial birth or death certificates.
The addition or removal of a name to or from any part of the Indian Register is approved by the Registrar as set out in the Indian Act.
The following concepts may affect interpretation and utility
-
Data in the detailed tables are presented by registry group. A registry group is an administrative term applied to a group of Indian Register individuals who have membership in a particular Indian band, or, are descendants from members of that band. A band usually relates to only one registry group except in the following three cases: Six Nations of the Grand River band in the Ontario Region consists of 13 registry groups (see The Twenty Largest Bands in Canada, December 31, 2008); Stoney band in the Alberta Region consists of 3 registry groups (Bearspaw, Chiniki and Wesley); and the Champagne and Aishihik First Nations band in the Yukon Region consists of two registry groups (Aishihik and Champagne). The registry groups related to these bands are noted in the detailed tables.
-
Affiliation of an individual with a particular registry group in the Indian Registration System is based on ancestry and may not equate to local band membership rules. Bands may choose to legally take control of their membership rules in accordance with Section 10 of the Indian Act. As at December 31, 2008, 231 bands out of 615, or 37.6%, have done so. Membership may be determined by other than the Indian Act, such as:
- the Cree-Naskapi (of Quebec) Act (9 bands),
- the Kwanlin Dun First Nation Final Agreement (1 band),
- the Nisga'a Final Agreement Act (4 bands),
- the Sechelt Self-Government Act (1 band),
- the Westbank First Nation Self-Government Agreement (1 band) and
- the Yukon First Nations Self-Government Act (9 bands).
- The
"On Reserve and On Crown Land"
category does not necessarily identify the location of registrants. As for the Off Reserve component, because the data are presented by band of affiliation, the individuals may not reside in that particular region, or even inside Canada for that matter.
Administrative Changes to The Indian Register In 2008
| 2007 Groups Affected by Region | 2008 Change by Region |
|---|---|
| Quebec Region | |
| Betsiamites (085) | Bande des Innus de Pessamit (085) |
| Nakapi of Quebec (081) | Naskapi Nation of Kawawachikamach (081) |
Summary Statistics
| Region | Number of Bands | Total a + b + c |
On Reserve (a) |
On Crown Land (b) |
Off Reserve (c) |
|---|---|---|---|---|---|
| Atlantic | 33 | 32,970 | 20,855 | 27 | 12,088 |
| Quebec | 39 | 72,090 | 49,069 | 1,657 | 21,364 |
| Ontario * | 126 | 175,178 | 83,609 | 1,702 | 89,867 |
| Manitoba | 63 | 130,565 | 80,552 | 919 | 49,094 |
| Saskatchewan | 70 | 128,654 | 62,171 | 1,820 | 64,663 |
| Alberta * | 44 | 103,441 | 63,230 | 2,775 | 37,436 |
| British Columbia | 198 | 125,789 | 59,345 | 322 | 66,122 |
| Yukon * | 16 | 8,285 | 509 | 3,400 | 4,376 |
| Northwest Territories | 26 | 17,068 | 307 | 11,334 | 5,427 |
| Canada | 615 | 794,040 | 419,647 | 23,956 | 350,437 |
* See Source of Data for Band / Registry Group affiliations
On Reserve and/or On Crown Land counts can include individuals living on lands affiliated with First Nations operating under Self-Government Agreements.
| Year | Number of Bands |
Total a + b + c |
On Reserve (a) |
On Crown Land (b) |
Off Reserve (c) |
|---|---|---|---|---|---|
| 1981 | 576 | 323,782 | 203,517 | 23,975 | 96,290 |
| 1982 | 577 | 332,178 | 210,779 | 24,861 | 96,538 |
| 1983 | 578 | 341,968 | 218,117 | 25,439 | 98,412 |
| 1984 | 581 | 348,809 | 223,169 | 25,539 | 100,101 |
| 1985 | 592 | 360,241 | 228,517 | 27,179 | 104,545 |
| 1986 | 592 | 387,829 | 235,642 | 28,545 | 123,642 |
| 1987 | 592 | 415,898 | 242,837 | 25,637 | 147,424 |
| 1988 | 593 | 443,884 | 254,074 | 19,692 | 170,118 |
| 1989 | 596 | 466,337 | 260,760 | 18,911 | 186,666 |
| 1990 | 601 | 490,178 | 273,992 | 19,212 | 196,974 |
| 1991 | 603 | 511,791 | 284,649 | 20,110 | 207,032 |
| 1992 | 604 | 533,461 | 295,032 | 20,631 | 217,798 |
| 1993 | 605 | 553,316 | 305,247 | 21,197 | 226,872 |
| 1994 | 607 | 573,657 | 314,843 | 21,800 | 237,014 |
| 1995 | 608 | 593,050 | 325,453 | 22,466 | 245,131 |
| 1996 | 609 | 610,874 | 331,289 | 23,080 | 256,505 |
| 1997 | 608 | 627,435 | 341,825 | 23,981 | 261,629 |
| 1998 | 609 | 642,414 | 351,671 | 24,056 | 266,687 |
| 1999 | 610 | 659,890 | 360,707 | 24,071 | 275,112 |
| 2000 | 612 | 675,499 | 368,556 | 23,437 | 283,506 |
| 2001 | 612 | 690,101 | 373,121 | 23,567 | 293,413 |
| 2002 | 614 | 704,851 | 380,067 | 23,270 | 301,514 |
| 2003 | 614 | 719,496 | 386,605 | 23,066 | 309,825 |
| 2004 | 614 | 733,626 | 391,459 | 23,963 | 318,204 |
| 2005 | 615 | 748,371 | 397,980 | 24,203 | 326,188 |
| 2006 | 615 | 763,555 | 404,117 | 24,329 | 335,109 |
| 2007 | 615 | 778,050 | 410,889 | 23,697 | 343,464 |
| 2008 | 615 | 794,040 | 419,647 | 23,956 | 350,437 |
On Reserve and/or On Crown Land counts can include individuals living on lands affiliated with First Nations operating under Self-Government Agreements.
| Band Name | Region | Indian Register Population |
|---|---|---|
| Six Nations of the Grand River (121) [Note 1] | Ontario | 23,289 |
| Mohawks of Akwesasne (159) | Ontario | 10,811 |
| Blood (435) | Alberta | 10,498 |
| Kahnawake (070) | Quebec | 9,671 |
| Saddle Lake (462) | Alberta | 8,918 |
| Lac La Ronge (353) | Saskatchewan | 8,715 |
| Peter Ballantyne Cree Nation (355) | Saskatchewan | 8,557 |
| Peguis (269) | Manitoba | 8,468 |
| Mohawks of the Bay of Quinte (164) | Ontario | 7,819 |
| Wikwemikong (175) | Ontario | 7,192 |
| Bigstone Cree Nation (458) | Alberta | 7,103 |
| Cross Lake First Nation (276) | Manitoba | 7,006 |
| Samson (444) | Alberta | 6,992 |
| Fort Alexander (262) | Manitoba | 6,866 |
| Norway House Cree Nation (278) | Manitoba | 6,700 |
| Siksika Nation (430) | Alberta | 6,386 |
| Sandy Bay (283) | Manitoba | 5,551 |
| Oneida Nation of the Thames (169) | Ontario | 5,353 |
| Opaskwayak Cree Nation (315) | Manitoba | 5,125 |
| Montagnais du Lac St.-Jean (076) | Quebec | 4,941 |
There has been one change to these rankings subsequent to last year's edition. Cross Lake First Nation exchanged places with Samson.
Bands in Canada by Size, December 31, 2008
Total Population

Text Description of Bands in Canada by Size, December 31, 2008 - Total Population
| Population | # | % |
|---|---|---|
| <100 persons | 20 | 3 |
| 100 - 249 persons | 77 | 13 |
| 250 - 499 persons | 111 | 18 |
| 500 - 999 persons | 165 | 27 |
| 1,000 - 1,999 persons | 130 | 21 |
| 2,000+ persons | 112 | 18 |
On Reserve and On Crown Land Population

Text Description of Bands in Canada by Size, December 31, 2008 - On Reserve and On Crown Land Population
| Population | # | % |
|---|---|---|
| <100 persons | 94 | 15 |
| 100 - 249 persons | 125 | 20 |
| 250 - 499 persons | 138 | 22 |
| 500 - 999 persons | 145 | 24 |
| 1,000 - 1,999 persons | 63 | 10 |
| 2,000+ persons | 50 | 8 |
"On Reserve and On Crown Land"
includes lands affiliated with First Nations operating under Self-Government Agreements.
615
Average Band membership
1,291
* Please see Types of Residence for definition of "Band"
Registry Groups in Canada by Size, December 31, 2008
Total Population

Text Description of Registry Groups in Canada by Size, December 31, 2008 - Total Population
| Population | # | % |
|---|---|---|
| <100 persons | 20 | 3 |
| 100 - 249 persons | 78 | 12 |
| 250 - 499 persons | 113 | 18 |
| 500 - 999 persons | 170 | 27 |
| 1,000 - 1,999 persons | 135 | 21 |
| 2,000+ persons | 114 | 18 |
On Reserve and On Crown Land Population

Text Description of Registry Groups in Canada by Size, December 31, 2008 - On Reserve and On Crown Land Population
| Population | # | % |
|---|---|---|
| <100 persons | 95 | 15 |
| 100 - 249 persons | 129 | 20 |
| 250 - 499 persons | 141 | 22 |
| 500 - 999 persons | 147 | 23 |
| 1,000 - 1,999 persons | 68 | 11 |
| 2,000+ persons | 50 | 8 |
"On Reserve and On Crown Land"
includes lands affiliated with First Nations operating under Self-Government Agreements.
630
Average Registry Group membership
1,260
* Please see Types of Residence for definition of "Registry Group"
Registered Indian Population, On and Off Reserve by Age and Sex, December 31, 2008
Atlantic Region
| Age | On Reserve * | Off Reserve | Total | |||||||||
|---|---|---|---|---|---|---|---|---|---|---|---|---|
| Male | Female | Male | Female | Male | Female | |||||||
| # | % | # | % | # | % | # | % | # | % | # | % | |
| 0-4 | 929 | 4.4 | 851 | 4.1 | 268 | 2.2 | 240 | 2.0 | 1,197 | 3.6 | 1,091 | 3.3 |
| 5-9 | 1,112 | 5.3 | 1,024 | 4.9 | 364 | 3.0 | 376 | 3.1 | 1,476 | 4.5 | 1,400 | 4.2 |
| 10-14 | 1,121 | 5.4 | 1,132 | 5.4 | 435 | 3.6 | 457 | 3.8 | 1,556 | 4.7 | 1,589 | 4.8 |
| 15-19 | 1,103 | 5.3 | 1,077 | 5.2 | 480 | 4.0 | 417 | 3.4 | 1,583 | 4.8 | 1,494 | 4.5 |
| 20-24 | 973 | 4.7 | 904 | 4.3 | 429 | 3.5 | 430 | 3.6 | 1,402 | 4.3 | 1,334 | 4.0 |
| 25-29 | 813 | 3.9 | 841 | 4.0 | 425 | 3.5 | 462 | 3.8 | 1,238 | 3.8 | 1,303 | 4.0 |
| 30-34 | 733 | 3.5 | 732 | 3.5 | 438 | 3.6 | 425 | 3.5 | 1,171 | 3.6 | 1,157 | 3.5 |
| 35-39 | 789 | 3.8 | 728 | 3.5 | 540 | 4.5 | 548 | 4.5 | 1,329 | 4.0 | 1,276 | 3.9 |
| 40-44 | 721 | 3.5 | 747 | 3.6 | 519 | 4.3 | 572 | 4.7 | 1,240 | 3.8 | 1,319 | 4.0 |
| 45-49 | 632 | 3.0 | 665 | 3.2 | 448 | 3.7 | 600 | 5.0 | 1,080 | 3.3 | 1,265 | 3.8 |
| 50-54 | 512 | 2.5 | 505 | 2.4 | 360 | 3.0 | 572 | 4.7 | 872 | 2.6 | 1,077 | 3.3 |
| 55-59 | 350 | 1.7 | 393 | 1.9 | 240 | 2.0 | 413 | 3.4 | 590 | 1.8 | 806 | 2.4 |
| 60-64 | 249 | 1.2 | 287 | 1.4 | 194 | 1.6 | 352 | 2.9 | 443 | 1.3 | 639 | 1.9 |
| 65 + | 402 | 1.9 | 557 | 2.7 | 389 | 3.2 | 695 | 5.7 | 791 | 2.4 | 1,252 | 3.8 |
| Total | 10,439 | 50.0 | 10,443 | 50.0 | 5,529 | 45.7 | 6,559 | 54.3 | 15,968 | 48.4 | 17,002 | 51.6 |
| Total - both sexes | 20,882 63% |
12,088 37% |
32,970 100% |
|||||||||
* "On Reserve"
includes individuals living on Crown land and on other lands affiliated with First Nations operating under Self-Government Agreements.
Registered Indian Population, by Type of Residence and Selected Age Groups, December 31, 2008
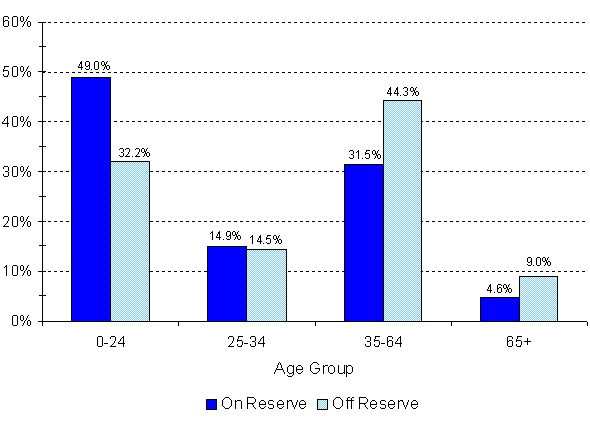
Text Description of Registered Indian Population, by Type of Residence and Selected Age Groups, December 31, 2008 - Atlantic
| Age Group | Populations | Percentages | ||
|---|---|---|---|---|
| On Reserve | Off Reserve | On Reserve | Off Reserve | |
| 0-24 | 10,226 | 3,896 | 49.0% | 32.2% |
| 25-34 | 3,119 | 1,750 | 14.9% | 14.5% |
| 35-64 | 6,578 | 5,358 | 31.5% | 44.3% |
| 65+ | 959 | 1,084 | 4.6% | 9.0% |
Quebec Region
| Age | On Reserve * | Off Reserve | Total | |||||||||
|---|---|---|---|---|---|---|---|---|---|---|---|---|
| Male | Female | Male | Female | Male | Female | |||||||
| # | % | # | % | # | % | # | % | # | % | # | % | |
| 0-4 | 2,114 | 4.2 | 1,850 | 3.6 | 417 | 2.0 | 355 | 1.7 | 2,531 | 3.5 | 2,205 | 3.1 |
| 5-9 | 2,492 | 4.9 | 2,303 | 4.5 | 510 | 2.4 | 524 | 2.5 | 3,002 | 4.2 | 2,827 | 3.9 |
| 10-14 | 2,555 | 5.0 | 2,470 | 4.9 | 668 | 3.1 | 585 | 2.7 | 3,223 | 4.5 | 3,055 | 4.2 |
| 15-19 | 2,661 | 5.2 | 2,483 | 4.9 | 687 | 3.2 | 694 | 3.2 | 3,348 | 4.6 | 3,177 | 4.4 |
| 20-24 | 2,110 | 4.2 | 2,114 | 4.2 | 643 | 3.0 | 671 | 3.1 | 2,753 | 3.8 | 2,785 | 3.9 |
| 25-29 | 1,888 | 3.7 | 1,816 | 3.6 | 739 | 3.5 | 705 | 3.3 | 2,627 | 3.6 | 2,521 | 3.5 |
| 30-34 | 1,800 | 3.5 | 1,699 | 3.3 | 701 | 3.3 | 786 | 3.7 | 2,501 | 3.5 | 2,485 | 3.4 |
| 35-39 | 1,889 | 3.7 | 1,804 | 3.6 | 761 | 3.6 | 837 | 3.9 | 2,650 | 3.7 | 2,641 | 3.7 |
| 40-44 | 1,756 | 3.5 | 1,766 | 3.5 | 854 | 4.0 | 985 | 4.6 | 2,610 | 3.6 | 2,751 | 3.8 |
| 45-49 | 1,584 | 3.1 | 1,600 | 3.2 | 874 | 4.1 | 1,035 | 4.8 | 2,458 | 3.4 | 2,635 | 3.7 |
| 50-54 | 1,251 | 2.5 | 1,378 | 2.7 | 735 | 3.4 | 1,070 | 5.0 | 1,986 | 2.8 | 2,448 | 3.4 |
| 55-59 | 937 | 1.8 | 1,031 | 2.0 | 611 | 2.9 | 774 | 3.6 | 1,548 | 2.1 | 1,805 | 2.5 |
| 60-64 | 728 | 1.4 | 852 | 1.7 | 446 | 2.1 | 687 | 3.2 | 1,174 | 1.6 | 1,539 | 2.1 |
| 65 + | 1,624 | 3.2 | 2,171 | 4.3 | 1,051 | 4.9 | 1,959 | 9.2 | 2,675 | 3.7 | 4,130 | 5.7 |
| Total | 25,389 | 50.1 | 25,337 | 49.9 | 9,697 | 45.4 | 11,667 | 54.6 | 35,086 | 48.7 | 37,004 | 51.3 |
| Total - both sexes | 50,726 70% |
21,364 30% |
72,090 100% |
|||||||||
* "On Reserve"
includes individuals living on Crown land and on other lands affiliated with First Nations operating under Self-Government Agreements.
Registered Indian Population, by Type of Residence and Selected Age Groups, December 31, 2008

Text Description of Registered Indian Population, by Type of Residence and Selected Age Groups, December 31, 2008 - Quebec
| Age Group | Populations | Percentages | ||
|---|---|---|---|---|
| On Reserve | Off Reserve | On Reserve | Off Reserve | |
| 0-24 | 23,152 | 5,754 | 45.6% | 26.9% |
| 25-34 | 7,203 | 2,931 | 14.2% | 13.7% |
| 35-64 | 16,576 | 9,669 | 32.7% | 45.3% |
| 65+ | 3,795 | 3,010 | 7.5% | 14.1% |
Ontario Region
| Age | On Reserve * | Off Reserve | Total | |||||||||
|---|---|---|---|---|---|---|---|---|---|---|---|---|
| Male | Female | Male | Female | Male | Female | |||||||
| # | % | # | % | # | % | # | % | # | % | # | % | |
| 0-4 | 2,756 | 3.2 | 2,611 | 3.1 | 1,598 | 1.8 | 1,528 | 1.7 | 4,354 | 2.5 | 4,139 | 2.4 |
| 5-9 | 4,044 | 4.7 | 3,835 | 4.5 | 2,598 | 2.9 | 2,576 | 2.9 | 6,642 | 3.8 | 6,411 | 3.7 |
| 10-14 | 4,402 | 5.2 | 4,146 | 4.9 | 3,324 | 3.7 | 3,152 | 3.5 | 7,726 | 4.4 | 7,298 | 4.2 |
| 15-19 | 4,378 | 5.1 | 4,275 | 5.0 | 3,555 | 4.0 | 3,363 | 3.7 | 7,933 | 4.5 | 7,638 | 4.4 |
| 20-24 | 4,031 | 4.7 | 3,637 | 4.3 | 3,274 | 3.6 | 3,219 | 3.6 | 7,305 | 4.2 | 6,856 | 3.9 |
| 25-29 | 3,353 | 3.9 | 3,248 | 3.8 | 3,222 | 3.6 | 3,456 | 3.8 | 6,575 | 3.8 | 6,704 | 3.8 |
| 30-34 | 3,083 | 3.6 | 2,863 | 3.4 | 3,275 | 3.6 | 3,476 | 3.9 | 6,358 | 3.6 | 6,339 | 3.6 |
| 35-39 | 2,964 | 3.5 | 2,793 | 3.3 | 3,664 | 4.1 | 3,961 | 4.4 | 6,628 | 3.8 | 6,754 | 3.9 |
| 40-44 | 3,093 | 3.6 | 2,831 | 3.3 | 3,771 | 4.2 | 4,141 | 4.6 | 6,864 | 3.9 | 6,972 | 4.0 |
| 45-49 | 2,862 | 3.4 | 2,801 | 3.3 | 3,596 | 4.0 | 4,277 | 4.8 | 6,458 | 3.7 | 7,078 | 4.0 |
| 50-54 | 2,504 | 2.9 | 2,451 | 2.9 | 2,772 | 3.1 | 3,759 | 4.2 | 5,276 | 3.0 | 6,210 | 3.5 |
| 55-59 | 1,809 | 2.1 | 1,813 | 2.1 | 2,080 | 2.3 | 2,958 | 3.3 | 3,889 | 2.2 | 4,771 | 2.7 |
| 60-64 | 1,362 | 1.6 | 1,435 | 1.7 | 1,584 | 1.8 | 2,487 | 2.8 | 2,946 | 1.7 | 3,922 | 2.2 |
| 65 + | 2,613 | 3.1 | 3,318 | 3.9 | 3,410 | 3.8 | 5,791 | 6.4 | 6,023 | 3.4 | 9,109 | 5.2 |
| Total | 43,254 | 50.7 | 42,057 | 49.3 | 41,723 | 46.4 | 48,144 | 53.6 | 84,977 | 48.5 | 90,201 | 51.5 |
| Total - both sexes | 85,311 49% |
89,867 51% |
175,178 100% |
|||||||||
* "On Reserve"
includes individuals living on Crown land and on other lands affiliated with First Nations operating under Self-Government Agreements.
Registered Indian Population, by Type of Residence and Selected Age Groups, December 31, 2008

Text Description of Registered Indian Population, by Type of Residence and Selected Age Groups, December 31, 2008 - Ontario
| Age Group | Populations | Percentages | ||
|---|---|---|---|---|
| On Reserve | Off Reserve | On Reserve | Off Reserve | |
| 0-24 | 38,115 | 28,187 | 44.7% | 31.4% |
| 25-34 | 12,547 | 13,429 | 14.7% | 14.9% |
| 35-64 | 28,718 | 39,050 | 33.7% | 43.5% |
| 65+ | 5,931 | 9,201 | 7.0% | 10.2% |
Manitoba Region
| Age | On Reserve * | Off Reserve | Total | |||||||||
|---|---|---|---|---|---|---|---|---|---|---|---|---|
| Male | Female | Male | Female | Male | Female | |||||||
| # | % | # | % | # | % | # | % | # | % | # | % | |
| 0-4 | 4,763 | 5.8 | 4,555 | 5.6 | 1,842 | 3.8 | 1,827 | 3.7 | 6,605 | 5.1 | 6,382 | 4.9 |
| 5-9 | 4,932 | 6.1 | 4,692 | 5.8 | 2,326 | 4.7 | 2,262 | 4.6 | 7,258 | 5.6 | 6,954 | 5.3 |
| 10-14 | 4,800 | 5.9 | 4,575 | 5.6 | 2,486 | 5.1 | 2,456 | 5.0 | 7,286 | 5.6 | 7,031 | 5.4 |
| 15-19 | 4,789 | 5.9 | 4,660 | 5.7 | 2,472 | 5.0 | 2,494 | 5.1 | 7,261 | 5.6 | 7,154 | 5.5 |
| 20-24 | 3,983 | 4.9 | 3,733 | 4.6 | 1,973 | 4.0 | 1,955 | 4.0 | 5,956 | 4.6 | 5,688 | 4.4 |
| 25-29 | 3,266 | 4.0 | 2,983 | 3.7 | 1,770 | 3.6 | 1,778 | 3.6 | 5,036 | 3.9 | 4,761 | 3.6 |
| 30-34 | 2,768 | 3.4 | 2,676 | 3.3 | 1,818 | 3.7 | 1,863 | 3.8 | 4,586 | 3.5 | 4,539 | 3.5 |
| 35-39 | 2,717 | 3.3 | 2,657 | 3.3 | 1,834 | 3.7 | 2,132 | 4.3 | 4,551 | 3.5 | 4,789 | 3.7 |
| 40-44 | 2,587 | 3.2 | 2,339 | 2.9 | 1,814 | 3.7 | 2,125 | 4.3 | 4,401 | 3.4 | 4,464 | 3.4 |
| 45-49 | 2,160 | 2.7 | 1,985 | 2.4 | 1,502 | 3.1 | 1,947 | 4.0 | 3,662 | 2.8 | 3,932 | 3.0 |
| 50-54 | 1,558 | 1.9 | 1,531 | 1.9 | 1,089 | 2.2 | 1,460 | 3.0 | 2,647 | 2.0 | 2,991 | 2.3 |
| 55-59 | 1,102 | 1.4 | 1,046 | 1.3 | 743 | 1.5 | 1,126 | 2.3 | 1,845 | 1.4 | 2,172 | 1.7 |
| 60-64 | 858 | 1.1 | 813 | 1.0 | 549 | 1.1 | 835 | 1.7 | 1,407 | 1.1 | 1,648 | 1.3 |
| 65 + | 1,414 | 1.7 | 1,529 | 1.9 | 963 | 2.0 | 1,653 | 3.4 | 2,377 | 1.8 | 3,182 | 2.4 |
| Total | 41,697 | 51.2 | 39,774 | 48.8 | 23,181 | 47.2 | 25,913 | 52.8 | 64,878 | 49.7 | 65,687 | 50.3 |
| Total - both sexes | 81,471 62% |
49,094 38% |
130,565 100% |
|||||||||
* "On Reserve"
includes individuals living on Crown land and on other lands affiliated with First Nations operating under Self-Government Agreements.
Registered Indian Population, by Type of Residence and Selected Age Groups, December 31, 2008
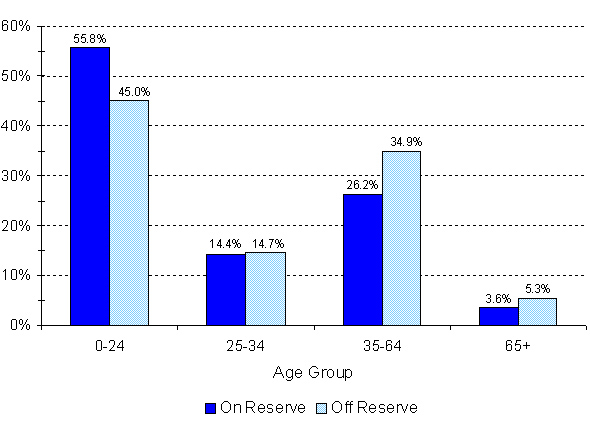
Text Description of Registered Indian Population, by Type of Residence and Selected Age Groups, December 31, 2008 - Manitoba
| Age Group | Populations | Percentages | ||
|---|---|---|---|---|
| On Reserve | Off Reserve | On Reserve | Off Reserve | |
| 0-24 | 45,482 | 22,093 | 55.8% | 45.0% |
| 25-34 | 11,693 | 7,229 | 14.4% | 14.7% |
| 35-64 | 21,353 | 17,156 | 26.2% | 34.9% |
| 65+ | 2,943 | 2,616 | 3.6% | 5.3% |
Saskatchewan Region
| Age | On Reserve * | Off Reserve | Total | |||||||||
|---|---|---|---|---|---|---|---|---|---|---|---|---|
| Male | Female | Male | Female | Male | Female | |||||||
| # | % | # | % | # | % | # | % | # | % | # | % | |
| 0-4 | 3,488 | 5.5 | 3,367 | 5.3 | 2,739 | 4.2 | 2,668 | 4.1 | 6,227 | 4.8 | 6,035 | 4.7 |
| 5-9 | 3,882 | 6.1 | 3,793 | 5.9 | 3,301 | 5.1 | 3,287 | 5.1 | 7,183 | 5.6 | 7,080 | 5.5 |
| 10-14 | 3,877 | 6.1 | 3,811 | 6.0 | 3,325 | 5.1 | 3,342 | 5.2 | 7,202 | 5.6 | 7,153 | 5.6 |
| 15-19 | 4,068 | 6.4 | 3,853 | 6.0 | 3,511 | 5.4 | 3,371 | 5.2 | 7,579 | 5.9 | 7,224 | 5.6 |
| 20-24 | 3,288 | 5.1 | 3,131 | 4.9 | 3,097 | 4.8 | 3,125 | 4.8 | 6,385 | 5.0 | 6,256 | 4.9 |
| 25-29 | 2,540 | 4.0 | 2,396 | 3.7 | 2,649 | 4.1 | 2,698 | 4.2 | 5,189 | 4.0 | 5,094 | 4.0 |
| 30-34 | 2,209 | 3.5 | 2,117 | 3.3 | 2,379 | 3.7 | 2,556 | 4.0 | 4,588 | 3.6 | 4,673 | 3.6 |
| 35-39 | 2,062 | 3.2 | 1,995 | 3.1 | 2,379 | 3.7 | 2,602 | 4.0 | 4,441 | 3.5 | 4,597 | 3.6 |
| 40-44 | 1,905 | 3.0 | 1,793 | 2.8 | 2,271 | 3.5 | 2,636 | 4.1 | 4,176 | 3.2 | 4,429 | 3.4 |
| 45-49 | 1,514 | 2.4 | 1,456 | 2.3 | 1,855 | 2.9 | 2,273 | 3.5 | 3,369 | 2.6 | 3,729 | 2.9 |
| 50-54 | 1,180 | 1.8 | 1,094 | 1.7 | 1,211 | 1.9 | 1,668 | 2.6 | 2,391 | 1.9 | 2,762 | 2.1 |
| 55-59 | 890 | 1.4 | 794 | 1.2 | 739 | 1.1 | 1,184 | 1.8 | 1,629 | 1.3 | 1,978 | 1.5 |
| 60-64 | 620 | 1.0 | 554 | 0.9 | 492 | 0.8 | 879 | 1.4 | 1,112 | 0.9 | 1,433 | 1.1 |
| 65 + | 1,137 | 1.8 | 1,177 | 1.8 | 821 | 1.3 | 1,605 | 2.5 | 1,958 | 1.5 | 2,782 | 2.2 |
| Total | 32,660 | 51.0 | 31,331 | 49.0 | 30,769 | 47.6 | 33,894 | 52.4 | 63,429 | 49.3 | 65,225 | 50.7 |
| Total - both sexes | 63,991 50% |
64,663 50% |
128,654 100% |
|||||||||
* "On Reserve"
includes individuals living on Crown land and on other lands affiliated with First Nations operating under Self-Government Agreements.
Registered Indian Population, by Type of Residence and Selected Age Groups, December 31, 2008
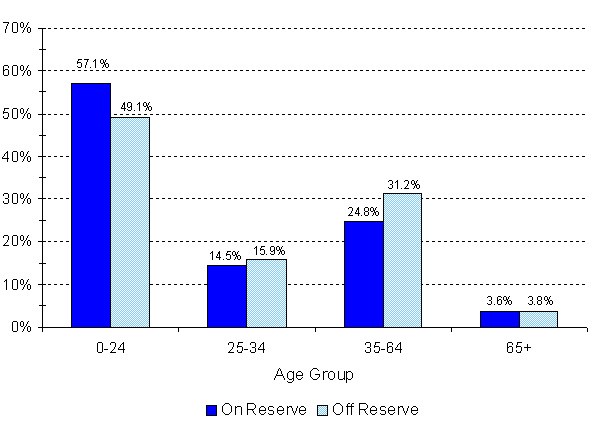
Text Description of Registered Indian Population, by Type of Residence and Selected Age Groups, December 31, 2008 - Saskatchewan
| Age Group | Populations | Percentages | ||
|---|---|---|---|---|
| On Reserve | Off Reserve | On Reserve | Off Reserve | |
| 0-24 | 36,558 | 31,766 | 57.1% | 49.1% |
| 25-34 | 9,262 | 10,282 | 14.5% | 15.9% |
| 35-64 | 15,857 | 20,189 | 24.8% | 31.2% |
| 65+ | 2,314 | 2,426 | 3.6% | 3.8% |
Alberta Region
| Age | On Reserve * | Off Reserve | Total | |||||||||
|---|---|---|---|---|---|---|---|---|---|---|---|---|
| Male | Female | Male | Female | Male | Female | |||||||
| # | % | # | % | # | % | # | % | # | % | # | % | |
| 0-4 | 3,101 | 4.7 | 3,112 | 4.7 | 1,545 | 4.1 | 1,522 | 4.1 | 4,646 | 4.5 | 4,634 | 4.5 |
| 5-9 | 3,990 | 6.0 | 3,700 | 5.6 | 1,810 | 4.8 | 1,753 | 4.7 | 5,800 | 5.6 | 5,453 | 5.3 |
| 10-14 | 4,241 | 6.4 | 3,944 | 6.0 | 1,773 | 4.7 | 1,680 | 4.5 | 6,014 | 5.8 | 5,624 | 5.4 |
| 15-19 | 4,187 | 6.3 | 3,861 | 5.8 | 1,727 | 4.6 | 1,724 | 4.6 | 5,914 | 5.7 | 5,585 | 5.4 |
| 20-24 | 3,365 | 5.1 | 3,184 | 4.8 | 1,633 | 4.4 | 1,684 | 4.5 | 4,998 | 4.8 | 4,868 | 4.7 |
| 25-29 | 2,669 | 4.0 | 2,648 | 4.0 | 1,502 | 4.0 | 1,668 | 4.5 | 4,171 | 4.0 | 4,316 | 4.2 |
| 30-34 | 2,166 | 3.3 | 2,116 | 3.2 | 1,502 | 4.0 | 1,571 | 4.2 | 3,668 | 3.5 | 3,687 | 3.6 |
| 35-39 | 2,015 | 3.1 | 2,077 | 3.1 | 1,406 | 3.8 | 1,535 | 4.1 | 3,421 | 3.3 | 3,612 | 3.5 |
| 40-44 | 1,954 | 3.0 | 1,895 | 2.9 | 1,342 | 3.6 | 1,562 | 4.2 | 3,296 | 3.2 | 3,457 | 3.3 |
| 45-49 | 1,726 | 2.6 | 1,800 | 2.7 | 1,069 | 2.9 | 1,366 | 3.6 | 2,795 | 2.7 | 3,166 | 3.1 |
| 50-54 | 1,269 | 1.9 | 1,303 | 2.0 | 717 | 1.9 | 1,053 | 2.8 | 1,986 | 1.9 | 2,356 | 2.3 |
| 55-59 | 891 | 1.3 | 946 | 1.4 | 465 | 1.2 | 843 | 2.3 | 1,356 | 1.3 | 1,789 | 1.7 |
| 60-64 | 605 | 0.9 | 652 | 1.0 | 349 | 0.9 | 638 | 1.7 | 954 | 0.9 | 1,290 | 1.2 |
| 65 + | 1,251 | 1.9 | 1,337 | 2.0 | 692 | 1.8 | 1,305 | 3.5 | 1,943 | 1.9 | 2,642 | 2.6 |
| Total | 33,430 | 50.6 | 32,575 | 49.4 | 17,532 | 46.8 | 19,904 | 53.2 | 50,962 | 49.3 | 52,479 | 50.7 |
| Total - both sexes | 66,005 64% |
37,436 36% |
103,441 100% |
|||||||||
* "On Reserve"
includes individuals living on Crown land and on other lands affiliated with First Nations operating under Self-Government Agreements.
Registered Indian Population, by Type of Residence and Selected Age Groups, December 31, 2008

Text Description of Registered Indian Population, by Type of Residence and Selected Age Groups, December 31, 2008 - Alberta
| Age Group | Populations | Percentages | ||
|---|---|---|---|---|
| On Reserve | Off Reserve | On Reserve | Off Reserve | |
| 0-24 | 36,685 | 16,851 | 55.6% | 45.0% |
| 25-34 | 9,599 | 6,243 | 14.5% | 16.7% |
| 35-64 | 17,133 | 12,345 | 26.0% | 33.0% |
| 65+ | 2,588 | 1,997 | 3.9% | 5.3% |
British Columbia Region
| Age | On Reserve * | Off Reserve | Total | |||||||||
|---|---|---|---|---|---|---|---|---|---|---|---|---|
| Male | Female | Male | Female | Male | Female | |||||||
| # | % | # | % | # | % | # | % | # | % | # | % | |
| 0-4 | 2,296 | 3.8 | 2,107 | 3.5 | 1,869 | 2.8 | 1,885 | 2.9 | 4,165 | 3.3 | 3,992 | 3.2 |
| 5-9 | 2,523 | 4.2 | 2,384 | 4.0 | 2,542 | 3.8 | 2,459 | 3.7 | 5,065 | 4.0 | 4,843 | 3.9 |
| 10-14 | 2,726 | 4.6 | 2,487 | 4.2 | 2,791 | 4.2 | 2,736 | 4.1 | 5,517 | 4.4 | 5,223 | 4.2 |
| 15-19 | 3,168 | 5.3 | 2,886 | 4.8 | 3,001 | 4.5 | 2,751 | 4.2 | 6,169 | 4.9 | 5,637 | 4.5 |
| 20-24 | 2,791 | 4.7 | 2,581 | 4.3 | 2,870 | 4.3 | 2,830 | 4.3 | 5,661 | 4.5 | 5,411 | 4.3 |
| 25-29 | 2,428 | 4.1 | 2,085 | 3.5 | 2,653 | 4.0 | 2,719 | 4.1 | 5,081 | 4.0 | 4,804 | 3.8 |
| 30-34 | 2,072 | 3.5 | 1,872 | 3.1 | 2,519 | 3.8 | 2,753 | 4.2 | 4,591 | 3.6 | 4,625 | 3.7 |
| 35-39 | 2,008 | 3.4 | 1,820 | 3.1 | 2,756 | 4.2 | 2,949 | 4.5 | 4,764 | 3.8 | 4,769 | 3.8 |
| 40-44 | 2,171 | 3.6 | 2,011 | 3.4 | 2,560 | 3.9 | 2,979 | 4.5 | 4,731 | 3.8 | 4,990 | 4.0 |
| 45-49 | 2,255 | 3.8 | 2,195 | 3.7 | 2,404 | 3.6 | 3,072 | 4.6 | 4,659 | 3.7 | 5,267 | 4.2 |
| 50-54 | 1,867 | 3.1 | 1,813 | 3.0 | 1,706 | 2.6 | 2,378 | 3.6 | 3,573 | 2.8 | 4,191 | 3.3 |
| 55-59 | 1,508 | 2.5 | 1,343 | 2.3 | 1,156 | 1.7 | 1,751 | 2.6 | 2,664 | 2.1 | 3,094 | 2.5 |
| 60-64 | 1,074 | 1.8 | 1,007 | 1.7 | 801 | 1.2 | 1,309 | 2.0 | 1,875 | 1.5 | 2,316 | 1.8 |
| 65 + | 1,961 | 3.3 | 2,228 | 3.7 | 1,427 | 2.2 | 2,496 | 3.8 | 3,388 | 2.7 | 4,724 | 3.8 |
| Total | 30,848 | 51.7 | 28,819 | 48.3 | 31,055 | 47.0 | 35,067 | 53.0 | 61,903 | 49.2 | 63,886 | 50.8 |
| Total - both sexes | 59,667 47% |
66,122 53% |
125,789 100% |
|||||||||
* "On Reserve"
includes individuals living on Crown land and on other lands affiliated with First Nations operating under Self-Government Agreements.
Registered Indian Population, by Type of Residence and Selected Age Groups, December 31, 2008

Text Description of Registered Indian Population, by Type of Residence and Selected Age Groups, December 31, 2008 - British Columbia
| Age Group | Populations | Percentages | ||
|---|---|---|---|---|
| On Reserve | Off Reserve | On Reserve | Off Reserve | |
| 0-24 | 25,949 | 25,734 | 43.5% | 38.9% |
| 25-34 | 8,457 | 10,644 | 14.2% | 16.1% |
| 35-64 | 21,072 | 25,821 | 35.3% | 39.1% |
| 65+ | 4,189 | 3,923 | 7.0% | 5.9% |
Yukon Region
| Age | On Reserve * | Off Reserve | Total | |||||||||
|---|---|---|---|---|---|---|---|---|---|---|---|---|
| Male | Female | Male | Female | Male | Female | |||||||
| # | % | # | % | # | % | # | % | # | % | # | % | |
| 0-4 | 101 | 2.6 | 77 | 2.0 | 112 | 2.6 | 98 | 2.2 | 213 | 2.6 | 175 | 2.1 |
| 5-9 | 138 | 3.5 | 132 | 3.4 | 158 | 3.6 | 144 | 3.3 | 296 | 3.6 | 276 | 3.3 |
| 10-14 | 170 | 4.3 | 148 | 3.8 | 165 | 3.8 | 155 | 3.5 | 335 | 4.0 | 303 | 3.7 |
| 15-19 | 199 | 5.1 | 185 | 4.7 | 167 | 3.8 | 169 | 3.9 | 366 | 4.4 | 354 | 4.3 |
| 20-24 | 157 | 4.0 | 142 | 3.6 | 182 | 4.2 | 185 | 4.2 | 339 | 4.1 | 327 | 3.9 |
| 25-29 | 134 | 3.4 | 133 | 3.4 | 213 | 4.9 | 193 | 4.4 | 347 | 4.2 | 326 | 3.9 |
| 30-34 | 136 | 3.5 | 110 | 2.8 | 164 | 3.7 | 170 | 3.9 | 300 | 3.6 | 280 | 3.4 |
| 35-39 | 173 | 4.4 | 139 | 3.6 | 198 | 4.5 | 181 | 4.1 | 371 | 4.5 | 320 | 3.9 |
| 40-44 | 205 | 5.2 | 142 | 3.6 | 194 | 4.4 | 223 | 5.1 | 399 | 4.8 | 365 | 4.4 |
| 45-49 | 216 | 5.5 | 143 | 3.7 | 157 | 3.6 | 238 | 5.4 | 373 | 4.5 | 381 | 4.6 |
| 50-54 | 142 | 3.6 | 112 | 2.9 | 91 | 2.1 | 172 | 3.9 | 233 | 2.8 | 284 | 3.4 |
| 55-59 | 84 | 2.1 | 96 | 2.5 | 64 | 1.5 | 145 | 3.3 | 148 | 1.8 | 241 | 2.9 |
| 60-64 | 85 | 2.2 | 66 | 1.7 | 61 | 1.4 | 109 | 2.5 | 146 | 1.8 | 175 | 2.1 |
| 65 + | 169 | 4.3 | 175 | 4.5 | 86 | 2.0 | 182 | 4.2 | 255 | 3.1 | 357 | 4.3 |
| Total | 2,109 | 54.0 | 1,800 | 46.0 | 2,012 | 46.0 | 2,364 | 54.0 | 4,121 | 49.7 | 4,164 | 50.3 |
| Total - both sexes | 3,909 47% |
4,376 53% |
8,285 100% |
|||||||||
* "On Reserve"
includes individuals living on Crown land and on other lands affiliated with First Nations operating under Self-Government Agreements.
Registered Indian Population, by Type of Residence and Selected Age Groups, December 31, 2008
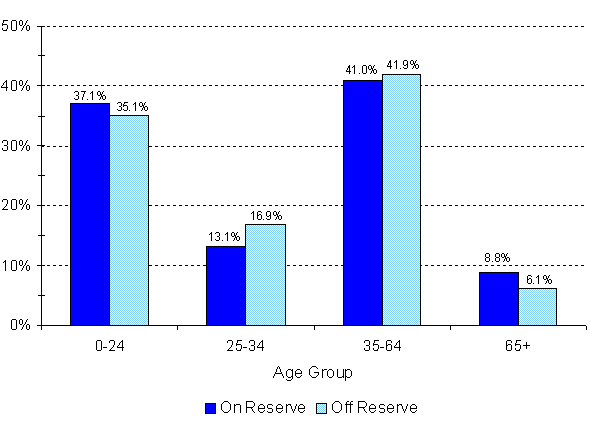
Text Description of Registered Indian Population, by Type of Residence and Selected Age Groups, December 31, 2008 - Yukon
| Age Group | Populations | Percentages | ||
|---|---|---|---|---|
| On Reserve | Off Reserve | On Reserve | Off Reserve | |
| 0-24 | 1,449 | 1,535 | 37.1% | 35.1% |
| 25-34 | 513 | 740 | 13.1% | 16.9% |
| 35-64 | 1,603 | 1,833 | 41.0% | 41.9% |
| 65+ | 344 | 268 | 8.8% | 6.1% |
Northwest Territories Region
| Age | On Reserve * | Off Reserve | Total | |||||||||
|---|---|---|---|---|---|---|---|---|---|---|---|---|
| Male | Female | Male | Female | Male | Female | |||||||
| # | % | # | % | # | % | # | % | # | % | # | % | |
| 0-4 | 502 | 4.3 | 438 | 3.8 | 158 | 2.9 | 147 | 2.7 | 660 | 3.9 | 585 | 3.4 |
| 5-9 | 318 | 2.7 | 345 | 3.0 | 358 | 6.6 | 390 | 7.2 | 676 | 4.0 | 735 | 4.3 |
| 10-14 | 615 | 5.3 | 575 | 4.9 | 206 | 3.8 | 194 | 3.6 | 821 | 4.8 | 769 | 4.5 |
| 15-19 | 688 | 5.9 | 654 | 5.6 | 215 | 4.0 | 228 | 4.2 | 903 | 5.3 | 882 | 5.2 |
| 20-24 | 588 | 5.1 | 551 | 4.7 | 201 | 3.7 | 193 | 3.6 | 789 | 4.6 | 744 | 4.4 |
| 25-29 | 474 | 4.1 | 451 | 3.9 | 201 | 3.7 | 221 | 4.1 | 675 | 4.0 | 672 | 3.9 |
| 30-34 | 379 | 3.3 | 410 | 3.5 | 198 | 3.6 | 226 | 4.2 | 577 | 3.4 | 636 | 3.7 |
| 35-39 | 477 | 4.1 | 430 | 3.7 | 252 | 4.6 | 245 | 4.5 | 729 | 4.3 | 675 | 4.0 |
| 40-44 | 452 | 3.9 | 426 | 3.7 | 199 | 3.7 | 242 | 4.5 | 651 | 3.8 | 668 | 3.9 |
| 45-49 | 352 | 3.0 | 383 | 3.3 | 165 | 3.0 | 214 | 3.9 | 517 | 3.0 | 597 | 3.5 |
| 50-54 | 261 | 2.2 | 304 | 2.6 | 108 | 2.0 | 165 | 3.0 | 369 | 2.2 | 469 | 2.7 |
| 55-59 | 216 | 1.9 | 210 | 1.8 | 86 | 1.6 | 132 | 2.4 | 302 | 1.8 | 342 | 2.0 |
| 60-64 | 167 | 1.4 | 152 | 1.3 | 66 | 1.2 | 121 | 2.2 | 233 | 1.4 | 273 | 1.6 |
| 65 + | 404 | 3.5 | 419 | 3.6 | 95 | 1.8 | 201 | 3.7 | 499 | 2.9 | 620 | 3.6 |
| Total | 5,893 | 50.6 | 5,748 | 49.4 | 2,508 | 46.2 | 2,919 | 53.8 | 8,401 | 49.2 | 8,667 | 50.8 |
| Total - both sexes | 11,641 68% |
5,427 32% |
17,068 100% |
|||||||||
* "On Reserve"
includes individuals living on Crown land and on other lands affiliated with First Nations operating under Self-Government Agreements.
Registered Indian Population, by Type of Residence and Selected Age Groups, December 31, 2008

Text Description of Registered Indian Population, by Type of Residence and Selected Age Groups, December 31, 2008 - Northwest Territories
| Age Group | Populations | Percentages | ||
|---|---|---|---|---|
| On Reserve | Off Reserve | On Reserve | Off Reserve | |
| 0-24 | 5,274 | 2,290 | 45.3% | 42.2% |
| 25-34 | 1,714 | 846 | 14.7% | 15.6% |
| 35-64 | 3,830 | 1,995 | 32.9% | 36.8% |
| 65+ | 823 | 296 | 7.1% | 5.5% |
Canada
| Age | On Reserve * | Off Reserve | Total | |||||||||
|---|---|---|---|---|---|---|---|---|---|---|---|---|
| Male | Female | Male | Female | Male | Female | |||||||
| # | % | # | % | # | % | # | % | # | % | # | % | |
| 0-4 | 20,050 | 4.5 | 18,968 | 4.3 | 10,548 | 3.0 | 10,270 | 2.9 | 30,598 | 3.9 | 29,238 | 3.7 |
| 5-9 | 23,431 | 5.3 | 22,208 | 5.0 | 13,967 | 4.0 | 13,771 | 3.9 | 37,398 | 4.7 | 35,979 | 4.5 |
| 10-14 | 24,507 | 5.5 | 23,288 | 5.2 | 15,173 | 4.3 | 14,757 | 4.2 | 39,680 | 5.0 | 38,045 | 4.8 |
| 15-19 | 25,241 | 5.7 | 23,934 | 5.4 | 15,815 | 4.5 | 15,211 | 4.3 | 41,056 | 5.2 | 39,145 | 4.9 |
| 20-24 | 21,286 | 4.8 | 19,977 | 4.5 | 14,302 | 4.1 | 14,292 | 4.1 | 35,588 | 4.5 | 34,269 | 4.3 |
| 25-29 | 17,565 | 4.0 | 16,601 | 3.7 | 13,374 | 3.8 | 13,900 | 4.0 | 30,939 | 3.9 | 30,501 | 3.8 |
| 30-34 | 15,346 | 3.5 | 14,595 | 3.3 | 12,994 | 3.7 | 13,826 | 3.9 | 28,340 | 3.6 | 28,421 | 3.6 |
| 35-39 | 15,094 | 3.4 | 14,443 | 3.3 | 13,790 | 3.9 | 14,990 | 4.3 | 28,884 | 3.6 | 29,433 | 3.7 |
| 40-44 | 14,844 | 3.3 | 13,950 | 3.1 | 13,524 | 3.9 | 15,465 | 4.4 | 28,368 | 3.6 | 29,415 | 3.7 |
| 45-49 | 13,301 | 3.0 | 13,028 | 2.9 | 12,070 | 3.4 | 15,022 | 4.3 | 25,371 | 3.2 | 28,050 | 3.5 |
| 50-54 | 10,544 | 2.4 | 10,491 | 2.4 | 8,789 | 2.5 | 12,297 | 3.5 | 19,333 | 2.4 | 22,788 | 2.9 |
| 55-59 | 7,787 | 1.8 | 7,672 | 1.7 | 6,184 | 1.8 | 9,326 | 2.7 | 13,971 | 1.8 | 16,998 | 2.1 |
| 60-64 | 5,748 | 1.3 | 5,818 | 1.3 | 4,542 | 1.3 | 7,417 | 2.1 | 10,290 | 1.3 | 13,235 | 1.7 |
| 65 + | 10,975 | 2.5 | 12,911 | 2.9 | 8,934 | 2.5 | 15,887 | 4.5 | 19,909 | 2.5 | 28,798 | 3.6 |
| Total | 225,719 | 50.9 | 217,884 | 49.1 | 164,006 | 46.8 | 186,431 | 53.2 | 389,725 | 49.1 | 404,315 | 50.9 |
| Total - both sexes | 443,603 56% |
350,437 44% |
794,040 100% |
|||||||||
* "On Reserve"
includes individuals living on Crown land and on other lands affiliated with First Nations operating under Self-Government Agreements.
Registered Indian Population, by Type of Residence and Selected Age Groups, December 31, 2008

Text Description of Registered Indian Population, by Type of Residence and Selected Age Groups, December 31, 2008 - Canada
| Age Group | Populations | Percentages | ||
|---|---|---|---|---|
| On Reserve | Off Reserve | On Reserve | Off Reserve | |
| 0-24 | 222,890 | 138,106 | 50.2% | 39.4% |
| 25-34 | 64,107 | 54,094 | 14.5% | 15.4% |
| 35-64 | 132,720 | 133,416 | 29.9% | 38.1% |
| 65+ | 23,886 | 24,821 | 5.4% | 7.1% |
Registered Indian Population by Sex and Type of Residence by Group, Responsibility Centre and Region, December 31, 2008
Atlantic
| Group and No. | Total (a + b) |
On Reserve and On Crown Land (includes lands affiliated with First Nations operating under Self-Government Agreements) (a) |
Off Reserve (b) |
|---|---|---|---|
| Gender | |||
| Abegweit (001) | |||
| Total | 324 | 196 | 128 |
| M | 158 | 105 | 53 |
| F | 166 | 91 | 75 |
| Acadia (018) | |||
| Total | 1,076 | 183 | 893 |
| M | 524 | 102 | 422 |
| F | 552 | 81 | 471 |
| Annapolis Valley (020) | |||
| Total | 234 | 106 | 128 |
| M | 109 | 59 | 50 |
| F | 125 | 47 | 78 |
| Bear River (021) | |||
| Total | 278 | 100 | 178 |
| M | 132 | 42 | 90 |
| F | 146 | 58 | 88 |
| Buctouche (004) | |||
| Total | 100 | 73 | 27 |
| M | 51 | 40 | 11 |
| F | 49 | 33 | 16 |
| Burnt Church (005) | |||
| Total | 1,629 | 1,190 | 439 |
| M | 793 | 593 | 200 |
| F | 836 | 597 | 239 |
| Chapel Island First Nation (022) | |||
| Total | 622 | 520 | 102 |
| M | 307 | 266 | 41 |
| F | 315 | 254 | 61 |
| Eel Ground (007) | |||
| Total | 892 | 533 | 359 |
| M | 442 | 266 | 176 |
| F | 450 | 267 | 183 |
| Eel River Bar First Nation (008) | |||
| Total | 616 | 332 | 284 |
| M | 291 | 160 | 131 |
| F | 325 | 172 | 153 |
| Elsipogtog First Nation (003) | |||
| Total | 2,920 | 2,242 | 678 |
| M | 1,458 | 1,165 | 293 |
| F | 1,462 | 1,077 | 385 |
| Eskasoni (023) | |||
| Total | 3,900 | 3,324 | 576 |
| M | 1,928 | 1,668 | 260 |
| F | 1,972 | 1,656 | 316 |
| Fort Folly (009) | |||
| Total | 111 | 30 | 81 |
| M | 46 | 10 | 36 |
| F | 65 | 20 | 45 |
| Glooscap First Nation (030) | |||
| Total | 304 | 91 | 213 |
| M | 140 | 38 | 102 |
| F | 164 | 53 | 111 |
| Indian Island (010) | |||
| Total | 153 | 89 | 64 |
| M | 70 | 41 | 29 |
| F | 83 | 48 | 35 |
| Kingsclear (011) | |||
| Total | 886 | 636 | 250 |
| M | 412 | 294 | 118 |
| F | 474 | 342 | 132 |
| Lennox Island (002) | |||
| Total | 835 | 390 | 445 |
| M | 393 | 199 | 194 |
| F | 442 | 191 | 251 |
| Madawaska Maliseet First Nation (006) | |||
| Total | 237 | 122 | 115 |
| M | 118 | 62 | 56 |
| F | 119 | 60 | 59 |
| Membertou (026) | |||
| Total | 1,191 | 765 | 426 |
| M | 584 | 374 | 210 |
| F | 607 | 391 | 216 |
| Metepenagiag Mi'kmaq Nation (014) | |||
| Total | 551 | 410 | 141 |
| M | 271 | 210 | 61 |
| F | 280 | 200 | 80 |
| Miawpukek (047) | |||
| Total | 2,710 | 809 | 1,901 |
| M | 1,351 | 425 | 926 |
| F | 1,359 | 384 | 975 |
| Millbrook (027) | |||
| Total | 1,399 | 791 | 608 |
| M | 674 | 399 | 275 |
| F | 725 | 392 | 333 |
| Mushuau Innu First Nation (032) | |||
| Total | 694 | 645 | 49 |
| M | 321 | 300 | 21 |
| F | 373 | 345 | 28 |
| Oromocto (012) | |||
| Total | 513 | 261 | 252 |
| M | 240 | 132 | 108 |
| F | 273 | 129 | 144 |
| Pabineau (013) | |||
| Total | 239 | 101 | 138 |
| M | 119 | 56 | 63 |
| F | 120 | 45 | 75 |
| Paq'tnkek First Nation (019) | |||
| Total | 519 | 379 | 140 |
| M | 233 | 172 | 61 |
| F | 286 | 207 | 79 |
| Pictou Landing (024) | |||
| Total | 585 | 444 | 141 |
| M | 289 | 219 | 70 |
| F | 296 | 225 | 71 |
| Saint Mary's (015) | |||
| Total | 1,433 | 754 | 679 |
| M | 674 | 376 | 298 |
| F | 759 | 378 | 381 |
| Sheshatshiu Innu First Nation (033) | |||
| Total | 1,236 | 1,116 | 120 |
| M | 596 | 548 | 48 |
| F | 640 | 568 | 72 |
| Shubenacadie (025) | |||
| Total | 2,297 | 1,221 | 1,076 |
| M | 1,073 | 583 | 490 |
| F | 1,224 | 638 | 586 |
| Tobique (016) | |||
| Total | 1,948 | 1,398 | 550 |
| M | 944 | 684 | 260 |
| F | 1,004 | 714 | 290 |
| Wagmatcook (028) | |||
| Total | 690 | 537 | 153 |
| M | 346 | 283 | 63 |
| F | 344 | 254 | 90 |
| Waycobah First Nation (029) | |||
| Total | 895 | 810 | 85 |
| M | 439 | 400 | 39 |
| F | 456 | 410 | 46 |
| Woodstock (017) | |||
| Total | 846 | 284 | 562 |
| M | 391 | 168 | 223 |
| F | 455 | 116 | 339 |
| General List - Atlantic Region (810) | |||
| Total | 107 | 0 | 107 |
| M | 51 | 0 | 51 |
| F | 56 | 0 | 56 |
| Atlantic Region - 2 | |||
| Total | 32,970 | 20,882 | 12,088 |
| M | 15,968 | 10,439 | 5,529 |
| F | 17,002 | 10,443 | 6,559 |
Quebec
| Group and No. | Total (a + b) |
On Reserve and On Crown Land (includes lands affiliated with First Nations operating under Self-Government Agreements) (a) |
Off Reserve (b) |
|---|---|---|---|
| Gender | |||
| Quebec District | |||
| Abénakis de Wôlinak (071) | |||
| Total | 227 | 70 | 157 |
| M | 95 | 27 | 68 |
| F | 132 | 43 | 89 |
| Algonquins of Barriere Lake (074) | |||
| Total | 663 | 545 | 118 |
| M | 324 | 268 | 56 |
| F | 339 | 277 | 62 |
| Bande des Innus de Pessamit (085) | |||
| Total | 3,609 | 2,830 | 779 |
| M | 1,721 | 1,382 | 339 |
| F | 1,888 | 1,448 | 440 |
| Communauté anicinape de Kitcisakik (062) | |||
| Total | 423 | 365 | 58 |
| M | 211 | 178 | 33 |
| F | 212 | 187 | 25 |
| Conseil de la Première Nation Abitibiwinni (055) | |||
| Total | 896 | 589 | 307 |
| M | 440 | 293 | 147 |
| F | 456 | 296 | 160 |
| Cree Nation of Chisasibi (058) | |||
| Total | 3,892 | 3,759 | 133 |
| M | 1,948 | 1,904 | 44 |
| F | 1,944 | 1,855 | 89 |
| Cree Nation of Mistissini (075) | |||
| Total | 4,089 | 3,567 | 522 |
| M | 2,040 | 1,791 | 249 |
| F | 2,049 | 1,776 | 273 |
| Cree Nation of Nemaska (059) | |||
| Total | 651 | 633 | 18 |
| M | 336 | * | * |
| F | 315 | * | * |
| Cree Nation of Wemindji (060) | |||
| Total | 1,385 | 1,266 | 119 |
| M | 660 | 610 | 50 |
| F | 725 | 656 | 69 |
| Eagle Village First Nation - Kipawa (065) | |||
| Total | 818 | 267 | 551 |
| M | 411 | 133 | 278 |
| F | 407 | 134 | 273 |
| Eastmain (057) | |||
| Total | 676 | 640 | 36 |
| M | 337 | 319 | 18 |
| F | 339 | 321 | 18 |
| Innu Takuaikan Uashat Mak Mani-Utenam (080) | |||
| Total | 3,728 | 3,050 | 678 |
| M | 1,842 | 1,530 | 312 |
| F | 1,886 | 1,520 | 366 |
| Innue Essipit (086) | |||
| Total | 425 | 175 | 250 |
| M | 194 | 85 | 109 |
| F | 231 | 90 | 141 |
| Kitigan Zibi Anishinabeg (073) | |||
| Total | 2,733 | 1,549 | 1,184 |
| M | 1,302 | 770 | 532 |
| F | 1,431 | 779 | 652 |
| La Nation Innu Matimekush-Lac John (087) | |||
| Total | 839 | 749 | 90 |
| M | 428 | 381 | 47 |
| F | 411 | 368 | 43 |
| La Nation Micmac de Gespeg (053) | |||
| Total | 508 | 0 | 508 |
| M | 235 | 0 | 235 |
| F | 273 | 0 | 273 |
| Les Innus de Ekuanitshit (082) | |||
| Total | 538 | 514 | 24 |
| M | 245 | 234 | 11 |
| F | 293 | 280 | 13 |
| Listuguj Mi'gmaq Government (051) | |||
| Total | 3,380 | 1,990 | 1,390 |
| M | 1,623 | 1,022 | 601 |
| F | 1,757 | 968 | 789 |
| Long Point First Nation (067) | |||
| Total | 736 | 393 | 343 |
| M | 347 | 194 | 153 |
| F | 389 | 199 | 190 |
| Micmacs of Gesgapegiag (052) | |||
| Total | 1,287 | 589 | 698 |
| M | 625 | 311 | 314 |
| F | 662 | 278 | 384 |
| Montagnais de Natashquan (083) | |||
| Total | 957 | 900 | 57 |
| M | 493 | 470 | 23 |
| F | 464 | 430 | 34 |
| Montagnais de Pakua Shipi (088) | |||
| Total | 309 | * | * |
| M | 161 | * | * |
| F | 148 | 148 | 0 |
| Montagnais de Unamen Shipu (084) | |||
| Total | 1,073 | 1,024 | 49 |
| M | 539 | 515 | 24 |
| F | 534 | 509 | 25 |
| Naskapi Nation of Kawawachikamach (081) | |||
| Total | 677 | 628 | 49 |
| M | 345 | 320 | 25 |
| F | 332 | 308 | 24 |
| Nation Anishnabe du Lac Simon (063) | |||
| Total | 1,718 | 1,402 | 316 |
| M | 867 | 718 | 149 |
| F | 851 | 684 | 167 |
| Nation Huronne Wendat (050) | |||
| Total | 3,027 | 1,326 | 1,701 |
| M | 1,383 | 638 | 745 |
| F | 1,644 | 688 | 956 |
| Odanak (072) | |||
| Total | 1,866 | 306 | 1,560 |
| M | 837 | 142 | 695 |
| F | 1,029 | 164 | 865 |
| Première nation de Whapmagoostui (095) | |||
| Total | 827 | 817 | 10 |
| M | 424 | * | * |
| F | 403 | * | * |
| Première Nation Malecite de Viger (054) | |||
| Total | 770 | * | * |
| M | 382 | * | * |
| F | 388 | 0 | 388 |
| The Crees of the Waskaganish First Nation (061) | |||
| Total | 2,450 | 2,060 | 390 |
| M | 1,241 | 1,039 | 202 |
| F | 1,209 | 1,021 | 188 |
| Timiskaming First Nation (064) | |||
| Total | 1,653 | 590 | 1,063 |
| M | 770 | 298 | 472 |
| F | 883 | 292 | 591 |
| Waswanipi (056) | |||
| Total | 1,819 | 1,420 | 399 |
| M | 921 | 751 | 170 |
| F | 898 | 669 | 229 |
| Wolf Lake (068) | |||
| Total | 208 | * | * |
| M | 98 | * | * |
| F | 110 | * | * |
| General List - Quebec Region, Quebec District (816) | |||
| Total | 83 | * | * |
| M | 43 | * | * |
| F | 40 | 0 | 40 |
| Responsibility Centre | |||
| Quebec District | |||
| Total | 48,940 | 34,332 | 14,608 |
| M | 23,868 | 17,232 | 6,636 |
| F | 25,072 | 17,100 | 7,972 |
| Montreal District | |||
| Kahnawake (070) | |||
| Total | 9,671 | 7,506 | 2,165 |
| M | 4,622 | 3,643 | 979 |
| F | 5,049 | 3,863 | 1,186 |
| Mohawks of Kanesatake (069) | |||
| Total | 2,034 | 1,344 | 690 |
| M | 933 | 624 | 309 |
| F | 1,101 | 720 | 381 |
| Responsibility Centre | |||
| Montreal District | |||
| Total | 11,705 | 8,850 | 2,855 |
| M | 5,555 | 4,267 | 1,288 |
| F | 6,150 | 4,583 | 1,567 |
| Pointe-Bleue District | |||
| Atikamekw d'Opitciwan (079) | |||
| Total | 2,479 | 2,071 | 408 |
| M | 1,321 | 1,132 | 189 |
| F | 1,158 | 939 | 219 |
| Conseil des Atikamekw de Wemotaci (077) | |||
| Total | 1,613 | 1,309 | 304 |
| M | 817 | 670 | 147 |
| F | 796 | 639 | 157 |
| Les Atikamekw de Manawan (078) | |||
| Total | 2,412 | 2,102 | 310 |
| M | 1,202 | 1,070 | 132 |
| F | 1,210 | 1,032 | 178 |
| Montagnais du Lac St.-Jean (076) | |||
| Total | 4,941 | 2,062 | 2,879 |
| M | 2,323 | 1,018 | 1,305 |
| F | 2,618 | 1,044 | 1,574 |
| Responsibility Centre | |||
| Pointe-Bleue District | |||
| Total | 11,445 | 7,544 | 3,901 |
| M | 5,663 | 3,890 | 1,773 |
| F | 5,782 | 3,654 | 2,128 |
| Quebec Region - 3 | |||
| Total | 72,090 | 50,726 | 21,364 |
| M | 35,086 | 25,389 | 9,697 |
| F | 37,004 | 25,337 | 11,667 |
*Data Suppressed due to low counts
Ontario
| Group and No. | Total (a + b) |
On Reserve and On Crown Land (includes lands affiliated with First Nations operating under Self-Government Agreements) (a) |
Off Reserve (b) |
|---|---|---|---|
| Gender | |||
| Sudbury District | |||
| Aundeck-Omni-Kaning (180) | |||
| Total | 739 | 364 | 375 |
| M | 347 | 186 | 161 |
| F | 392 | 178 | 214 |
| Batchewana First Nation (198) | |||
| Total | 2,344 | 663 | 1,681 |
| M | 1,110 | 334 | 776 |
| F | 1,234 | 329 | 905 |
| Dokis (218) | |||
| Total | 979 | 172 | 807 |
| M | 490 | 89 | 401 |
| F | 489 | 83 | 406 |
| Garden River First Nation (199) | |||
| Total | 2,267 | 1,149 | 1,118 |
| M | 1,071 | 570 | 501 |
| F | 1,196 | 579 | 617 |
| Henvey Inlet First Nation (231) | |||
| Total | 626 | 168 | 458 |
| M | 309 | 81 | 228 |
| F | 317 | 87 | 230 |
| Magnetawan (174) | |||
| Total | 228 | 80 | 148 |
| M | 114 | 45 | 69 |
| F | 114 | 35 | 79 |
| M'Chigeeng First Nation (181) | |||
| Total | 2,309 | 942 | 1,367 |
| M | 1,136 | 479 | 657 |
| F | 1,173 | 463 | 710 |
| Mississauga (200) | |||
| Total | 1,054 | 369 | 685 |
| M | 504 | 179 | 325 |
| F | 550 | 190 | 360 |
| Nipissing First Nation (220) | |||
| Total | 2,195 | 909 | 1,286 |
| M | 1,052 | 457 | 595 |
| F | 1,143 | 452 | 691 |
| Sagamok Anishnawbek (179) | |||
| Total | 2,470 | 1,448 | 1,022 |
| M | 1,235 | 767 | 468 |
| F | 1,235 | 681 | 554 |
| Serpent River (201) | |||
| Total | 1,187 | 337 | 850 |
| M | 549 | 163 | 386 |
| F | 638 | 174 | 464 |
| Shawanaga First Nation (137) | |||
| Total | 543 | 177 | 366 |
| M | 263 | 88 | 175 |
| F | 280 | 89 | 191 |
| Sheguiandah (176) | |||
| Total | 324 | 166 | 158 |
| M | 154 | 87 | 67 |
| F | 170 | 79 | 91 |
| Sheshegwaning (178) | |||
| Total | 382 | 103 | 279 |
| M | 175 | 52 | 123 |
| F | 207 | 51 | 156 |
| Temagami First Nation (222) | |||
| Total | 677 | 241 | 436 |
| M | 322 | 126 | 196 |
| F | 355 | 115 | 240 |
| Thessalon (202) | |||
| Total | 590 | 92 | 498 |
| M | 279 | 46 | 233 |
| F | 311 | 46 | 265 |
| Wahnapitae (232) | |||
| Total | 405 | 46 | 359 |
| M | 192 | 28 | 164 |
| F | 213 | 18 | 195 |
| Whitefish Lake (224) | |||
| Total | 903 | 366 | 537 |
| M | 429 | 178 | 251 |
| F | 474 | 188 | 286 |
| Whitefish River (230) | |||
| Total | 1,115 | 384 | 731 |
| M | 546 | 194 | 352 |
| F | 569 | 190 | 379 |
| Wikwemikong (175) | |||
| Total | 7,192 | 3,037 | 4,155 |
| M | 3,458 | 1,546 | 1,912 |
| F | 3,734 | 1,491 | 2,243 |
| Zhiibaahaasing First Nation (173) | |||
| Total | 157 | 66 | 91 |
| M | 75 | 31 | 44 |
| F | 82 | 35 | 47 |
| General List - Ontario Region, Sudbury District (817) | |||
| Total | 183 | 0 | 183 |
| M | 79 | 0 | 79 |
| F | 104 | 0 | 104 |
| Responsibility Centre | |||
| Sudbury District | |||
| Total | 28,869 | 11,279 | 17,590 |
| M | 13,889 | 5,726 | 8,163 |
| F | 14,980 | 5,553 | 9,427 |
| Southern District | |||
| Aamjiwnaang (172) | |||
| Total | 2,031 | 925 | 1,106 |
| M | 945 | 453 | 492 |
| F | 1,086 | 472 | 614 |
| Alderville First Nation (160) | |||
| Total | 1,008 | 314 | 694 |
| M | 479 | 148 | 331 |
| F | 529 | 166 | 363 |
| Algonquins of Pikwakanagan (163) | |||
| Total | 1,996 | 405 | 1,591 |
| M | 937 | 199 | 738 |
| F | 1,059 | 206 | 853 |
| Bay of Quinte Mohawk (244) - Six Nations of the Grand River | |||
| Total | 672 | 304 | 368 |
| M | 319 | 147 | 172 |
| F | 353 | 157 | 196 |
| Bearfoot Onondaga (248) - Six Nations of the Grand River | |||
| Total | 548 | 233 | 315 |
| M | 266 | 122 | 144 |
| F | 282 | 111 | 171 |
| Beausoleil (141) | |||
| Total | 1,812 | 592 | 1,220 |
| M | 829 | 288 | 541 |
| F | 983 | 304 | 679 |
| Caldwell (165) | |||
| Total | 268 | * | * |
| M | 122 | 0 | 122 |
| F | 146 | * | * |
| Chippewas of Georgina Island (138) | |||
| Total | 703 | 189 | 514 |
| M | 342 | 91 | 251 |
| F | 361 | 98 | 263 |
| Chippewas of Kettle and Stony Point (171) | |||
| Total | 2,123 | 1,281 | 842 |
| M | 1,036 | 662 | 374 |
| F | 1,087 | 619 | 468 |
| Chippewas of Mnjikaning First Nation (139) | |||
| Total | 1,586 | 667 | 919 |
| M | 770 | 334 | 436 |
| F | 816 | 333 | 483 |
| Chippewas of Nawash First Nation (122) | |||
| Total | 2,233 | 724 | 1,509 |
| M | 1,069 | 354 | 715 |
| F | 1,164 | 370 | 794 |
| Chippewas of the Thames First Nation (166) | |||
| Total | 2,376 | 876 | 1,500 |
| M | 1,112 | 432 | 680 |
| F | 1,264 | 444 | 820 |
| Curve Lake (161) | |||
| Total | 1,803 | 751 | 1,052 |
| M | 845 | 370 | 475 |
| F | 958 | 381 | 577 |
| Delaware (253) - Six Nations of the Grand River | |||
| Total | 608 | 237 | 371 |
| M | 276 | 117 | 159 |
| F | 332 | 120 | 212 |
| Hiawatha First Nation (162) | |||
| Total | 438 | 202 | 236 |
| M | 186 | 91 | 95 |
| F | 252 | 111 | 141 |
| Konadaha Seneca (251) - Six Nations of the Grand River | |||
| Total | 505 | 202 | 303 |
| M | 231 | 101 | 130 |
| F | 274 | 101 | 173 |
| Lower Cayuga (250) - Six Nations of the Grand River | |||
| Total | 3,271 | 2,092 | 1,179 |
| M | 1,562 | 1,034 | 528 |
| F | 1,709 | 1,058 | 651 |
| Lower Mohawk (254) - Six Nations of the Grand River | |||
| Total | 3,689 | 1,959 | 1,730 |
| M | 1,723 | 965 | 758 |
| F | 1,966 | 994 | 972 |
| Mississauga's of Scugog Island First Nation (140) | |||
| Total | 195 | 50 | 145 |
| M | 101 | 27 | 74 |
| F | 94 | 23 | 71 |
| Mississaugas of the Credit (120) | |||
| Total | 1,824 | 889 | 935 |
| M | 870 | 431 | 439 |
| F | 954 | 458 | 496 |
| Mohawks of Akwesasne (159) | |||
| Total | 10,811 | 8,758 | 2,053 |
| M | 5,196 | 4,244 | 952 |
| F | 5,615 | 4,514 | 1,101 |
| Mohawks of the Bay of Quinte (164) | |||
| Total | 7,819 | 2,118 | 5,701 |
| M | 3,685 | 1,054 | 2,631 |
| F | 4,134 | 1,064 | 3,070 |
| Moose Deer Point (135) | |||
| Total | 453 | 154 | 299 |
| M | 212 | 70 | 142 |
| F | 241 | 84 | 157 |
| Moravian of the Thames (167) | |||
| Total | 1,141 | 583 | 558 |
| M | 525 | 288 | 237 |
| F | 616 | 295 | 321 |
| Munsee-Delaware Nation (168) | |||
| Total | 544 | 168 | 376 |
| M | 254 | 83 | 171 |
| F | 290 | 85 | 205 |
| Niharondasa Seneca (252) - Six Nations of the Grand River | |||
| Total | 355 | 157 | 198 |
| M | 179 | 83 | 96 |
| F | 176 | 74 | 102 |
| Oneida (246) - Six Nations of the Grand River | |||
| Total | 1,842 | 728 | 1,114 |
| M | 883 | 376 | 507 |
| F | 959 | 352 | 607 |
| Oneida Nation of the Thames (169) | |||
| Total | 5,353 | 2,070 | 3,283 |
| M | 2,571 | 1,033 | 1,538 |
| F | 2,782 | 1,037 | 1,745 |
| Onondaga Clear Sky (247) - Six Nations of the Grand River | |||
| Total | 697 | 391 | 306 |
| M | 346 | 193 | 153 |
| F | 351 | 198 | 153 |
| Saugeen (123) | |||
| Total | 1,611 | 786 | 825 |
| M | 811 | 413 | 398 |
| F | 800 | 373 | 427 |
| Tuscarora (245) - Six Nations of the Grand River | |||
| Total | 1,957 | 945 | 1,012 |
| M | 932 | 483 | 449 |
| F | 1,025 | 462 | 563 |
| Upper Cayuga (249) - Six Nations of the Grand River | |||
| Total | 3,186 | 1,351 | 1,835 |
| M | 1,566 | 705 | 861 |
| F | 1,620 | 646 | 974 |
| Upper Mohawk (257) - Six Nations of the Grand River | |||
| Total | 5,506 | 2,754 | 2,752 |
| M | 2,576 | 1,386 | 1,190 |
| F | 2,930 | 1,368 | 1,562 |
| Wahta Mohawk (134) | |||
| Total | 679 | 169 | 510 |
| M | 317 | 96 | 221 |
| F | 362 | 73 | 289 |
| Walker Mohawk (255) - Six Nations of the Grand River | |||
| Total | 453 | 281 | 172 |
| M | 227 | 143 | 84 |
| F | 226 | 138 | 88 |
| Walpole Island (170) | |||
| Total | 4,193 | 2,192 | 2,001 |
| M | 2,058 | 1,138 | 920 |
| F | 2,135 | 1,054 | 1,081 |
| Wasauksing First Nation (136) | |||
| Total | 1,072 | 385 | 687 |
| M | 518 | 201 | 317 |
| F | 554 | 184 | 370 |
| General List - Ontario Region, Southern District (821) | |||
| Total | * | * | * |
| M | * | * | * |
| F | * | * | * |
| Responsibility Centre | |||
| Southern District | |||
| Total | 77,366 | 36,888 | 40,478 |
| M | 36,877 | 18,356 | 18,521 |
| F | 40,489 | 18,532 | 21,957 |
| Western District | |||
| Albany (142) | |||
| Total | 4,003 | 2,503 | 1,500 |
| M | 2,011 | 1,284 | 727 |
| F | 1,992 | 1,219 | 773 |
| Animbiigoo Zaagi'igan Anishinaabek (194) | |||
| Total | 358 | 93 | 265 |
| M | 171 | 50 | 121 |
| F | 187 | 43 | 144 |
| Anishinabe of Wauzhushk Onigum (153) | |||
| Total | 627 | 318 | 309 |
| M | 315 | 177 | 138 |
| F | 312 | 141 | 171 |
| Anishnaabeg of Naongashiing (125) | |||
| Total | 362 | 173 | 189 |
| M | 183 | 93 | 90 |
| F | 179 | 80 | 99 |
| Aroland (242) | |||
| Total | 602 | 357 | 245 |
| M | 308 | 191 | 117 |
| F | 294 | 166 | 128 |
| Attawapiskat (143) | |||
| Total | 3,009 | 1,632 | 1,377 |
| M | 1,489 | 874 | 615 |
| F | 1,520 | 758 | 762 |
| Big Grassy (124) | |||
| Total | 666 | 245 | 421 |
| M | 330 | 133 | 197 |
| F | 336 | 112 | 224 |
| Biinjitiwaabik Zaaging Anishinaabek (197) | |||
| Total | 680 | 333 | 347 |
| M | 336 | 173 | 163 |
| F | 344 | 160 | 184 |
| Bingwi Neyaashi Anishinaabek (196) | |||
| Total | 188 | 26 | 162 |
| M | 99 | * | * |
| F | 89 | * | * |
| Brunswick House (228) | |||
| Total | 642 | 177 | 465 |
| M | 323 | 94 | 229 |
| F | 319 | 83 | 236 |
| Chapleau Cree First Nation (221) | |||
| Total | 405 | 59 | 346 |
| M | 217 | 29 | 188 |
| F | 188 | 30 | 158 |
| Chapleau Ojibway (229) | |||
| Total | 40 | * | * |
| M | 19 | * | * |
| F | 21 | * | * |
| Constance Lake (182) | |||
| Total | 1,492 | 763 | 729 |
| M | 752 | 406 | 346 |
| F | 740 | 357 | 383 |
| Couchiching First Nation (126) | |||
| Total | 2,000 | 647 | 1,353 |
| M | 973 | 329 | 644 |
| F | 1,027 | 318 | 709 |
| Eabametoong First Nation (183) | |||
| Total | 2,244 | 1,301 | 943 |
| M | 1,157 | 701 | 456 |
| F | 1,087 | 600 | 487 |
| Eagle Lake (148) | |||
| Total | 538 | 341 | 197 |
| M | 273 | 184 | 89 |
| F | 265 | 157 | 108 |
| Flying Post (227) | |||
| Total | 162 | 0 | 162 |
| M | 75 | 0 | 75 |
| F | 87 | 0 | 87 |
| Fort William (187) | |||
| Total | 1,828 | 883 | 945 |
| M | 885 | 444 | 441 |
| F | 943 | 439 | 504 |
| Ginoogaming First Nation (185) | |||
| Total | 796 | 186 | 610 |
| M | 396 | 97 | 299 |
| F | 400 | 89 | 311 |
| Grassy Narrows First Nation (149) | |||
| Total | 1,334 | 872 | 462 |
| M | 655 | 437 | 218 |
| F | 679 | 435 | 244 |
| Gull Bay (188) | |||
| Total | 1,087 | 328 | 759 |
| M | 551 | 183 | 368 |
| F | 536 | 145 | 391 |
| Iskatewizaagegan #39 Independent First Nation (154) | |||
| Total | 571 | 320 | 251 |
| M | 287 | 170 | 117 |
| F | 284 | 150 | 134 |
| Lac Des Mille Lacs (189) | |||
| Total | 526 | * | * |
| M | 256 | * | * |
| F | 270 | 0 | 270 |
| Lac La Croix (127) | |||
| Total | 398 | 285 | 113 |
| M | 203 | 155 | 48 |
| F | 195 | 130 | 65 |
| Long Lake No.58 First Nation (184) | |||
| Total | 1,259 | 433 | 826 |
| M | 605 | 213 | 392 |
| F | 654 | 220 | 434 |
| Martin Falls (186) | |||
| Total | 606 | 319 | 287 |
| M | 300 | 175 | 125 |
| F | 306 | 144 | 162 |
| Matachewan (219) | |||
| Total | 531 | 40 | 491 |
| M | 264 | 27 | 237 |
| F | 267 | 13 | 254 |
| Mattagami (226) | |||
| Total | 466 | 163 | 303 |
| M | 228 | 93 | 135 |
| F | 238 | 70 | 168 |
| Michipicoten (225) | |||
| Total | 760 | 54 | 706 |
| M | 361 | 30 | 331 |
| F | 399 | 24 | 375 |
| Missanabie Cree (223) | |||
| Total | 374 | * | * |
| M | 189 | * | * |
| F | 185 | * | * |
| Moose Cree First Nation (144) | |||
| Total | 3,808 | 1,611 | 2,197 |
| M | 1,896 | 848 | 1,048 |
| F | 1,912 | 763 | 1,149 |
| Naicatchewenin (128) | |||
| Total | 374 | 257 | 117 |
| M | 183 | 127 | 56 |
| F | 191 | 130 | 61 |
| Naotkamegwanning (158) | |||
| Total | 1,122 | 682 | 440 |
| M | 569 | 351 | 218 |
| F | 553 | 331 | 222 |
| Neskantaga First Nation (239) | |||
| Total | 403 | 317 | 86 |
| M | 208 | 165 | 43 |
| F | 195 | 152 | 43 |
| Nibinamik First Nation (241) | |||
| Total | 432 | 324 | 108 |
| M | 217 | 166 | 51 |
| F | 215 | 158 | 57 |
| Nicickousemenecaning (129) | |||
| Total | 297 | 142 | 155 |
| M | 142 | 70 | 72 |
| F | 155 | 72 | 83 |
| Northwest Angle No.33 (151) | |||
| Total | 456 | 221 | 235 |
| M | 207 | 118 | 89 |
| F | 249 | 103 | 146 |
| Northwest Angle No.37 (152) | |||
| Total | 335 | 168 | 167 |
| M | 176 | 81 | 95 |
| F | 159 | 87 | 72 |
| Obashkaandagaang (235) | |||
| Total | 281 | 169 | 112 |
| M | 140 | 88 | 52 |
| F | 141 | 81 | 60 |
| Ochiichagwe'babigo'ining First Nation (147) | |||
| Total | 339 | 145 | 194 |
| M | 174 | 83 | 91 |
| F | 165 | 62 | 103 |
| Ojibways of Onigaming First Nation (131) | |||
| Total | 705 | 442 | 263 |
| M | 332 | 231 | 101 |
| F | 373 | 211 | 162 |
| Ojibways of the Pic River First Nation (192) | |||
| Total | 981 | 490 | 491 |
| M | 462 | 234 | 228 |
| F | 519 | 256 | 263 |
| Pays Plat (191) | |||
| Total | 205 | 75 | 130 |
| M | 103 | 45 | 58 |
| F | 102 | 30 | 72 |
| Pic Mobert (195) | |||
| Total | 818 | 324 | 494 |
| M | 418 | 181 | 237 |
| F | 400 | 143 | 257 |
| Rainy River First Nations (130) | |||
| Total | 866 | 390 | 476 |
| M | 402 | 181 | 221 |
| F | 464 | 209 | 255 |
| Red Rock (193) | |||
| Total | 1,492 | 243 | 1,249 |
| M | 698 | 118 | 580 |
| F | 794 | 125 | 669 |
| Seine River First Nation (132) | |||
| Total | 698 | 319 | 379 |
| M | 336 | 151 | 185 |
| F | 362 | 168 | 194 |
| Shoal Lake No.40 (155) | |||
| Total | 549 | 272 | 277 |
| M | 265 | 146 | 119 |
| F | 284 | 126 | 158 |
| Stanjikoming First Nation (133) | |||
| Total | 138 | 98 | 40 |
| M | 72 | 53 | 19 |
| F | 66 | 45 | 21 |
| Taykwa Tagamou Nation (145) | |||
| Total | 362 | 118 | 244 |
| M | 188 | 65 | 123 |
| F | 174 | 53 | 121 |
| Wabaseemoong Independent Nations (150) | |||
| Total | 1,721 | 842 | 879 |
| M | 852 | 427 | 425 |
| F | 869 | 415 | 454 |
| Wabauskang First Nation (156) | |||
| Total | 260 | 119 | 141 |
| M | 121 | 58 | 63 |
| F | 139 | 61 | 78 |
| Wabigoon Lake Ojibway Nation (157) | |||
| Total | 546 | 179 | 367 |
| M | 277 | 95 | 182 |
| F | 269 | 84 | 185 |
| Wahgoshig (233) | |||
| Total | 277 | 136 | 141 |
| M | 143 | 74 | 69 |
| F | 134 | 62 | 72 |
| Webequie (240) | |||
| Total | 753 | 662 | 91 |
| M | 368 | 320 | 48 |
| F | 385 | 342 | 43 |
| Weenusk (146) | |||
| Total | 522 | 254 | 268 |
| M | 278 | 135 | 143 |
| F | 244 | 119 | 125 |
| Whitesand (190) | |||
| Total | 1,094 | 317 | 777 |
| M | 551 | 180 | 371 |
| F | 543 | 137 | 406 |
| General List - Ontario Region, Western District (826) | |||
| Total | * | * | * |
| M | * | * | * |
| F | * | * | * |
| Responsibility Centre | |||
| Western District | |||
| Total | 48,391 | 22,208 | 26,183 |
| M | 23,989 | 11,572 | 12,417 |
| F | 24,402 | 10,636 | 13,766 |
| Sioux Lookout District | |||
| Bearskin Lake (207) | |||
| Total | 853 | 430 | 423 |
| M | 425 | 229 | 196 |
| F | 428 | 201 | 227 |
| Cat Lake (216) | |||
| Total | 631 | 528 | 103 |
| M | 329 | 277 | 52 |
| F | 302 | 251 | 51 |
| Deer Lake (237) | |||
| Total | 1,103 | 928 | 175 |
| M | 550 | 472 | 78 |
| F | 553 | 456 | 97 |
| Fort Severn (215) | |||
| Total | 637 | 507 | 130 |
| M | 319 | 258 | 61 |
| F | 318 | 249 | 69 |
| Kasabonika Lake (210) | |||
| Total | 956 | 923 | 33 |
| M | 485 | 469 | 16 |
| F | 471 | 454 | 17 |
| Kee-Way-Win (325) | |||
| Total | 683 | 490 | 193 |
| M | 323 | 244 | 79 |
| F | 360 | 246 | 114 |
| Kingfisher (212) | |||
| Total | 490 | 457 | 33 |
| M | 251 | 234 | 17 |
| F | 239 | 223 | 16 |
| Kitchenuhmaykoosib Inninuwug (209) | |||
| Total | 1,357 | 934 | 423 |
| M | 672 | 462 | 210 |
| F | 685 | 472 | 213 |
| Lac Seul (205) | |||
| Total | 2,884 | 788 | 2,096 |
| M | 1,401 | 422 | 979 |
| F | 1,483 | 366 | 1,117 |
| McDowell Lake (326) | |||
| Total | 53 | 22 | 31 |
| M | 28 | * | * |
| F | 25 | * | * |
| Mishkeegogamang (203) | |||
| Total | 1,594 | 1,025 | 569 |
| M | 772 | 512 | 260 |
| F | 822 | 513 | 309 |
| Muskrat Dam Lake (213) | |||
| Total | 385 | 208 | 177 |
| M | 193 | 108 | 85 |
| F | 192 | 100 | 92 |
| North Caribou Lake (204) | |||
| Total | 946 | 735 | 211 |
| M | 444 | 345 | 99 |
| F | 502 | 390 | 112 |
| North Spirit Lake (238) | |||
| Total | 456 | 422 | 34 |
| M | 222 | 212 | 10 |
| F | 234 | 210 | 24 |
| Ojibway Nation of Saugeen (258) | |||
| Total | 208 | 95 | 113 |
| M | 106 | 50 | 56 |
| F | 102 | 45 | 57 |
| Pikangikum (208) | |||
| Total | 2,216 | 2,133 | 83 |
| M | 1,132 | 1,097 | 35 |
| F | 1,084 | 1,036 | 48 |
| Poplar Hill (236) | |||
| Total | 466 | 450 | 16 |
| M | 251 | * | * |
| F | 215 | * | * |
| Sachigo Lake (214) | |||
| Total | 786 | 474 | 312 |
| M | 394 | 241 | 153 |
| F | 392 | 233 | 159 |
| Sandy Lake (211) | |||
| Total | 2,583 | 2,299 | 284 |
| M | 1,288 | 1,165 | 123 |
| F | 1,295 | 1,134 | 161 |
| Slate Falls Nation (259) | |||
| Total | 227 | 167 | 60 |
| M | 124 | 91 | 33 |
| F | 103 | 76 | 27 |
| Wapekeka (206) | |||
| Total | 384 | 371 | 13 |
| M | 196 | * | * |
| F | 188 | * | * |
| Wawakapewin (234) | |||
| Total | 55 | 42 | 13 |
| M | 27 | * | * |
| F | 28 | * | * |
| Wunnumin (217) | |||
| Total | 599 | 508 | 91 |
| M | 290 | 251 | 39 |
| F | 309 | 257 | 52 |
| Responsibility Centre | |||
| Sioux Lookout District | |||
| Total | 20,552 | 14,936 | 5,616 |
| M | 10,222 | 7,600 | 2,622 |
| F | 10,330 | 7,336 | 2,994 |
| Ontario Region - 4 | |||
| Total | 175,178 | 85,311 | 89,867 |
| M | 84,977 | 43,254 | 41,723 |
| F | 90,201 | 42,057 | 48,144 |
*Data Suppressed due to low counts
Manitoba
| Group and No. | Total (a + b) |
On Reserve and On Crown Land (includes lands affiliated with First Nations operating under Self-Government Agreements) (a) |
Off Reserve (b) |
|---|---|---|---|
| Gender | |||
| Barren Lands (308) | |||
| Total | 957 | 479 | 478 |
| M | 481 | 243 | 238 |
| F | 476 | 236 | 240 |
| Berens River (266) | |||
| Total | 2,764 | 1,759 | 1,005 |
| M | 1,412 | 937 | 475 |
| F | 1,352 | 822 | 530 |
| Birdtail Sioux (284) | |||
| Total | 755 | 446 | 309 |
| M | 356 | 221 | 135 |
| F | 399 | 225 | 174 |
| Bloodvein (267) | |||
| Total | 1,485 | 942 | 543 |
| M | 722 | 468 | 254 |
| F | 763 | 474 | 289 |
| Brokenhead Ojibway Nation (261) | |||
| Total | 1,649 | 584 | 1,065 |
| M | 799 | 295 | 504 |
| F | 850 | 289 | 561 |
| Buffalo Point First Nation (265) | |||
| Total | 110 | 42 | 68 |
| M | 48 | 17 | 31 |
| F | 62 | 25 | 37 |
| Bunibonibee Cree Nation (301) | |||
| Total | 2,592 | 2,205 | 387 |
| M | 1,281 | 1,126 | 155 |
| F | 1,311 | 1,079 | 232 |
| Canupawakpa Dakota First Nation (289) | |||
| Total | 608 | 310 | 298 |
| M | 300 | 157 | 143 |
| F | 308 | 153 | 155 |
| Chemawawin Cree Nation (309) | |||
| Total | 1,596 | 1,309 | 287 |
| M | 801 | 673 | 128 |
| F | 795 | 636 | 159 |
| Cross Lake First Nation (276) | |||
| Total | 7,006 | 5,122 | 1,884 |
| M | 3,508 | 2,591 | 917 |
| F | 3,498 | 2,531 | 967 |
| Dakota Plains (288) | |||
| Total | 246 | 167 | 79 |
| M | 117 | 83 | 34 |
| F | 129 | 84 | 45 |
| Dakota Tipi (295) | |||
| Total | 332 | 169 | 163 |
| M | 191 | 101 | 90 |
| F | 141 | 68 | 73 |
| Dauphin River (316) | |||
| Total | 286 | 202 | 84 |
| M | 132 | 96 | 36 |
| F | 154 | 106 | 48 |
| Ebb and Flow (280) | |||
| Total | 2,482 | 1,283 | 1,199 |
| M | 1,191 | 616 | 575 |
| F | 1,291 | 667 | 624 |
| Fisher River (264) | |||
| Total | 3,197 | 1,740 | 1,457 |
| M | 1,617 | 888 | 729 |
| F | 1,580 | 852 | 728 |
| Fort Alexander (262) | |||
| Total | 6,866 | 3,196 | 3,670 |
| M | 3,391 | 1,666 | 1,725 |
| F | 3,475 | 1,530 | 1,945 |
| Fox Lake (305) | |||
| Total | 1,055 | 241 | 814 |
| M | 480 | 120 | 360 |
| F | 575 | 121 | 454 |
| Gamblers (294) | |||
| Total | 157 | 61 | 96 |
| M | 70 | 33 | 37 |
| F | 87 | 28 | 59 |
| Garden Hill First Nations (297) | |||
| Total | 3,988 | 3,446 | 542 |
| M | 2,037 | 1,778 | 259 |
| F | 1,951 | 1,668 | 283 |
| God's Lake First Nation (296) | |||
| Total | 2,380 | 1,451 | 929 |
| M | 1,204 | 758 | 446 |
| F | 1,176 | 693 | 483 |
| Grand Rapids First Nation (310) | |||
| Total | 1,544 | 956 | 588 |
| M | 762 | 498 | 264 |
| F | 782 | 458 | 324 |
| Hollow Water (263) | |||
| Total | 1,612 | 1,016 | 596 |
| M | 796 | 513 | 283 |
| F | 816 | 503 | 313 |
| Keeseekoowenin (286) | |||
| Total | 1,053 | 414 | 639 |
| M | 496 | 211 | 285 |
| F | 557 | 203 | 354 |
| Kinonjeoshtegon First Nation (268) | |||
| Total | 680 | 348 | 332 |
| M | 340 | 173 | 167 |
| F | 340 | 175 | 165 |
| Lake Manitoba (271) | |||
| Total | 1,784 | 934 | 850 |
| M | 912 | 488 | 424 |
| F | 872 | 446 | 426 |
| Lake St. Martin (275) | |||
| Total | 2,194 | 1,447 | 747 |
| M | 1,070 | 736 | 334 |
| F | 1,124 | 711 | 413 |
| Little Black River (260) | |||
| Total | 1,019 | 743 | 276 |
| M | 516 | 366 | 150 |
| F | 503 | 377 | 126 |
| Little Grand Rapids (270) | |||
| Total | 1,414 | 1,127 | 287 |
| M | 748 | 607 | 141 |
| F | 666 | 520 | 146 |
| Little Saskatchewan (274) | |||
| Total | 1,075 | 649 | 426 |
| M | 517 | 327 | 190 |
| F | 558 | 322 | 236 |
| Long Plain (287) | |||
| Total | 3,681 | 2,010 | 1,671 |
| M | 1,800 | 1,022 | 778 |
| F | 1,881 | 988 | 893 |
| Manto Sipi Cree Nation (302) | |||
| Total | 744 | 630 | 114 |
| M | 367 | 310 | 57 |
| F | 377 | 320 | 57 |
| Marcel Colomb First Nation (328) | |||
| Total | 359 | 316 | 43 |
| M | 183 | 163 | 20 |
| F | 176 | 153 | 23 |
| Mathias Colomb (311) | |||
| Total | 3,294 | 2,367 | 927 |
| M | 1,651 | 1,230 | 421 |
| F | 1,643 | 1,137 | 506 |
| Mosakahiken Cree Nation (312) | |||
| Total | 1,787 | 1,331 | 456 |
| M | 886 | 682 | 204 |
| F | 901 | 649 | 252 |
| Nisichawayasihk Cree Nation (313) | |||
| Total | 4,413 | 2,834 | 1,579 |
| M | 2,154 | 1,476 | 678 |
| F | 2,259 | 1,358 | 901 |
| Northlands (317) | |||
| Total | 960 | 819 | 141 |
| M | 465 | 397 | 68 |
| F | 495 | 422 | 73 |
| Norway House Cree Nation (278) | |||
| Total | 6,700 | 5,115 | 1,585 |
| M | 3,309 | 2,567 | 742 |
| F | 3,391 | 2,548 | 843 |
| O-Chi-Chak-Ko-Sipi First Nation (279) | |||
| Total | 924 | 546 | 378 |
| M | 451 | 274 | 177 |
| F | 473 | 272 | 201 |
| Opaskwayak Cree Nation (315) | |||
| Total | 5,125 | 3,132 | 1,993 |
| M | 2,531 | 1,568 | 963 |
| F | 2,594 | 1,564 | 1,030 |
| O-Pipon-Na-Pawin Cree Nation (318) | |||
| Total | 1,235 | 929 | 306 |
| M | 642 | 503 | 139 |
| F | 593 | 426 | 167 |
| Pauingassi First Nation (327) | |||
| Total | 575 | 537 | 38 |
| M | 311 | 297 | 14 |
| F | 264 | 240 | 24 |
| Peguis (269) | |||
| Total | 8,468 | 3,608 | 4,860 |
| M | 4,142 | 1,834 | 2,308 |
| F | 4,326 | 1,774 | 2,552 |
| Pinaymootang First Nation (272) | |||
| Total | 2,758 | 1,203 | 1,555 |
| M | 1,301 | 585 | 716 |
| F | 1,457 | 618 | 839 |
| Pine Creek (282) | |||
| Total | 2,766 | 1,149 | 1,617 |
| M | 1,400 | 614 | 786 |
| F | 1,366 | 535 | 831 |
| Poplar River First Nation (277) | |||
| Total | 1,459 | 1,190 | 269 |
| M | 731 | 625 | 106 |
| F | 728 | 565 | 163 |
| Red Sucker Lake (300) | |||
| Total | 950 | 813 | 137 |
| M | 457 | 396 | 61 |
| F | 493 | 417 | 76 |
| Rolling River (291) | |||
| Total | 938 | 504 | 434 |
| M | 480 | 257 | 223 |
| F | 458 | 247 | 211 |
| Roseau River Anishinabe First Nation Government (273) | |||
| Total | 2,202 | 1,141 | 1,061 |
| M | 1,093 | 594 | 499 |
| F | 1,109 | 547 | 562 |
| Sandy Bay (283) | |||
| Total | 5,551 | 3,493 | 2,058 |
| M | 2,832 | 1,856 | 976 |
| F | 2,719 | 1,637 | 1,082 |
| Sapotaweyak Cree Nation (314) | |||
| Total | 2,016 | 939 | 1,077 |
| M | 1,055 | 517 | 538 |
| F | 961 | 422 | 539 |
| Sayisi Dene First Nation (303) | |||
| Total | 709 | 325 | 384 |
| M | 357 | 182 | 175 |
| F | 352 | 143 | 209 |
| Shamattawa First Nation (307) | |||
| Total | 1,359 | 1,206 | 153 |
| M | 682 | 605 | 77 |
| F | 677 | 601 | 76 |
| Sioux Valley Dakota Nation (290) | |||
| Total | 2,289 | 1,431 | 858 |
| M | 1,127 | 739 | 388 |
| F | 1,162 | 692 | 470 |
| Skownan First Nation (281) | |||
| Total | 1,251 | 687 | 564 |
| M | 631 | 346 | 285 |
| F | 620 | 341 | 279 |
| St. Theresa Point (298) | |||
| Total | 3,447 | 3,231 | 216 |
| M | 1,749 | 1,656 | 93 |
| F | 1,698 | 1,575 | 123 |
| Swan Lake (293) | |||
| Total | 1,209 | 711 | 498 |
| M | 567 | 324 | 243 |
| F | 642 | 387 | 255 |
| Tataskweyak Cree Nation (306) | |||
| Total | 3,166 | 2,149 | 1,017 |
| M | 1,560 | 1,069 | 491 |
| F | 1,606 | 1,080 | 526 |
| Tootinaowaziibeeng Treaty Reserve (292) | |||
| Total | 1,242 | 591 | 651 |
| M | 608 | 291 | 317 |
| F | 634 | 300 | 334 |
| War Lake First Nation (323) | |||
| Total | 250 | 112 | 138 |
| M | 122 | 60 | 62 |
| F | 128 | 52 | 76 |
| Wasagamack First Nation (299) | |||
| Total | 1,724 | 1,578 | 146 |
| M | 884 | 822 | 62 |
| F | 840 | 756 | 84 |
| Waywayseecappo First Nation Treaty Four - 1874 (285) | |||
| Total | 2,394 | 1,418 | 976 |
| M | 1,190 | 707 | 483 |
| F | 1,204 | 711 | 493 |
| Wuskwi Sipihk First Nation (324) | |||
| Total | 613 | 196 | 417 |
| M | 305 | 109 | 196 |
| F | 308 | 87 | 221 |
| York Factory First Nation (304) | |||
| Total | 1,114 | 442 | 672 |
| M | 554 | 234 | 320 |
| F | 560 | 208 | 352 |
| General List - Manitoba Region (804) | |||
| Total | * | * | * |
| M | * | * | * |
| F | * | * | * |
| Manitoba Region - 5 | |||
| Total | 130,565 | 81,471 | 49,094 |
| M | 64,878 | 41,697 | 23,181 |
| F | 65,687 | 39,774 | 25,913 |
*Data Suppressed due to low counts
Saskatchewan
| Group and No. | Total (a + b) |
On Reserve and On Crown Land (includes lands affiliated with First Nations operating under Self-Government Agreements) (a) |
Off Reserve (b) |
|---|---|---|---|
| Gender | |||
| North Central District | |||
| Ahtahkakoop (406) | |||
| Total | 2,983 | 1,625 | 1,358 |
| M | 1,489 | 819 | 670 |
| F | 1,494 | 806 | 688 |
| Beardy's and Okemasis (369) | |||
| Total | 2,938 | 1,107 | 1,831 |
| M | 1,452 | 559 | 893 |
| F | 1,486 | 548 | 938 |
| Big Island Lake Cree Nation (399) | |||
| Total | 984 | 786 | 198 |
| M | 470 | 389 | 81 |
| F | 514 | 397 | 117 |
| Big River (404) | |||
| Total | 2,936 | 2,231 | 705 |
| M | 1,480 | 1,149 | 331 |
| F | 1,456 | 1,082 | 374 |
| Birch Narrows First Nation (403) | |||
| Total | 642 | 381 | 261 |
| M | 306 | 183 | 123 |
| F | 336 | 198 | 138 |
| Black Lake (359) | |||
| Total | 1,864 | 1,475 | 389 |
| M | 930 | 752 | 178 |
| F | 934 | 723 | 211 |
| Buffalo River Dene Nation (398) | |||
| Total | 1,193 | 646 | 547 |
| M | 600 | 333 | 267 |
| F | 593 | 313 | 280 |
| Canoe Lake Cree First Nation (394) | |||
| Total | 1,946 | 907 | 1,039 |
| M | 1,001 | 472 | 529 |
| F | 945 | 435 | 510 |
| Clearwater River Dene (401) | |||
| Total | 1,601 | 691 | 910 |
| M | 820 | 361 | 459 |
| F | 781 | 330 | 451 |
| Cumberland House Cree Nation (350) | |||
| Total | 1,127 | 729 | 398 |
| M | 565 | 366 | 199 |
| F | 562 | 363 | 199 |
| English River First Nation (400) | |||
| Total | 1,383 | 749 | 634 |
| M | 679 | 368 | 311 |
| F | 704 | 381 | 323 |
| Flying Dust First Nation (395) | |||
| Total | 1,117 | 488 | 629 |
| M | 519 | 243 | 276 |
| F | 598 | 245 | 353 |
| Fond du Lac (351) | |||
| Total | 1,691 | 960 | 731 |
| M | 827 | 479 | 348 |
| F | 864 | 481 | 383 |
| Hatchet Lake (352) | |||
| Total | 1,511 | 1,178 | 333 |
| M | 747 | 589 | 158 |
| F | 764 | 589 | 175 |
| Island Lake First Nation (397) | |||
| Total | 1,210 | 995 | 215 |
| M | 576 | 465 | 111 |
| F | 634 | 530 | 104 |
| James Smith (370) | |||
| Total | 2,958 | 1,892 | 1,066 |
| M | 1,472 | 961 | 511 |
| F | 1,486 | 931 | 555 |
| Kinistin Saulteaux Nation (377) | |||
| Total | 909 | 374 | 535 |
| M | 447 | 194 | 253 |
| F | 462 | 180 | 282 |
| Lac La Ronge (353) | |||
| Total | 8,715 | 5,547 | 3,168 |
| M | 4,304 | 2,816 | 1,488 |
| F | 4,411 | 2,731 | 1,680 |
| Little Pine (340) | |||
| Total | 1,747 | 815 | 932 |
| M | 870 | 431 | 439 |
| F | 877 | 384 | 493 |
| Lucky Man (341) | |||
| Total | 110 | 31 | 79 |
| M | 55 | 17 | 38 |
| F | 55 | 14 | 41 |
| Makwa Sahgaiehcan First Nation (396) | |||
| Total | 1,315 | 950 | 365 |
| M | 678 | 495 | 183 |
| F | 637 | 455 | 182 |
| Mistawasis (374) | |||
| Total | 2,361 | 1,144 | 1,217 |
| M | 1,157 | 573 | 584 |
| F | 1,204 | 571 | 633 |
| Montreal Lake (354) | |||
| Total | 3,402 | 2,137 | 1,265 |
| M | 1,741 | 1,135 | 606 |
| F | 1,661 | 1,002 | 659 |
| Moosomin (342) | |||
| Total | 1,515 | 1,056 | 459 |
| M | 757 | 530 | 227 |
| F | 758 | 526 | 232 |
| Mosquito, Grizzly Bear's Head, Lean Man Fst.Natns. (343) | |||
| Total | 1,213 | 680 | 533 |
| M | 622 | 372 | 250 |
| F | 591 | 308 | 283 |
| Muskeg Lake (375) | |||
| Total | 1,800 | 321 | 1,479 |
| M | 854 | 164 | 690 |
| F | 946 | 157 | 789 |
| Muskoday First Nation (371) | |||
| Total | 1,590 | 583 | 1,007 |
| M | 749 | 298 | 451 |
| F | 841 | 285 | 556 |
| One Arrow (373) | |||
| Total | 1,496 | 582 | 914 |
| M | 738 | 294 | 444 |
| F | 758 | 288 | 470 |
| Onion Lake (344) | |||
| Total | 4,690 | 2,997 | 1,693 |
| M | 2,280 | 1,479 | 801 |
| F | 2,410 | 1,518 | 892 |
| Pelican Lake (405) | |||
| Total | 1,352 | 1,044 | 308 |
| M | 720 | 559 | 161 |
| F | 632 | 485 | 147 |
| Peter Ballantyne Cree Nation (355) | |||
| Total | 8,557 | 5,665 | 2,892 |
| M | 4,237 | 2,840 | 1,397 |
| F | 4,320 | 2,825 | 1,495 |
| Poundmaker (345) | |||
| Total | 1,449 | 800 | 649 |
| M | 685 | 410 | 275 |
| F | 764 | 390 | 374 |
| Red Earth (356) | |||
| Total | 1,384 | 1,201 | 183 |
| M | 675 | 588 | 87 |
| F | 709 | 613 | 96 |
| Red Pheasant (346) | |||
| Total | 2,093 | 760 | 1,333 |
| M | 1,032 | 398 | 634 |
| F | 1,061 | 362 | 699 |
| Saulteaux (347) | |||
| Total | 1,157 | 629 | 528 |
| M | 581 | 314 | 267 |
| F | 576 | 315 | 261 |
| Shoal Lake Cree Nation (357) | |||
| Total | 838 | 729 | 109 |
| M | 424 | 365 | 59 |
| F | 414 | 364 | 50 |
| Sturgeon Lake First Nation (360) | |||
| Total | 2,470 | 1,708 | 762 |
| M | 1,230 | 874 | 356 |
| F | 1,240 | 834 | 406 |
| Sweetgrass (348) | |||
| Total | 1,677 | 646 | 1,031 |
| M | 815 | 319 | 496 |
| F | 862 | 327 | 535 |
| Thunderchild First Nation (349) | |||
| Total | 2,526 | 1,175 | 1,351 |
| M | 1,232 | 590 | 642 |
| F | 1,294 | 585 | 709 |
| Wahpeton Dakota Nation (358) | |||
| Total | 470 | 312 | 158 |
| M | 226 | 154 | 72 |
| F | 244 | 158 | 86 |
| Waterhen Lake (402) | |||
| Total | 1,782 | 904 | 878 |
| M | 870 | 459 | 411 |
| F | 912 | 445 | 467 |
| Whitecap Dakota First Nation (372) | |||
| Total | 518 | 254 | 264 |
| M | 239 | 123 | 116 |
| F | 279 | 131 | 148 |
| Witchekan Lake (407) | |||
| Total | 637 | 463 | 174 |
| M | 331 | 247 | 84 |
| F | 306 | 216 | 90 |
| Yellow Quill (376) | |||
| Total | 2,588 | 906 | 1,682 |
| M | 1,285 | 484 | 801 |
| F | 1,303 | 422 | 881 |
| General List - Saskatchewan Region, North Central District (831) | |||
| Total | * | * | * |
| M | * | * | * |
| F | * | * | * |
| Responsibility Centre | |||
| North Central District | |||
| Total | 88,451 | 51,253 | 37,198 |
| M | 43,771 | 26,010 | 17,761 |
| F | 44,680 | 25,243 | 19,437 |
| South District | |||
| Carry The Kettle (378) | |||
| Total | 2,387 | 826 | 1,561 |
| M | 1,153 | 421 | 732 |
| F | 1,234 | 405 | 829 |
| Cote First Nation 366 (366) | |||
| Total | 3,059 | 776 | 2,283 |
| M | 1,468 | 408 | 1,060 |
| F | 1,591 | 368 | 1,223 |
| Cowessess (361) | |||
| Total | 3,592 | 776 | 2,816 |
| M | 1,687 | 399 | 1,288 |
| F | 1,905 | 377 | 1,528 |
| Day Star (389) | |||
| Total | 455 | 146 | 309 |
| M | 242 | 78 | 164 |
| F | 213 | 68 | 145 |
| Fishing Lake First Nation (390) | |||
| Total | 1,559 | 498 | 1,061 |
| M | 761 | 254 | 507 |
| F | 798 | 244 | 554 |
| Gordon (391) | |||
| Total | 3,102 | 1,073 | 2,029 |
| M | 1,573 | 598 | 975 |
| F | 1,529 | 475 | 1,054 |
| Kahkewistahaw (362) | |||
| Total | 1,702 | 533 | 1,169 |
| M | 815 | 255 | 560 |
| F | 887 | 278 | 609 |
| Kawacatoose (393) | |||
| Total | 2,764 | 1,176 | 1,588 |
| M | 1,332 | 605 | 727 |
| F | 1,432 | 571 | 861 |
| Keeseekoose (367) | |||
| Total | 2,161 | 715 | 1,446 |
| M | 1,042 | 378 | 664 |
| F | 1,119 | 337 | 782 |
| Little Black Bear (379) | |||
| Total | 464 | 205 | 259 |
| M | 228 | 103 | 125 |
| F | 236 | 102 | 134 |
| Muscowpetung (381) | |||
| Total | 1,189 | 335 | 854 |
| M | 589 | 187 | 402 |
| F | 600 | 148 | 452 |
| Muskowekwan (392) | |||
| Total | 1,538 | 465 | 1,073 |
| M | 757 | 242 | 515 |
| F | 781 | 223 | 558 |
| Nekaneet (380) | |||
| Total | 423 | 197 | 226 |
| M | 221 | 99 | 122 |
| F | 202 | 98 | 104 |
| Ocean Man (408) | |||
| Total | 445 | 136 | 309 |
| M | 215 | 71 | 144 |
| F | 230 | 65 | 165 |
| Ochapowace (363) | |||
| Total | 1,450 | 563 | 887 |
| M | 719 | 302 | 417 |
| F | 731 | 261 | 470 |
| Okanese (382) | |||
| Total | 604 | 259 | 345 |
| M | 309 | 136 | 173 |
| F | 295 | 123 | 172 |
| Pasqua First Nation #79 (383) | |||
| Total | 1,796 | 563 | 1,233 |
| M | 917 | 307 | 610 |
| F | 879 | 256 | 623 |
| Peepeekisis (384) | |||
| Total | 2,339 | 658 | 1,681 |
| M | 1,139 | 348 | 791 |
| F | 1,200 | 310 | 890 |
| Pheasant Rump Nakota (409) | |||
| Total | 369 | 156 | 213 |
| M | 177 | 81 | 96 |
| F | 192 | 75 | 117 |
| Piapot (385) | |||
| Total | 2,040 | 597 | 1,443 |
| M | 1,016 | 330 | 686 |
| F | 1,024 | 267 | 757 |
| Sakimay First Nations (364) | |||
| Total | 1,410 | 236 | 1,174 |
| M | 696 | 124 | 572 |
| F | 714 | 112 | 602 |
| Standing Buffalo (386) | |||
| Total | 1,132 | 441 | 691 |
| M | 565 | 216 | 349 |
| F | 567 | 225 | 342 |
| Star Blanket (387) | |||
| Total | 576 | 263 | 313 |
| M | 271 | 135 | 136 |
| F | 305 | 128 | 177 |
| The Key First Nation (368) | |||
| Total | 1,121 | 300 | 821 |
| M | 543 | 141 | 402 |
| F | 578 | 159 | 419 |
| White Bear (365) | |||
| Total | 2,307 | 836 | 1,471 |
| M | 1,118 | 427 | 691 |
| F | 1,189 | 409 | 780 |
| Wood Mountain (388) | |||
| Total | 217 | * | * |
| M | 103 | * | * |
| F | 114 | * | * |
| General List - Saskatchewan Region, South District (834) | |||
| Total | * | * | * |
| M | * | * | * |
| F | * | * | * |
| Responsibility Centre | |||
| South District | |||
| Total | 40,203 | 12,738 | 27,465 |
| M | 19,658 | 6,650 | 13,008 |
| F | 20,545 | 6,088 | 14,457 |
| Saskatchewan Region - 6 | |||
| Total | 128,654 | 63,991 | 64,663 |
| M | 63,429 | 32,660 | 30,769 |
| F | 65,225 | 31,331 | 33,894 |
*Data Suppressed due to low counts
Alberta
| Group and No. | Total (a + b) |
On Reserve and On Crown Land (includes lands affiliated with First Nations operating under Self-Government Agreements) (a) |
Off Reserve (b) |
|---|---|---|---|
| Gender | |||
| Alberta District | |||
| Alexander (438) | |||
| Total | 1,814 | 992 | 822 |
| M | 927 | 510 | 417 |
| F | 887 | 482 | 405 |
| Alexis Nakota Sioux Nation (437) | |||
| Total | 1,623 | 958 | 665 |
| M | 835 | 506 | 329 |
| F | 788 | 452 | 336 |
| Athabasca Chipewyan First Nation (463) | |||
| Total | 876 | 238 | 638 |
| M | 416 | 117 | 299 |
| F | 460 | 121 | 339 |
| Bearspaw (473) - Stoney | |||
| Total | 1,630 | 1,514 | 116 |
| M | 784 | 720 | 64 |
| F | 846 | 794 | 52 |
| Beaver First Nation (445) | |||
| Total | 832 | 411 | 421 |
| M | 408 | 212 | 196 |
| F | 424 | 199 | 225 |
| Bigstone Cree Nation (458) | |||
| Total | 7,103 | 3,288 | 3,815 |
| M | 3,473 | 1,656 | 1,817 |
| F | 3,630 | 1,632 | 1,998 |
| Blood (435) | |||
| Total | 10,498 | 7,674 | 2,824 |
| M | 5,133 | 3,871 | 1,262 |
| F | 5,365 | 3,803 | 1,562 |
| Chiniki (433) - Stoney | |||
| Total | 1,620 | 1,500 | 120 |
| M | 814 | 766 | 48 |
| F | 806 | 734 | 72 |
| Chipewyan Prairie First Nation (470) | |||
| Total | 696 | 335 | 361 |
| M | 366 | 184 | 182 |
| F | 330 | 151 | 179 |
| Dene Tha' (448) | |||
| Total | 2,633 | 1,911 | 722 |
| M | 1,298 | 992 | 306 |
| F | 1,335 | 919 | 416 |
| Driftpile First Nation (450) | |||
| Total | 2,336 | 867 | 1,469 |
| M | 1,189 | 470 | 719 |
| F | 1,147 | 397 | 750 |
| Duncan's First Nation (451) | |||
| Total | 226 | 132 | 94 |
| M | 110 | 67 | 43 |
| F | 116 | 65 | 51 |
| Enoch Cree Nation #440 (440) | |||
| Total | 2,101 | 1,528 | 573 |
| M | 1,022 | 776 | 246 |
| F | 1,079 | 752 | 327 |
| Ermineskin Tribe (443) | |||
| Total | 3,802 | 3,008 | 794 |
| M | 1,853 | 1,486 | 367 |
| F | 1,949 | 1,522 | 427 |
| Fort McKay First Nation (467) | |||
| Total | 647 | 337 | 310 |
| M | 316 | 168 | 148 |
| F | 331 | 169 | 162 |
| Fort McMurray #468 First Nation (468) | |||
| Total | 602 | 259 | 343 |
| M | 272 | 125 | 147 |
| F | 330 | 134 | 196 |
| Horse Lake First Nation (449) | |||
| Total | 900 | 408 | 492 |
| M | 450 | 221 | 229 |
| F | 450 | 187 | 263 |
| Kapawe'no First Nation (452) | |||
| Total | 313 | 102 | 211 |
| M | 147 | 50 | 97 |
| F | 166 | 52 | 114 |
| Little Red River Cree Nation (447) | |||
| Total | 4,328 | 3,834 | 494 |
| M | 2,152 | 1,927 | 225 |
| F | 2,176 | 1,907 | 269 |
| Loon River Cree (476) | |||
| Total | 484 | 399 | 85 |
| M | 243 | 199 | 44 |
| F | 241 | 200 | 41 |
| Louis Bull (439) | |||
| Total | 1,884 | 1,568 | 316 |
| M | 929 | 788 | 141 |
| F | 955 | 780 | 175 |
| Lubicon Lake (453) | |||
| Total | 429 | 254 | 175 |
| M | 219 | 135 | 84 |
| F | 210 | 119 | 91 |
| Mikisew Cree First Nation (461) | |||
| Total | 2,537 | 778 | 1,759 |
| M | 1,244 | 396 | 848 |
| F | 1,293 | 382 | 911 |
| Montana (442) | |||
| Total | 892 | 699 | 193 |
| M | 438 | 346 | 92 |
| F | 454 | 353 | 101 |
| O'Chiese (431) | |||
| Total | 999 | 715 | 284 |
| M | 492 | 359 | 133 |
| F | 507 | 356 | 151 |
| Paul (441) | |||
| Total | 1,822 | 1,278 | 544 |
| M | 890 | 636 | 254 |
| F | 932 | 642 | 290 |
| Piikani Nation (436) | |||
| Total | 3,474 | 2,361 | 1,113 |
| M | 1,685 | 1,169 | 516 |
| F | 1,789 | 1,192 | 597 |
| Samson (444) | |||
| Total | 6,992 | 5,659 | 1,333 |
| M | 3,475 | 2,828 | 647 |
| F | 3,517 | 2,831 | 686 |
| Sawridge (454) | |||
| Total | 380 | 42 | 338 |
| M | 189 | 22 | 167 |
| F | 191 | 20 | 171 |
| Siksika Nation (430) | |||
| Total | 6,386 | 3,715 | 2,671 |
| M | 3,225 | 1,911 | 1,314 |
| F | 3,161 | 1,804 | 1,357 |
| Smith's Landing First Nation (477) | |||
| Total | 314 | 154 | 160 |
| M | 165 | 84 | 81 |
| F | 149 | 70 | 79 |
| Sturgeon Lake Cree Nation (455) | |||
| Total | 2,657 | 1,347 | 1,310 |
| M | 1,273 | 683 | 590 |
| F | 1,384 | 664 | 720 |
| Sucker Creek (456) | |||
| Total | 2,377 | 692 | 1,685 |
| M | 1,155 | 368 | 787 |
| F | 1,222 | 324 | 898 |
| Sunchild First Nation (434) | |||
| Total | 1,216 | 825 | 391 |
| M | 613 | 421 | 192 |
| F | 603 | 404 | 199 |
| Swan River First Nation (457) | |||
| Total | 1,100 | 360 | 740 |
| M | 534 | 195 | 339 |
| F | 566 | 165 | 401 |
| Tallcree (446) | |||
| Total | 1,070 | 509 | 561 |
| M | 547 | 276 | 271 |
| F | 523 | 233 | 290 |
| Tsuu T'Ina Nation (432) | |||
| Total | 1,665 | 1,405 | 260 |
| M | 778 | 675 | 103 |
| F | 887 | 730 | 157 |
| Wesley (475) - Stoney | |||
| Total | 1,478 | 1,345 | 133 |
| M | 757 | 695 | 62 |
| F | 721 | 650 | 71 |
| Whitefish Lake (459) | |||
| Total | 2,123 | 1,375 | 748 |
| M | 1,071 | 699 | 372 |
| F | 1,052 | 676 | 376 |
| Woodland Cree First Nation (474) | |||
| Total | 971 | 732 | 239 |
| M | 479 | 365 | 114 |
| F | 492 | 367 | 125 |
| General List - Alberta Region, Alberta District (838) | |||
| Total | 750 | * | * |
| M | 334 | * | * |
| F | 416 | * | * |
| Responsibility Centre | |||
| Alberta District | |||
| Total | 86,580 | 55,513 | 31,067 |
| M | 42,700 | 28,075 | 14,625 |
| F | 43,880 | 27,438 | 16,442 |
| St. Paul District | |||
| Beaver Lake Cree Nation (460) | |||
| Total | 919 | 363 | 556 |
| M | 458 | 193 | 265 |
| F | 461 | 170 | 291 |
| Cold Lake First Nations (464) | |||
| Total | 2,365 | 1,243 | 1,122 |
| M | 1,139 | 654 | 485 |
| F | 1,226 | 589 | 637 |
| Frog Lake (465) | |||
| Total | 2,563 | 1,686 | 877 |
| M | 1,254 | 838 | 416 |
| F | 1,309 | 848 | 461 |
| Heart Lake (469) | |||
| Total | 297 | 194 | 103 |
| M | 154 | 106 | 48 |
| F | 143 | 88 | 55 |
| Kehewin Cree Nation (466) | |||
| Total | 1,799 | 1,075 | 724 |
| M | 867 | 543 | 324 |
| F | 932 | 532 | 400 |
| Saddle Lake (462) | |||
| Total | 8,918 | 5,931 | 2,987 |
| M | 4,390 | 3,021 | 1,369 |
| F | 4,528 | 2,910 | 1,618 |
| Responsibility Centre | |||
| St. Paul District | |||
| Total | 16,861 | 10,492 | 6,369 |
| M | 8,262 | 5,355 | 2,907 |
| F | 8,599 | 5,137 | 3,462 |
| Alberta Region - 7 | |||
| Total | 103,441 | 66,005 | 37,436 |
| M | 50,962 | 33,430 | 17,532 |
| F | 52,479 | 32,575 | 19,904 |
*Data Suppressed due to low counts
British Columbia
| Group and No. | Total (a + b) |
On Reserve and On Crown Land (includes lands affiliated with First Nations operating under Self-Government Agreements) (a) |
Off Reserve (b) |
|---|---|---|---|
| Gender | |||
| ?Akisq'nuk First Nation (604) | |||
| Total | 260 | 149 | 111 |
| M | 134 | 78 | 56 |
| F | 126 | 71 | 55 |
| Adams Lake (684) | |||
| Total | 726 | 413 | 313 |
| M | 352 | 215 | 137 |
| F | 374 | 198 | 176 |
| Ahousaht (659) | |||
| Total | 1,876 | 676 | 1,200 |
| M | 916 | 333 | 583 |
| F | 960 | 343 | 617 |
| Aitchelitz (558) | |||
| Total | 40 | * | * |
| M | 21 | * | * |
| F | 19 | * | * |
| Alexandria (709) | |||
| Total | 175 | 53 | 122 |
| M | 89 | 38 | 51 |
| F | 86 | 15 | 71 |
| Alexis Creek (710) | |||
| Total | 614 | 347 | 267 |
| M | 291 | 176 | 115 |
| F | 323 | 171 | 152 |
| Ashcroft (685) | |||
| Total | 246 | 81 | 165 |
| M | 124 | 46 | 78 |
| F | 122 | 35 | 87 |
| Beecher Bay (640) | |||
| Total | 238 | 114 | 124 |
| M | 109 | 52 | 57 |
| F | 129 | 62 | 67 |
| Blueberry River First Nations (547) | |||
| Total | 426 | 227 | 199 |
| M | 219 | 129 | 90 |
| F | 207 | 98 | 109 |
| Bonaparte (686) | |||
| Total | 813 | 230 | 583 |
| M | 375 | 112 | 263 |
| F | 438 | 118 | 320 |
| Boothroyd (700) | |||
| Total | 263 | 96 | 167 |
| M | 139 | 55 | 84 |
| F | 124 | 41 | 83 |
| Boston Bar First Nation (701) | |||
| Total | 239 | 96 | 143 |
| M | 131 | 55 | 76 |
| F | 108 | 41 | 67 |
| Bridge River (590) | |||
| Total | 411 | 215 | 196 |
| M | 203 | 93 | 110 |
| F | 208 | 122 | 86 |
| Burns Lake (619) | |||
| Total | 101 | 45 | 56 |
| M | 57 | 27 | 30 |
| F | 44 | 18 | 26 |
| Burrard (549) | |||
| Total | 448 | 272 | 176 |
| M | 220 | 148 | 72 |
| F | 228 | 124 | 104 |
| Campbell River (622) | |||
| Total | 658 | 351 | 307 |
| M | 315 | 178 | 137 |
| F | 343 | 173 | 170 |
| Canim Lake (713) | |||
| Total | 568 | 447 | 121 |
| M | 277 | 220 | 57 |
| F | 291 | 227 | 64 |
| Canoe Creek (723) | |||
| Total | 688 | 314 | 374 |
| M | 362 | 177 | 185 |
| F | 326 | 137 | 189 |
| Cape Mudge (623) | |||
| Total | 917 | 369 | 548 |
| M | 453 | 195 | 258 |
| F | 464 | 174 | 290 |
| Cayoose Creek (591) | |||
| Total | 189 | 88 | 101 |
| M | 97 | 47 | 50 |
| F | 92 | 41 | 51 |
| Chawathil (583) | |||
| Total | 532 | 374 | 158 |
| M | 267 | 191 | 76 |
| F | 265 | 183 | 82 |
| Cheam (584) | |||
| Total | 474 | 271 | 203 |
| M | 233 | 141 | 92 |
| F | 241 | 130 | 111 |
| Chehalis (559) | |||
| Total | 972 | 539 | 433 |
| M | 491 | 292 | 199 |
| F | 481 | 247 | 234 |
| Chemainus First Nation (641) | |||
| Total | 1,141 | 743 | 398 |
| M | 563 | 401 | 162 |
| F | 578 | 342 | 236 |
| Cheslatta Carrier Nation (620) | |||
| Total | 319 | 163 | 156 |
| M | 142 | 80 | 62 |
| F | 177 | 83 | 94 |
| Coldwater (693) | |||
| Total | 773 | 393 | 380 |
| M | 364 | 189 | 175 |
| F | 409 | 204 | 205 |
| Comox (624) | |||
| Total | 278 | 117 | 161 |
| M | 123 | 47 | 76 |
| F | 155 | 70 | 85 |
| Cook's Ferry (694) | |||
| Total | 295 | 77 | 218 |
| M | 146 | 44 | 102 |
| F | 149 | 33 | 116 |
| Cowichan (642) | |||
| Total | 4,279 | 2,511 | 1,768 |
| M | 2,091 | 1,260 | 831 |
| F | 2,188 | 1,251 | 937 |
| Da'naxda'xw First Nation (635) | |||
| Total | 191 | 55 | 136 |
| M | 93 | 25 | 68 |
| F | 98 | 30 | 68 |
| Ditidaht (662) | |||
| Total | 712 | 232 | 480 |
| M | 341 | 117 | 224 |
| F | 371 | 115 | 256 |
| Doig River (548) | |||
| Total | 262 | 131 | 131 |
| M | 135 | 71 | 64 |
| F | 127 | 60 | 67 |
| Douglas (561) | |||
| Total | 235 | 91 | 144 |
| M | 113 | 56 | 57 |
| F | 122 | 35 | 87 |
| Ehattesaht (634) | |||
| Total | 333 | 120 | 213 |
| M | 165 | 61 | 104 |
| F | 168 | 59 | 109 |
| Esketemc (711) | |||
| Total | 777 | 456 | 321 |
| M | 397 | 240 | 157 |
| F | 380 | 216 | 164 |
| Esquimalt (644) | |||
| Total | 255 | 166 | 89 |
| M | 108 | 74 | 34 |
| F | 147 | 92 | 55 |
| Fort Nelson First Nation (543) | |||
| Total | 794 | 418 | 376 |
| M | 395 | 227 | 168 |
| F | 399 | 191 | 208 |
| Gitanmaax (531) | |||
| Total | 2,125 | 817 | 1,308 |
| M | 1,074 | 411 | 663 |
| F | 1,051 | 406 | 645 |
| Gitanyow (537) | |||
| Total | 745 | 398 | 347 |
| M | 391 | 213 | 178 |
| F | 354 | 185 | 169 |
| Gitsegukla (535) | |||
| Total | 909 | 450 | 459 |
| M | 460 | 233 | 227 |
| F | 449 | 217 | 232 |
| Gitwangak (536) | |||
| Total | 1,125 | 465 | 660 |
| M | 557 | 259 | 298 |
| F | 568 | 206 | 362 |
| Gitxaala Nation (672) | |||
| Total | 1,761 | 425 | 1,336 |
| M | 847 | 223 | 624 |
| F | 914 | 202 | 712 |
| Glen Vowell (533) | |||
| Total | 390 | 184 | 206 |
| M | 211 | 107 | 104 |
| F | 179 | 77 | 102 |
| Gwa'Sala-Nakwaxda'xw (724) | |||
| Total | 786 | 462 | 324 |
| M | 391 | 241 | 150 |
| F | 395 | 221 | 174 |
| Gwawaenuk Tribe (627) | |||
| Total | * | * | * |
| M | * | * | * |
| F | * | * | * |
| Hagwilget Village (534) | |||
| Total | 693 | 229 | 464 |
| M | 343 | 123 | 220 |
| F | 350 | 106 | 244 |
| Halalt (645) | |||
| Total | 207 | 101 | 106 |
| M | 102 | 53 | 49 |
| F | 105 | 48 | 57 |
| Halfway River First Nation (546) | |||
| Total | 242 | 157 | 85 |
| M | 124 | 84 | 40 |
| F | 118 | 73 | 45 |
| Hartley Bay (675) | |||
| Total | 668 | 165 | 503 |
| M | 320 | 80 | 240 |
| F | 348 | 85 | 263 |
| Heiltsuk (538) | |||
| Total | 2,217 | 1,140 | 1,077 |
| M | 1,129 | 607 | 522 |
| F | 1,088 | 533 | 555 |
| Hesquiaht (661) | |||
| Total | 662 | 181 | 481 |
| M | 324 | 102 | 222 |
| F | 338 | 79 | 259 |
| High Bar (703) | |||
| Total | 72 | 0 | 72 |
| M | 37 | 0 | 37 |
| F | 35 | 0 | 35 |
| Homalco (552) | |||
| Total | 457 | 247 | 210 |
| M | 237 | 130 | 107 |
| F | 220 | 117 | 103 |
| Hupacasath First Nation (664) | |||
| Total | 263 | 135 | 128 |
| M | 139 | 64 | 75 |
| F | 124 | 71 | 53 |
| Huu-ay-aht First Nations (663) | |||
| Total | 656 | 128 | 528 |
| M | 313 | 63 | 250 |
| F | 343 | 65 | 278 |
| Iskut (683) | |||
| Total | 671 | 336 | 335 |
| M | 343 | 185 | 158 |
| F | 328 | 151 | 177 |
| Ka:'yu:'k't'h'/Che:k:tles7et'h' First Nations (638) | |||
| Total | 502 | 169 | 333 |
| M | 255 | 93 | 162 |
| F | 247 | 76 | 171 |
| Kamloops (688) | |||
| Total | 1,086 | 613 | 473 |
| M | 505 | 300 | 205 |
| F | 581 | 313 | 268 |
| Kanaka Bar (704) | |||
| Total | 202 | 77 | 125 |
| M | 111 | 41 | 70 |
| F | 91 | 36 | 55 |
| Katzie (563) | |||
| Total | 497 | 298 | 199 |
| M | 250 | 154 | 96 |
| F | 247 | 144 | 103 |
| Kispiox (532) | |||
| Total | 1,472 | 714 | 758 |
| M | 714 | 375 | 339 |
| F | 758 | 339 | 419 |
| Kitamaat (676) | |||
| Total | 1,628 | 676 | 952 |
| M | 805 | 373 | 432 |
| F | 823 | 303 | 520 |
| Kitasoo (540) | |||
| Total | 500 | 305 | 195 |
| M | 242 | 162 | 80 |
| F | 258 | 143 | 115 |
| Kitselas (680) | |||
| Total | 527 | 249 | 278 |
| M | 238 | 117 | 121 |
| F | 289 | 132 | 157 |
| Kitsumkalum (681) | |||
| Total | 657 | 219 | 438 |
| M | 327 | 113 | 214 |
| F | 330 | 106 | 224 |
| Klahoose First Nation (553) | |||
| Total | 326 | 76 | 250 |
| M | 159 | 38 | 121 |
| F | 167 | 38 | 129 |
| Kluskus (721) | |||
| Total | 199 | 42 | 157 |
| M | 98 | 19 | 79 |
| F | 101 | 23 | 78 |
| Kwadacha (610) | |||
| Total | 458 | 277 | 181 |
| M | 228 | 143 | 85 |
| F | 230 | 134 | 96 |
| Kwakiutl (626) | |||
| Total | 672 | 317 | 355 |
| M | 327 | 167 | 160 |
| F | 345 | 150 | 195 |
| Kwantlen First Nation (564) | |||
| Total | 198 | 84 | 114 |
| M | 97 | 44 | 53 |
| F | 101 | 40 | 61 |
| Kwaw-kwaw-Apilt (580) | |||
| Total | 40 | 30 | 10 |
| M | 21 | * | * |
| F | 19 | * | * |
| Kwiakah (628) | |||
| Total | * | * | * |
| M | * | * | * |
| F | * | * | * |
| Kwicksutaineuk-ah-kwaw-ah-mish (625) | |||
| Total | 273 | 72 | 201 |
| M | 148 | 41 | 107 |
| F | 125 | 31 | 94 |
| Kwikwetlem First Nation (560) | |||
| Total | 61 | 31 | 30 |
| M | 39 | 19 | 20 |
| F | 22 | 12 | 10 |
| Lake Babine Nation (607) | |||
| Total | 2,239 | 1,386 | 853 |
| M | 1,089 | 691 | 398 |
| F | 1,150 | 695 | 455 |
| Lake Cowichan First Nation (643) | |||
| Total | * | * | * |
| M | * | * | * |
| F | * | * | * |
| Lax-kw'alaams (674) | |||
| Total | 3,173 | 821 | 2,352 |
| M | 1,594 | 456 | 1,138 |
| F | 1,579 | 365 | 1,214 |
| Leq' a: mel First Nation (579) | |||
| Total | 342 | 128 | 214 |
| M | 156 | 63 | 93 |
| F | 186 | 65 | 121 |
| Lheidli T'enneh (611) | |||
| Total | 326 | 96 | 230 |
| M | 162 | 46 | 116 |
| F | 164 | 50 | 114 |
| Little Shuswap Lake (689) | |||
| Total | 310 | 228 | 82 |
| M | 171 | 125 | 46 |
| F | 139 | 103 | 36 |
| Lower Kootenay (606) | |||
| Total | 210 | 110 | 100 |
| M | 100 | 54 | 46 |
| F | 110 | 56 | 54 |
| Lower Nicola (695) | |||
| Total | 1,041 | 541 | 500 |
| M | 503 | 274 | 229 |
| F | 538 | 267 | 271 |
| Lower Similkameen (598) | |||
| Total | 463 | 288 | 175 |
| M | 224 | 140 | 84 |
| F | 239 | 148 | 91 |
| Lyackson (646) | |||
| Total | 195 | 41 | 154 |
| M | 89 | 22 | 67 |
| F | 106 | 19 | 87 |
| Lytton (705) | |||
| Total | 1,838 | 930 | 908 |
| M | 905 | 493 | 412 |
| F | 933 | 437 | 496 |
| Malahat First Nation (647) | |||
| Total | 263 | 150 | 113 |
| M | 138 | 84 | 54 |
| F | 125 | 66 | 59 |
| Mamalilikulla-Qwe'Qwa'Sot'Em (629) | |||
| Total | 386 | 59 | 327 |
| M | 191 | 26 | 165 |
| F | 195 | 33 | 162 |
| Matsqui (565) | |||
| Total | 233 | 104 | 129 |
| M | 112 | 56 | 56 |
| F | 121 | 48 | 73 |
| McLeod Lake (618) | |||
| Total | 486 | 130 | 356 |
| M | 227 | 69 | 158 |
| F | 259 | 61 | 198 |
| Metlakatla (673) | |||
| Total | 791 | 114 | 677 |
| M | 369 | 47 | 322 |
| F | 422 | 67 | 355 |
| Moricetown (530) | |||
| Total | 1,860 | 684 | 1,176 |
| M | 944 | 371 | 573 |
| F | 916 | 313 | 603 |
| Mount Currie (557) | |||
| Total | 1,979 | 1,408 | 571 |
| M | 999 | 737 | 262 |
| F | 980 | 671 | 309 |
| Mowachaht/Muchalaht (630) | |||
| Total | 553 | 234 | 319 |
| M | 304 | 136 | 168 |
| F | 249 | 98 | 151 |
| Musqueam (550) | |||
| Total | 1,213 | 730 | 483 |
| M | 556 | 349 | 207 |
| F | 657 | 381 | 276 |
| Nadleh Whuten (612) | |||
| Total | 421 | 216 | 205 |
| M | 213 | 116 | 97 |
| F | 208 | 100 | 108 |
| Nak'azdli (614) | |||
| Total | 1,721 | 730 | 991 |
| M | 852 | 378 | 474 |
| F | 869 | 352 | 517 |
| Namgis First Nation (631) | |||
| Total | 1,615 | 956 | 659 |
| M | 775 | 474 | 301 |
| F | 840 | 482 | 358 |
| Nanoose First Nation (649) | |||
| Total | 223 | 154 | 69 |
| M | 101 | 70 | 31 |
| F | 122 | 84 | 38 |
| Nazko (720) | |||
| Total | 338 | 164 | 174 |
| M | 171 | 93 | 78 |
| F | 167 | 71 | 96 |
| Nee-Tahi-Buhn (726) | |||
| Total | 133 | 56 | 77 |
| M | 62 | 30 | 32 |
| F | 71 | 26 | 45 |
| Neskonlith (690) | |||
| Total | 599 | 316 | 283 |
| M | 306 | 165 | 141 |
| F | 293 | 151 | 142 |
| New Westminster (566) | |||
| Total | * | * | * |
| M | * | * | * |
| F | * | * | * |
| Nicomen (696) | |||
| Total | 127 | 66 | 61 |
| M | 69 | 36 | 33 |
| F | 58 | 30 | 28 |
| Nisga'a Village of Gingolx (671) | |||
| Total | 1,934 | 449 | 1,485 |
| M | 972 | 241 | 731 |
| F | 962 | 208 | 754 |
| Nisga'a Village of Gitwinksihlkw (679) | |||
| Total | 382 | 207 | 175 |
| M | 184 | 95 | 89 |
| F | 198 | 112 | 86 |
| Nisga'a Village of Laxgalt'sap (678) | |||
| Total | 1,638 | 573 | 1,065 |
| M | 835 | 325 | 510 |
| F | 803 | 248 | 555 |
| Nisga'a Village of New Aiyansh (677) | |||
| Total | 1,769 | 894 | 875 |
| M | 904 | 476 | 428 |
| F | 865 | 418 | 447 |
| Nooaitch (699) | |||
| Total | 202 | 114 | 88 |
| M | 100 | 60 | 40 |
| F | 102 | 54 | 48 |
| N'Quatqua (556) | |||
| Total | 299 | 201 | 98 |
| M | 149 | 101 | 48 |
| F | 150 | 100 | 50 |
| Nuchatlaht (639) | |||
| Total | 173 | 57 | 116 |
| M | 75 | 26 | 49 |
| F | 98 | 31 | 67 |
| Nuxalk Nation (539) | |||
| Total | 1,506 | 857 | 649 |
| M | 714 | 424 | 290 |
| F | 792 | 433 | 359 |
| Okanagan (616) | |||
| Total | 1,746 | 880 | 866 |
| M | 844 | 457 | 387 |
| F | 902 | 423 | 479 |
| Old Massett Village Council (669) | |||
| Total | 2,677 | 729 | 1,948 |
| M | 1,308 | 403 | 905 |
| F | 1,369 | 326 | 1,043 |
| Oregon Jack Creek (692) | |||
| Total | 62 | 19 | 43 |
| M | 25 | * | * |
| F | 37 | * | * |
| Osoyoos (596) | |||
| Total | 465 | 359 | 106 |
| M | 248 | 205 | 43 |
| F | 217 | 154 | 63 |
| Oweekeno/Wuikinuxv Nation (541) | |||
| Total | 280 | 88 | 192 |
| M | 137 | 42 | 95 |
| F | 143 | 46 | 97 |
| Pacheedaht First Nation (658) | |||
| Total | 260 | 119 | 141 |
| M | 117 | 57 | 60 |
| F | 143 | 62 | 81 |
| Pauquachin (652) | |||
| Total | 369 | 266 | 103 |
| M | 158 | 123 | 35 |
| F | 211 | 143 | 68 |
| Penelakut (650) | |||
| Total | 845 | 536 | 309 |
| M | 436 | 275 | 161 |
| F | 409 | 261 | 148 |
| Penticton (597) | |||
| Total | 936 | 582 | 354 |
| M | 460 | 297 | 163 |
| F | 476 | 285 | 191 |
| Peters (586) | |||
| Total | 121 | 47 | 74 |
| M | 63 | 25 | 38 |
| F | 58 | 22 | 36 |
| Popkum (585) | |||
| Total | * | * | * |
| M | * | * | * |
| F | * | * | * |
| Prophet River First Nation (544) | |||
| Total | 235 | 108 | 127 |
| M | 116 | 55 | 61 |
| F | 119 | 53 | 66 |
| Qualicum First Nation (651) | |||
| Total | 106 | 59 | 47 |
| M | 46 | 30 | 16 |
| F | 60 | 29 | 31 |
| Quatsino (633) | |||
| Total | 451 | 219 | 232 |
| M | 227 | 116 | 111 |
| F | 224 | 103 | 121 |
| Red Bluff (715) | |||
| Total | 153 | 104 | 49 |
| M | 56 | 41 | 15 |
| F | 97 | 63 | 34 |
| Saik'uz First Nation (615) | |||
| Total | 876 | 362 | 514 |
| M | 408 | 189 | 219 |
| F | 468 | 173 | 295 |
| Samahquam (567) | |||
| Total | 317 | 110 | 207 |
| M | 155 | 65 | 90 |
| F | 162 | 45 | 117 |
| Saulteau First Nations (542) | |||
| Total | 864 | 358 | 506 |
| M | 402 | 188 | 214 |
| F | 462 | 170 | 292 |
| Scowlitz (568) | |||
| Total | 242 | 110 | 132 |
| M | 133 | 63 | 70 |
| F | 109 | 47 | 62 |
| Seabird Island (581) | |||
| Total | 818 | 541 | 277 |
| M | 391 | 255 | 136 |
| F | 427 | 286 | 141 |
| Sechelt (551) | |||
| Total | 1,232 | 656 | 576 |
| M | 634 | 362 | 272 |
| F | 598 | 294 | 304 |
| Semiahmoo (569) | |||
| Total | 80 | 53 | 27 |
| M | 36 | 24 | 12 |
| F | 44 | 29 | 15 |
| Seton Lake (595) | |||
| Total | 632 | 358 | 274 |
| M | 330 | 189 | 141 |
| F | 302 | 169 | 133 |
| Shackan (698) | |||
| Total | 122 | 86 | 36 |
| M | 70 | 50 | 20 |
| F | 52 | 36 | 16 |
| Shuswap (605) | |||
| Total | 230 | 104 | 126 |
| M | 110 | 52 | 58 |
| F | 120 | 52 | 68 |
| Shxwhá:y Village (570) | |||
| Total | 324 | 94 | 230 |
| M | 154 | 46 | 108 |
| F | 170 | 48 | 122 |
| Shxw'ow'hamel First Nation (587) | |||
| Total | 170 | 98 | 72 |
| M | 90 | 55 | 35 |
| F | 80 | 43 | 37 |
| Simpcw First Nation (691) | |||
| Total | 644 | 242 | 402 |
| M | 307 | 127 | 180 |
| F | 337 | 115 | 222 |
| Siska (706) | |||
| Total | 298 | 99 | 199 |
| M | 144 | 50 | 94 |
| F | 154 | 49 | 105 |
| Skatin Nations (562) | |||
| Total | 384 | 135 | 249 |
| M | 196 | 77 | 119 |
| F | 188 | 58 | 130 |
| Skawahlook First Nation (582) | |||
| Total | 75 | 16 | 59 |
| M | 35 | * | * |
| F | 40 | * | * |
| Skeetchestn (687) | |||
| Total | 490 | 289 | 201 |
| M | 241 | 150 | 91 |
| F | 249 | 139 | 110 |
| Skidegate (670) | |||
| Total | 1,449 | 710 | 739 |
| M | 703 | 330 | 373 |
| F | 746 | 380 | 366 |
| Skin Tyee (729) | |||
| Total | 143 | 59 | 84 |
| M | 82 | 34 | 48 |
| F | 61 | 25 | 36 |
| Skowkale (571) | |||
| Total | 229 | 168 | 61 |
| M | 110 | 82 | 28 |
| F | 119 | 86 | 33 |
| Skuppah (707) | |||
| Total | 102 | 67 | 35 |
| M | 53 | 38 | 15 |
| F | 49 | 29 | 20 |
| Skwah (573) | |||
| Total | 474 | 283 | 191 |
| M | 225 | 138 | 87 |
| F | 249 | 145 | 104 |
| Sliammon (554) | |||
| Total | 960 | 574 | 386 |
| M | 472 | 289 | 183 |
| F | 488 | 285 | 203 |
| Snuneymuxw First Nation (648) | |||
| Total | 1,561 | 671 | 890 |
| M | 768 | 345 | 423 |
| F | 793 | 326 | 467 |
| Soda Creek (716) | |||
| Total | 360 | 175 | 185 |
| M | 179 | 93 | 86 |
| F | 181 | 82 | 99 |
| Songhees First Nation (656) | |||
| Total | 504 | 338 | 166 |
| M | 238 | 159 | 79 |
| F | 266 | 179 | 87 |
| Soowahlie (572) | |||
| Total | 352 | 194 | 158 |
| M | 174 | 107 | 67 |
| F | 178 | 87 | 91 |
| Spallumcheen (600) | |||
| Total | 772 | 383 | 389 |
| M | 369 | 204 | 165 |
| F | 403 | 179 | 224 |
| Spuzzum (708) | |||
| Total | 208 | 45 | 163 |
| M | 107 | 29 | 78 |
| F | 101 | 16 | 85 |
| Squamish (555) | |||
| Total | 3,646 | 2,395 | 1,251 |
| M | 1,733 | 1,177 | 556 |
| F | 1,913 | 1,218 | 695 |
| Squiala First Nation (574) | |||
| Total | 136 | 96 | 40 |
| M | 78 | 63 | 15 |
| F | 58 | 33 | 25 |
| St. Mary's (602) | |||
| Total | 344 | 215 | 129 |
| M | 165 | 108 | 57 |
| F | 179 | 107 | 72 |
| Stellat'en First Nation (613) | |||
| Total | 423 | 221 | 202 |
| M | 210 | 118 | 92 |
| F | 213 | 103 | 110 |
| Stone (717) | |||
| Total | 397 | 268 | 129 |
| M | 196 | 141 | 55 |
| F | 201 | 127 | 74 |
| Sumas First Nation (578) | |||
| Total | 279 | 153 | 126 |
| M | 126 | 69 | 57 |
| F | 153 | 84 | 69 |
| Tahltan (682) | |||
| Total | 1,668 | 313 | 1,355 |
| M | 826 | 167 | 659 |
| F | 842 | 146 | 696 |
| Takla Lake First Nation (608) | |||
| Total | 672 | 400 | 272 |
| M | 315 | 194 | 121 |
| F | 357 | 206 | 151 |
| T'it'q'et (593) | |||
| Total | 378 | 192 | 186 |
| M | 191 | 98 | 93 |
| F | 187 | 94 | 93 |
| Tla-o-qui-aht First Nations (660) | |||
| Total | 948 | 330 | 618 |
| M | 458 | 169 | 289 |
| F | 490 | 161 | 329 |
| Tlatlasikwala (632) | |||
| Total | 58 | 41 | 17 |
| M | 30 | * | * |
| F | 28 | * | * |
| Tl'azt'en Nation (617) | |||
| Total | 1,553 | 621 | 932 |
| M | 788 | 338 | 450 |
| F | 765 | 283 | 482 |
| Tl'etinqox-t'in Government Office (712) | |||
| Total | 1,443 | 593 | 850 |
| M | 691 | 326 | 365 |
| F | 752 | 267 | 485 |
| Tlowitsis Tribe (637) | |||
| Total | 371 | 81 | 290 |
| M | 171 | 38 | 133 |
| F | 200 | 43 | 157 |
| Tobacco Plains (603) | |||
| Total | 178 | 85 | 93 |
| M | 97 | 57 | 40 |
| F | 81 | 28 | 53 |
| Toosey (718) | |||
| Total | 291 | 170 | 121 |
| M | 130 | 80 | 50 |
| F | 161 | 90 | 71 |
| Toquaht (666) | |||
| Total | 140 | 20 | 120 |
| M | 71 | * | * |
| F | 69 | * | * |
| Tsartlip (653) | |||
| Total | 895 | 606 | 289 |
| M | 462 | 334 | 128 |
| F | 433 | 272 | 161 |
| Tsawataineuk (636) | |||
| Total | 507 | 153 | 354 |
| M | 246 | 68 | 178 |
| F | 261 | 85 | 176 |
| Tsawout First Nation (654) | |||
| Total | 762 | 542 | 220 |
| M | 375 | 285 | 90 |
| F | 387 | 257 | 130 |
| Tsawwassen First Nation (577) | |||
| Total | 277 | 171 | 106 |
| M | 130 | 87 | 43 |
| F | 147 | 84 | 63 |
| Tsay Keh Dene (609) | |||
| Total | 404 | 218 | 186 |
| M | 206 | 108 | 98 |
| F | 198 | 110 | 88 |
| Tseshaht (665) | |||
| Total | 973 | 418 | 555 |
| M | 457 | 204 | 253 |
| F | 516 | 214 | 302 |
| Tseycum (655) | |||
| Total | 160 | 109 | 51 |
| M | 77 | 57 | 20 |
| F | 83 | 52 | 31 |
| Ts'kw'aylaxw First Nation (594) | |||
| Total | 522 | 268 | 254 |
| M | 263 | 146 | 117 |
| F | 259 | 122 | 137 |
| T'Sou-ke First Nation (657) | |||
| Total | 221 | 130 | 91 |
| M | 98 | 63 | 35 |
| F | 123 | 67 | 56 |
| Tzeachten (575) | |||
| Total | 391 | 254 | 137 |
| M | 173 | 109 | 64 |
| F | 218 | 145 | 73 |
| Uchucklesaht (667) | |||
| Total | 195 | 27 | 168 |
| M | 92 | * | * |
| F | 103 | * | * |
| Ucluelet First Nation (668) | |||
| Total | 623 | 212 | 411 |
| M | 312 | 123 | 189 |
| F | 311 | 89 | 222 |
| Ulkatcho (722) | |||
| Total | 947 | 696 | 251 |
| M | 453 | 341 | 112 |
| F | 494 | 355 | 139 |
| Union Bar (588) | |||
| Total | 118 | 11 | 107 |
| M | 63 | * | * |
| F | 55 | * | * |
| Upper Nicola (697) | |||
| Total | 870 | 392 | 478 |
| M | 436 | 207 | 229 |
| F | 434 | 185 | 249 |
| Upper Similkameen (599) | |||
| Total | 70 | 60 | 10 |
| M | 27 | * | * |
| F | 43 | * | * |
| West Moberly First Nations (545) | |||
| Total | 205 | 75 | 130 |
| M | 100 | 39 | 61 |
| F | 105 | 36 | 69 |
| Westbank First Nation (601) | |||
| Total | 682 | 416 | 266 |
| M | 345 | 216 | 129 |
| F | 337 | 200 | 137 |
| Wet'suwet'en First Nation (725) | |||
| Total | 223 | 116 | 107 |
| M | 112 | 57 | 55 |
| F | 111 | 59 | 52 |
| Whispering Pines/Clinton (702) | |||
| Total | 135 | 57 | 78 |
| M | 73 | 33 | 40 |
| F | 62 | 24 | 38 |
| Williams Lake (719) | |||
| Total | 559 | 237 | 322 |
| M | 266 | 119 | 147 |
| F | 293 | 118 | 175 |
| Xaxli'p (592) | |||
| Total | 930 | 386 | 544 |
| M | 475 | 202 | 273 |
| F | 455 | 184 | 271 |
| Xeni Gwet'in First Nations Government (714) | |||
| Total | 398 | 259 | 139 |
| M | 189 | 128 | 61 |
| F | 209 | 131 | 78 |
| Yakweakwioose (576) | |||
| Total | 63 | 33 | 30 |
| M | 26 | * | * |
| F | 37 | * | * |
| Yale First Nation (589) | |||
| Total | 151 | 68 | 83 |
| M | 71 | 36 | 35 |
| F | 80 | 32 | 48 |
| Yekooche (728) | |||
| Total | 217 | 93 | 124 |
| M | 105 | 53 | 52 |
| F | 112 | 40 | 72 |
| General List - British Columbia Region (848) | |||
| Total | 213 | * | * |
| M | 115 | 0 | 115 |
| F | 98 | * | * |
| British Columbia Region - 9 | |||
| Total | 125,789 | 59,667 | 66,122 |
| M | 61,903 | 30,848 | 31,055 |
| F | 63,886 | 28,819 | 35,067 |
*Data Suppressed due to low counts
Yukon
| Group and No. | Total (a + b) |
On Reserve and On Crown Land (includes lands affiliated with First Nations operating under Self-Government Agreements) (a) |
Off Reserve (b) |
|---|---|---|---|
| Gender | |||
| Aishihik (490) - Champagne and Aishihik First Nations | |||
| Total | 170 | 92 | 78 |
| M | 77 | 46 | 31 |
| F | 93 | 46 | 47 |
| Carcross/Tagish First Nations (491) | |||
| Total | 608 | 239 | 369 |
| M | 305 | 130 | 175 |
| F | 303 | 109 | 194 |
| Champagne (493) - Champagne and Aishihik First Nations | |||
| Total | 613 | 253 | 360 |
| M | 292 | 129 | 163 |
| F | 321 | 124 | 197 |
| Dease River (504) | |||
| Total | 162 | 68 | 94 |
| M | 87 | 39 | 48 |
| F | 75 | 29 | 46 |
| First Nation of Nacho Nyak Dun (495) | |||
| Total | 473 | 165 | 308 |
| M | 227 | 82 | 145 |
| F | 246 | 83 | 163 |
| Kluane First Nation (503) | |||
| Total | 141 | 71 | 70 |
| M | 65 | 37 | 28 |
| F | 76 | 34 | 42 |
| Kwanlin Dun First Nation (500) | |||
| Total | 968 | 643 | 325 |
| M | 506 | 361 | 145 |
| F | 462 | 282 | 180 |
| Liard First Nation (502) | |||
| Total | 1,069 | 492 | 577 |
| M | 540 | 286 | 254 |
| F | 529 | 206 | 323 |
| Little Salmon/Carmacks First Nation (492) | |||
| Total | 592 | 295 | 297 |
| M | 277 | 147 | 130 |
| F | 315 | 148 | 167 |
| Ross River (497) | |||
| Total | 483 | 335 | 148 |
| M | 242 | 178 | 64 |
| F | 241 | 157 | 84 |
| Selkirk First Nation (498) | |||
| Total | 503 | 294 | 209 |
| M | 251 | 149 | 102 |
| F | 252 | 145 | 107 |
| Ta'an Kwach'an (508) | |||
| Total | 231 | 107 | 124 |
| M | 103 | 50 | 53 |
| F | 128 | 57 | 71 |
| Taku River Tlingit (501) | |||
| Total | 374 | 93 | 281 |
| M | 182 | 53 | 129 |
| F | 192 | 40 | 152 |
| Teslin Tlingit Council (499) | |||
| Total | 556 | 259 | 297 |
| M | 292 | 149 | 143 |
| F | 264 | 110 | 154 |
| Tr'ondëk Hwëch'in (494) | |||
| Total | 692 | 193 | 499 |
| M | 352 | 106 | 246 |
| F | 340 | 87 | 253 |
| Vuntut Gwitchin First Nation (496) | |||
| Total | 512 | 262 | 250 |
| M | 260 | 144 | 116 |
| F | 252 | 118 | 134 |
| White River First Nation (506) | |||
| Total | 137 | 48 | 89 |
| M | 63 | 23 | 40 |
| F | 74 | 25 | 49 |
| General List - Yukon Region (808) | |||
| Total | * | * | * |
| M | * | * | * |
| F | * | * | * |
| Yukon Region - 8 | |||
| Total | 8,285 | 3,909 | 4,376 |
| M | 4,121 | 2,109 | 2,012 |
| F | 4,164 | 1,800 | 2,364 |
*Data Suppressed due to low counts
Northwest Territories
| Group and No. | Total (a + b) |
On Reserve and On Crown Land (includes lands affiliated with First Nations operating under Self-Government Agreements) (a) |
Off Reserve (b) |
|---|---|---|---|
| Gender | |||
| Acho Dene Koe (758) | |||
| Total | 626 | 520 | 106 |
| M | 310 | 263 | 47 |
| F | 316 | 257 | 59 |
| Aklavik (755) | |||
| Total | 409 | 258 | 151 |
| M | 194 | 133 | 61 |
| F | 215 | 125 | 90 |
| Behdzi Ahda" First Nation (771) | |||
| Total | 175 | 145 | 30 |
| M | 90 | 74 | 16 |
| F | 85 | 71 | 14 |
| Dechi Laot'i First Nations (774) | |||
| Total | 164 | 146 | 18 |
| M | 78 | * | * |
| F | 86 | * | * |
| Deh Gah Gotie Dene Council (760) | |||
| Total | 1,053 | 786 | 267 |
| M | 517 | 397 | 120 |
| F | 536 | 389 | 147 |
| Deline First Nation (754) | |||
| Total | 943 | 812 | 131 |
| M | 468 | 413 | 55 |
| F | 475 | 399 | 76 |
| Deninu K'ue First Nation (762) | |||
| Total | 819 | 442 | 377 |
| M | 426 | 238 | 188 |
| F | 393 | 204 | 189 |
| Dog Rib Rae (765) | |||
| Total | 2,734 | 2,138 | 596 |
| M | 1,377 | 1,107 | 270 |
| F | 1,357 | 1,031 | 326 |
| Fort Good Hope (752) | |||
| Total | 842 | 591 | 251 |
| M | 419 | 305 | 114 |
| F | 423 | 286 | 137 |
| Gameti First Nation (773) | |||
| Total | 321 | 308 | 13 |
| M | 169 | * | * |
| F | 152 | * | * |
| Gwichya Gwich'in (753) | |||
| Total | 419 | 226 | 193 |
| M | 204 | 118 | 86 |
| F | 215 | 108 | 107 |
| Inuvik Native (780) | |||
| Total | 521 | 182 | 339 |
| M | 223 | 75 | 148 |
| F | 298 | 107 | 191 |
| Jean Marie River First Nation (770) | |||
| Total | 133 | 104 | 29 |
| M | 62 | 47 | 15 |
| F | 71 | 57 | 14 |
| Ka'a'gee Tu First Nation (768) | |||
| Total | 64 | 47 | 17 |
| M | 38 | * | * |
| F | 26 | * | * |
| K'atlodeeche First Nation (761) | |||
| Total | 578 | 389 | 189 |
| M | 277 | 189 | 88 |
| F | 301 | 200 | 101 |
| Liidlii Kue First Nation (757) | |||
| Total | 1,210 | 758 | 452 |
| M | 600 | 384 | 216 |
| F | 610 | 374 | 236 |
| Lutsel K'e Dene First Nation (764) | |||
| Total | 698 | 486 | 212 |
| M | 346 | 257 | 89 |
| F | 352 | 229 | 123 |
| Nahanni Butte (766) | |||
| Total | 137 | 124 | 13 |
| M | 68 | * | * |
| F | 69 | * | * |
| Pehdzeh Ki First Nation (756) | |||
| Total | 326 | 256 | 70 |
| M | 155 | 116 | 39 |
| F | 171 | 140 | 31 |
| Salt River First Nation #195 (759) | |||
| Total | 841 | 270 | 571 |
| M | 423 | 131 | 292 |
| F | 418 | 139 | 279 |
| Sambaa K'e (Trout Lake) Dene (767) | |||
| Total | 117 | 103 | 14 |
| M | 48 | * | * |
| F | 69 | * | * |
| Tetlit Gwich'in (751) | |||
| Total | 1,335 | 922 | 413 |
| M | 650 | 461 | 189 |
| F | 685 | 461 | 224 |
| Tulita Dene (750) | |||
| Total | 611 | 373 | 238 |
| M | 294 | 188 | 106 |
| F | 317 | 185 | 132 |
| West Point First Nation (772) | |||
| Total | 72 | 33 | 39 |
| M | 37 | 13 | 24 |
| F | 35 | 20 | 15 |
| Wha Ti First Nation (769) | |||
| Total | 601 | 568 | 33 |
| M | 309 | 295 | 14 |
| F | 292 | 273 | 19 |
| Yellowknives Dene First Nation (763) | |||
| Total | 1,319 | 654 | 665 |
| M | 619 | 326 | 293 |
| F | 700 | 328 | 372 |
| Northwest Territories Region - 1 | |||
| Total | 17,068 | 11,641 | 5,427 |
| M | 8,401 | 5,893 | 2,508 |
| F | 8,667 | 5,748 | 2,919 |
*Data Suppressed due to low counts
Canada
| Group and No. | Total (a + b) |
On Reserve and On Crown Land (includes lands affiliated with First Nations operating under Self-Government Agreements) (a) |
Off Reserve (b) |
|---|---|---|---|
| Gender | |||
| All Regions | |||
| Total | 794,040 | 443,603 | 350,437 |
| M | 389,725 | 225,719 | 164,006 |
| F | 404,315 | 217,884 | 186,431 |
Footnote:
- Six Nations of the Grand River consists of the following 13 Registry Groups: Bay of Quinte Mohawk, Bearfoot Onondaga, Delaware, Konadaha Seneca, Lower Cayuga, Lower Mohawk, Niharondasa Seneca, Oneida, Onondaga Clear Sky, Tuscarora, Upper Cayuga, Upper Mohawk, Walker Mohawk (return to source paragraph)